Uso sistemático de medidas de desenlace informadas por el paciente (MDIP) para mejorar el tratamiento de los trastornos de salud mental frecuentes en adultos
Información
- DOI:
- https://doi.org/10.1002/14651858.CD011119.pub2Copiar DOI

- Base de datos:
-
- Cochrane Database of Systematic Reviews
- Versión publicada:
-
- 13 julio 2016see what's new
- Tipo:
-
- Intervention
- Etapa:
-
- Review
- Grupo Editorial Cochrane:
-
Grupo Cochrane de Trastornos mentales comunes
- Copyright:
-
- Copyright © 2016 The Cochrane Collaboration. Published by John Wiley & Sons, Ltd.
Cifras del artículo
Altmetric:
Citado por:
Autores
Contributions of authors
TK had the idea for the study and led on the protocol. TK and RC linked with CCMD. TK co‐ordinated the contributions from co‐authors.
TK and MEG identified relevant abstracts and titles from searches, and selected studies for inclusion, involving MM in the discussion where there were differences.TK and MEG searched for and screened ongoing trials. TK, MEG, ALB and KDJ acquired the trial reports.
TK, MEG, MM, RC and SG assessed included studies for risk of bias. TK, MM and KDJ made contact with original study authors.
MEG, TK, LA, AB and ALB extracted data from study reports. MEG, TK and AG entered data into Review Manager. BS, AG and MEG re‐checked the extracted data for accuracy against the study reports.
BS carried out the data analyses in discussion with TK and MEG. BS, TK, MEG and MM interpreted the results.
TK, MEG, BS and AG drafted the review. All the authors read and approved the final draft. TK is the guarantor of the review.
Sources of support
Internal sources
-
University of Southampton, UK.
Salary of Tony Kendrick and Michael Moore
-
University of York, UK.
Salary of Simon Gilbody
-
University of Bristol, UK.
Salary of Rachel Churchill
External sources
-
NIHR School for Primary Care Research, UK.
Beth Stuart is supported by a post‐doctoral award from the NIHR SPCR
-
National Institute for Health Research, Not specified.
Magdy El‐Gohary is supported by an NIHR GP In‐Practice Fellowship
Declarations of interest
The authors have declared the following relevant interests.
Tony Kendrick: lead researcher on a grant of £244,892 from the National Institue for Health Research (NIHR) Research for Patient Benefit programme, for the PROMDEP feasibility study of using PROMs to monitor patients with depression in primary care.
Unpaid member of the NICE Indicator Advisory Committee for England, which considers evidence about the effectiveness of interventions such as the one subject to this Cochrane review, in recommending whether GPs and Clinical Commissioning Groups should be incentivised to implement them.
Magdy El‐Gohary: none known.
Beth Stuart: co‐applicant on the PROMDEP study.
Simon Gilbody: co‐applicant on the PROMDEP study.
Rachel Churchill: leads and takes responsibility for the Cochrane Common Mental Disorders Group, which has supported parts of the review process and is funded by a grant from the National Institute of Health and Research (NIHR) in the UK.
Laura Aiken: none known.
Abhishek Bhattacharya: none known.
Amy Gimson: none known.
Anna Brütt: none known.
Kim de Jong: Two studies on which she was lead author are included in this review (De Jong 2012 and De Jong 2014), but TK and MEG carried out the data extraction from those studies.
Michael Moore: Co‐applicant on the PROMDEP study.
Acknowledgements
Cochrane review group funding acknowledgement:
The National Institute for Health Research (NIHR) is the largest single funder of the Cochrane Common Mental Disorders Group.
Disclaimer:
The views and opinions expressed therein are those of the authors and do not necessarily reflect those of the NIHR, NHS or the Department of Health.
Version history
| Published | Title | Stage | Authors | Version |
| 2016 Jul 13 | Routine use of patient reported outcome measures (PROMs) for improving treatment of common mental health disorders in adults | Review | Tony Kendrick, Magdy El‐Gohary, Beth Stuart, Simon Gilbody, Rachel Churchill, Laura Aiken, Abhishek Bhattacharya, Amy Gimson, Anna L Brütt, Kim de Jong, Michael Moore | |
| 2014 Jun 11 | Routine use of patient reported outcome measures (PROMs) for improving treatment of common mental health disorders in adults | Protocol | Tony Kendrick, Michael Moore, Simon Gilbody, Rachel Churchill, Beth Stuart, Magdy El‐Gohary | |
Differences between protocol and review
In the protocol we referred to 'psychiatric practice' or 'specialised psychiatric practice' as one of the three service settings in which research has been done. We decided to revise the term to 'multidisciplinary mental health care' to reflect the fact that the clinicians treating patients with CMHDs in that setting were not only psychiatrists, but also included psychologists, mental health social workers, and mental health nurses.
A decision was made to include studies in which the diagnoses of the large majority of participants were reported as CMHDs, even if a proportion of participants were not given a specific diagnosis, or were reported as having 'relationship' or 'interpersonal' difficulties, 'somatoform disorders', 'other' diagnoses not further specified, or 'administrative codes'. This was a change from the protocol as we planned originally to include only studies with participants diagnosed with one of the disorders listed in the protocol, but after discussion within the review group we decided to include these studies as they included a large majority of participants with CMHDs, and we considered that excluding them would be to the detriment of the review, through the omission of data that would otherwise be valid and available.
A decision was also made to include studies where a small number of participants carried a diagnosis of exclusion including substance misuse, eating disorder or psychosis, where the total number of such participants constituted less than 10% of the total study population. This was because many of the larger studies included a small number of these participants, and again we considered that excluding these studies would be to the detriment of the review through omission of data that would otherwise be valid and available.
Where studies did not report the diagnoses of participants, we decided to contact the corresponding authors to request any available information on the participants' diagnoses, and whether they would have met the review inclusion and exclusion criteria. This was an addition to the protocol agreed after discussion within the review study group, again in order not to omit data that would otherwise be valid and available.
Consequently, we agreed to carry out additional, post‐hoc sensitivity analyses of the meta‐analyses of studies using the OQ‐45 or ORS, omitting three studies included in the meta‐analyses which did not report the specific diagnoses of their participants (Reese 2009a; Reese 2009b; Trudeau 2001), and five which did not assign a specific diagnosis to 20% or more of their participants (Amble 2014; De Jong 2014; Lambert 2001; Murphy 2012; Trudeau 2001; Whipple 2003).
In the protocol for the review, we planned to use logistic regression to calculate and present odds ratios (ORs) and associated 95% CIs for dichotomous (binary) outcomes, such as changes in antidepressant drug prescriptions or referrals for psychological or psychiatric treatment. However, in the event, dichotomous outcomes were uncommon findings in the review and therefore it was agreed such data should be presented in narrative form only.
We decided post‐hoc to conduct an additional subgroup analysis, comparing studies involving Michael Lambert, the originator and owner of the OQ‐45 system, with studies not involving him, to explore whether potential benefits of the system were identified in independent evaluations. This was because the OQ‐45 was the PROM used in the large majority of studies in the meta‐analyses, and Michael Lambert was author or co‐author of a significant proportion of those studies.
Two further post‐hoc subgroup comparisons were also agreed between the authors of subgroups of participants who were identified in a number of studies as being at higher or lower risk for treatment failure, which was determined by the trajectory of their initial response to therapy. The low risk group was described as 'on‐track' (OT) for a good clinical response, and the high risk group as 'not on track' (NOT) or alternatively 'at risk', 'signal cases', or 'signal alert cases'. This was because several studies using the OQ‐45 or ORS PROM systems reported positive findings among the NOT participants in the absence of significant findings among their samples overall. One comparison included only the NOT subgroup, comparing outcomes in terms of symptom scores between feedback and non‐feedback arms. The second comparison included both the OT and NOT subgroups, comparing the number of treatment sessions received between feedback and non‐feedback arms, and including a formal test for subgroup differences to look for evidence of differences between OT and NOT subgroups. This was also a change from the protocol, as the number of treatment sessions was a secondary outcome, and originally we planned to conduct subgroup analyses restricted to the primary outcomes (namely symptoms and adverse effects).
Keywords
MeSH
Medical Subject Headings (MeSH) Keywords
Medical Subject Headings Check Words
Adult; Aged; Female; Humans; Male; Middle Aged;
PICO

PRISMA flow diagram

Risk of bias summary: review authors' judgements about each risk of bias item for each included study.

Risk of bias graph: review authors' judgements about each risk of bias item presented as percentages across all included studies.
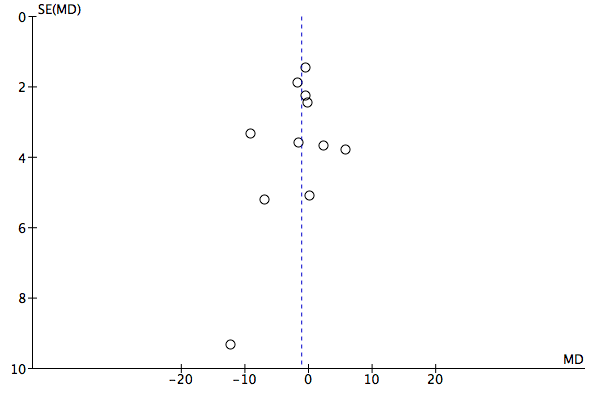
Funnel plot of comparison: 1 Difference in outcome feeding back OQ‐45 or ORS scores versus no feedback, outcome: 1.1 Mean improvement in symptom scores: OQ‐45 PROMS.

Funnel plot of comparison: 1 Difference in outcome feeding back OQ‐45 or ORS scores versus no feedback, outcome: 1.2 Mean improvement in symptom scores: OQ‐45 or ORS PROMs.

Comparison 1 Difference in outcome feeding back OQ‐45 or ORS scores versus no feedback, Outcome 1 Mean improvement in symptom scores: OQ‐45 PROMS.

Comparison 1 Difference in outcome feeding back OQ‐45 or ORS scores versus no feedback, Outcome 2 Mean improvement in symptom scores: OQ‐45 or ORS PROMs.

Comparison 1 Difference in outcome feeding back OQ‐45 or ORS scores versus no feedback, Outcome 3 Number of treatment sessions received: all participants.

Comparison 2 Subgroup analysis: Setting, Outcome 1 Mean improvement in symptom scores by setting.
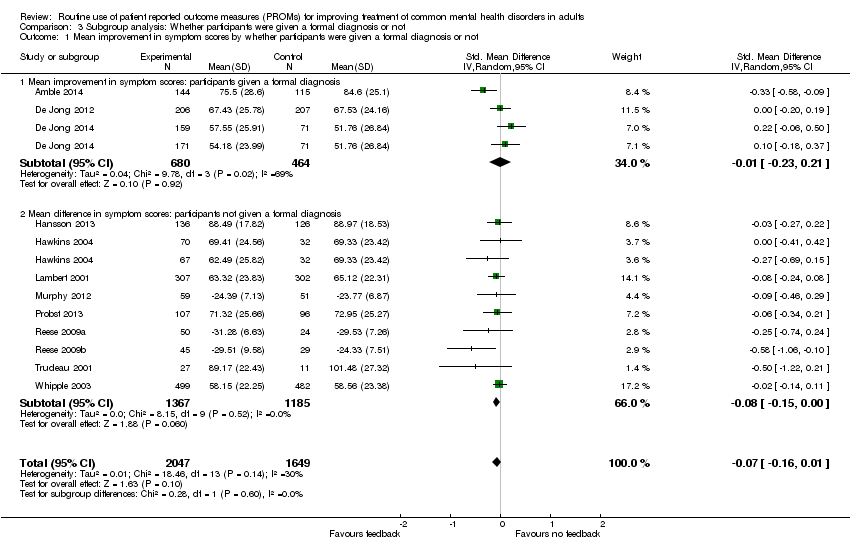
Comparison 3 Subgroup analysis: Whether participants were given a formal diagnosis or not, Outcome 1 Mean improvement in symptom scores by whether participants were given a formal diagnosis or not.

Comparison 4 Subgroup analysis: Feeback given to clinician, participant or both, Outcome 1 Mean improvement in symptom scores: feedback given to clinician, participant or both.

Comparison 5 Subgroup analysis: Whether feedback included treatment instructions or an algorithm, Outcome 1 Mean improvement in symptom scores by whether feedback included treatment instructions or an algorithm.

Comparison 6 Subgroup analysis: studies involving Michael Lambert versus studies not involving him, Outcome 1 Mean improvement in symptom scores by whether studies involved Michael Lambert.
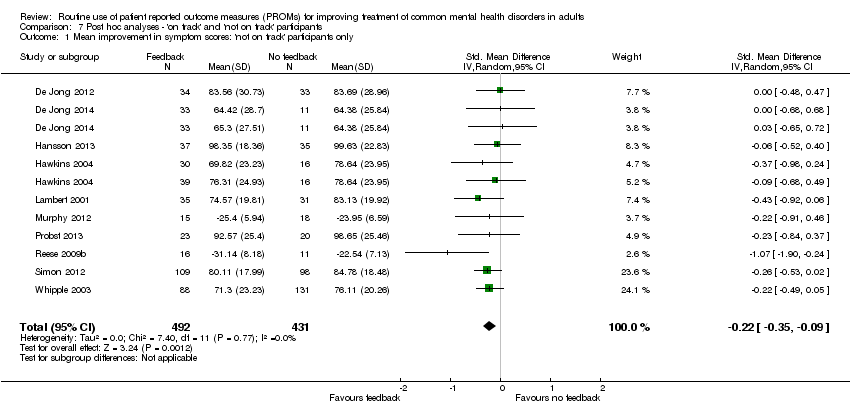
Comparison 7 Post hoc analyses ‐ 'on track' and 'not on track' participants, Outcome 1 Mean improvement in symptom scores: 'not on track' participants only.
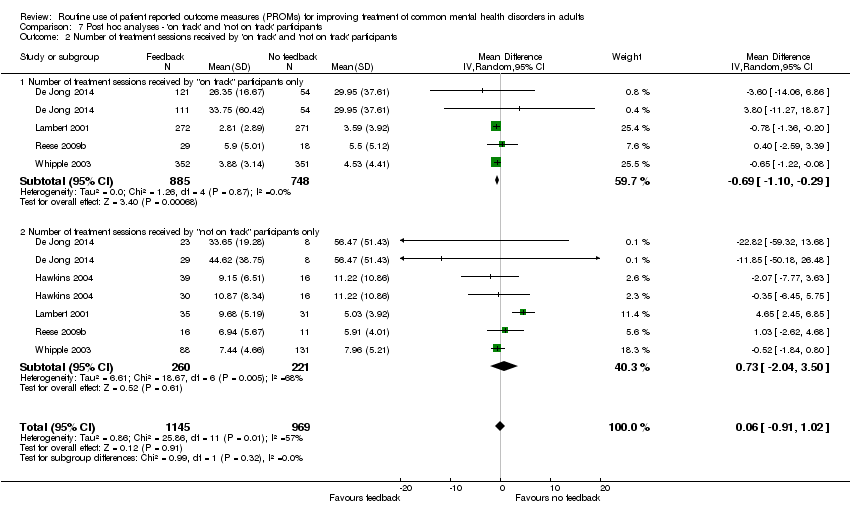
Comparison 7 Post hoc analyses ‐ 'on track' and 'not on track' participants, Outcome 2 Number of treatment sessions received by 'on track' and 'not on track' participants.
| Feedback of PROM scores for routine monitoring of common mental health disorders | |||||
| Patient or population: People with common mental health disorders1 Intervention: Feedback of PROM scores to clinician, or both clinician and patient Comparator: No feedback of PROM scores | |||||
| Outcomes and length of follow‐up | Illustrative risk | Number of participants | Quality of the evidence | Comments | |
| Assumed risk (range of means in no‐feedback groups) | Relative effect (95% CI) in feedback groups | ||||
| Mean improvement in symptom scores Follow‐up: 1‐6 months2 | Mean scores in no‐feedback groups ranged from 51.8 to 101.5 points for OQ‐45 and from 23.8 to 29.5 points for ORS. Standard deviations ranged from 17.8 to 28.6 points for OQ‐45 and from 7.1 to 9.6 points for ORS | Standard mean difference in symptom scores at end of study in feedback groups was 0.07 standard deviations lower | 3696 | ⊕⊕⊝⊝ | Neither study in the primary care setting used the OQ‐45 or ORS PROMs, and so could not be included in this meta‐analysis |
| Health‐related quality of life Follow‐up: 1‐5 months2 Medical Outcomes Study (SF‐12) physical and mental subscales). Scale from 0‐100 Follow‐up: 0‐1 year | Study results could not be combined in a meta‐analysis as data were not available in an appropriate format Mathias 1994 reported no significant differences between feedback and control groups on all nine domains of the SF‐36 Scheidt 2012 reported no significant differences between feedback and no‐feedback groups in physical or mental sub‐scale scores | 583 587 (1 study) | ⊕⊕⊕⊝ moderate7 | ||
| Adverse events Follow‐up: 6 months | Chang 2012 reported no immediate suicide risk across both feedback and no‐feedback groups combined. Number per group not given | 642 | ⊕⊕⊕⊝ moderate7 | ||
| Social functioning Follow‐up: 0‐1 year2 | Data for the social functioning subscale of the OQ‐45 were considered separately in Hansson 2013 and no difference was found | 262 (1 study) | ⊕⊕⊝⊝ low9 | ||
| Costs | Not estimable | 0 (0 studies) | No study assessed the impact of the intervention on direct or indirect costs | ||
| Changes in the management of CMHDs Changes in drug therapy and referrals for specialist care Follow‐up: 1‐6 months2 | Study results could not be combined in a meta‐analysis as data were not available in an appropriate format Chang 2012 and Mathias 1994 both reported no significant differences in changes in drug therapy between study arms Mathias 1994 reported mental health referrals were significantly more likely in the feedback group (OR 1.73, 95% CI 1.11 to 2.70) | 1215 | ⊕⊕⊕⊝ moderate7 | ||
| Changes in the management of CMHDs Follow‐up: 1‐6 months2 | Mean in no‐feedback groups ranged from 3.7 to 33.5 treatment sessions | Mean difference in number of treatment sessions in feedback groups was 0.02 lower | 2608 | ⊕⊕⊝⊝ | Post‐hoc analysis. Changes in medication and referrals for additional therapy were not assessed by any of these studies |
| CI: Confidence interval | |||||
| GRADE Working Group grades of evidence | |||||
| 1Studies were included if the majority of people diagnosed had CMHDs and no more than 10% had diagnoses of psychotic disorders, learning difficulties, dementia, substance misuse, or eating disorders 2Duration of therapy was variable in all studies and determined by the clinician or the patient, or both 6Downgraded two levels due to risk of bias (all included studies were judged at high risk of bias in at least two domains, in particular blinding of participants and outcome assessment, and attrition), and indirectness (although symptom scores were compared between feedback and non‐feedback groups, wider social functioning and quality‐of‐life measurements were not assessed in nearly all studies) 7Downgraded one level due to risk of bias (judged at high risk of bias in at least two domains, in particular blinding of participants and outcome assessment, and attrition) 8Number of PHQ‐9 questionnaires which contained reports of self‐harming thoughts 9Downgraded two levels due to risk of bias and imprecision, as total participant numbers were less than 400 10Downgraded two levels due to risk of bias and for imprecision: estimate of effect includes no effect and incurs very wide confidence intervals | |||||
| Outcome or subgroup title | No. of studies | No. of participants | Statistical method | Effect size |
| 1 Mean improvement in symptom scores: OQ‐45 PROMS Show forest plot | 9 | 3438 | Mean Difference (IV, Random, 95% CI) | ‐1.14 [‐3.15, 0.86] |
| 2 Mean improvement in symptom scores: OQ‐45 or ORS PROMs Show forest plot | 12 | 3696 | Std. Mean Difference (IV, Random, 95% CI) | ‐0.07 [‐0.16, 0.01] |
| 3 Number of treatment sessions received: all participants Show forest plot | 7 | 2608 | Mean Difference (IV, Random, 95% CI) | ‐0.02 [‐0.42, 0.39] |
| Outcome or subgroup title | No. of studies | No. of participants | Statistical method | Effect size |
| 1 Mean improvement in symptom scores by setting Show forest plot | 12 | 3696 | Std. Mean Difference (IV, Random, 95% CI) | ‐0.07 [‐0.16, 0.01] |
| 1.1 Multidisciplinary mental health care setting | 7 | 1848 | Std. Mean Difference (IV, Random, 95% CI) | ‐0.05 [‐0.18, 0.07] |
| 1.2 Psychological therapy setting | 5 | 1848 | Std. Mean Difference (IV, Random, 95% CI) | ‐0.10 [‐0.23, 0.03] |
| Outcome or subgroup title | No. of studies | No. of participants | Statistical method | Effect size |
| 1 Mean improvement in symptom scores by whether participants were given a formal diagnosis or not Show forest plot | 12 | 3696 | Std. Mean Difference (IV, Random, 95% CI) | ‐0.07 [‐0.16, 0.01] |
| 1.1 Mean improvement in symptom scores: participants given a formal diagnosis | 3 | 1144 | Std. Mean Difference (IV, Random, 95% CI) | ‐0.01 [‐0.23, 0.21] |
| 1.2 Mean difference in symptom scores: participants not given a formal diagnosis | 9 | 2552 | Std. Mean Difference (IV, Random, 95% CI) | ‐0.08 [‐0.15, 0.00] |
| Outcome or subgroup title | No. of studies | No. of participants | Statistical method | Effect size |
| 1 Mean improvement in symptom scores: feedback given to clinician, participant or both Show forest plot | 12 | 3696 | Std. Mean Difference (IV, Random, 95% CI) | ‐0.07 [‐0.16, 0.01] |
| 1.1 Mean improvement in symptom scores: feedback given only to the clinician | 2 | 140 | Std. Mean Difference (IV, Random, 95% CI) | ‐0.17 [‐0.63, 0.30] |
| 1.2 Mean improvement in symptom scores: feedback given explicitly to both clinician and participant | 6 | 862 | Std. Mean Difference (IV, Random, 95% CI) | ‐0.12 [‐0.30, 0.05] |
| 1.3 Mean improvement in symptom scores: clinicians permitted or encouraged to share feedback with participant | 6 | 2694 | Std. Mean Difference (IV, Random, 95% CI) | ‐0.05 [‐0.16, 0.06] |
| Outcome or subgroup title | No. of studies | No. of participants | Statistical method | Effect size |
| 1 Mean improvement in symptom scores by whether feedback included treatment instructions or an algorithm Show forest plot | 12 | 3696 | Std. Mean Difference (IV, Random, 95% CI) | ‐0.07 [‐0.16, 0.01] |
| 1.1 Mean improvement in symptom scores: treatment instructions or algorithm | 2 | 1184 | Std. Mean Difference (IV, Random, 95% CI) | ‐0.03 [‐0.14, 0.09] |
| 1.2 Mean improvement in symptom scores: no treatment instructions or algorithm | 10 | 2512 | Std. Mean Difference (IV, Random, 95% CI) | ‐0.09 [‐0.20, 0.02] |
| Outcome or subgroup title | No. of studies | No. of participants | Statistical method | Effect size |
| 1 Mean improvement in symptom scores by whether studies involved Michael Lambert Show forest plot | 9 | Std. Mean Difference (IV, Random, 95% CI) | Subtotals only | |
| 1.1 Mean improvement in symptom scores: studies involving Michael Lambert | 5 | 2032 | Std. Mean Difference (IV, Random, 95% CI) | ‐0.06 [‐0.15, 0.03] |
| 1.2 Mean improvement in symptom scores: studies not involving Michael Lambert | 4 | 1406 | Std. Mean Difference (IV, Random, 95% CI) | ‐0.02 [‐0.19, 0.15] |
| Outcome or subgroup title | No. of studies | No. of participants | Statistical method | Effect size |
| 1 Mean improvement in symptom scores: 'not on track' participants only Show forest plot | 10 | 923 | Std. Mean Difference (IV, Random, 95% CI) | ‐0.22 [‐0.35, ‐0.09] |
| 2 Number of treatment sessions received by 'on track' and 'not on track' participants Show forest plot | 5 | 2114 | Mean Difference (IV, Random, 95% CI) | 0.06 [‐0.91, 1.02] |
| 2.1 Number of treatment sessions received by "on track" participants only | 4 | 1633 | Mean Difference (IV, Random, 95% CI) | ‐0.69 [‐1.10, ‐0.29] |
| 2.2 Number of treatment sessions received by "not on track" participants only | 5 | 481 | Mean Difference (IV, Random, 95% CI) | 0.73 [‐2.04, 3.50] |
| Study ID | Response | Additional info | Outcome |
| No | Failed to respond | Email sent to [email protected] and [email protected] on 22 January 2015 regarding randomisation process, CGI‐S and PGI‐S outcomes and criteria for diagnosis | |
| Yes | Invited to become a co‐author | Replied immediately to an email sent on 17 June 2015. Provided details of data on OQ‐45 scores and further information on generation of random sequence and allocation concealment All data extraction was done by TK and MEG as KdJ became a co‐author of the review | |
| Yes | Reply on 28 January 2015 in response to email sent on 22 January: "We collected the data in a naturalistic setting at 2 clinics with clients who were already in treatment in some cases. We did collect outcome data over the course of the study period, but we do not have first and last measurements in all cases. I also do not have specific information regarding the clients (such as diagnoses). Therapists were aware which condition they were in as the independent variable was whether or not they received progress feedback. Clients did not know which condition they were in" | ||
| Yes | Emails sent to [email protected] on 22 January 2015, 29 July 2015 and 10 August 2015 enquiring about separate outcome data per diagnostic group. Reply on 30 August with requested information | ||
| No | Failed to contact | Study too old ‐ contact details of authors unobtainable | |
| No | Failed to respond | Email sent to [email protected]‐regensburg.de on 22 January 2015 regarding details of randomisation and blinding | |
| Yes | Reply on 3 February 2015 in response to email sent 22 January 2015: query about breakdown of outcome data per diagnostic group, with tabulated data provided | ||
| Yes | Reply on 3 February 2015 in response to email sent 22 January 2015: to query about randomisation, allocation concealment and outcome blinding: Randomisation: "When a client was assigned to a therapist, the first client was randomised using a random number generator to either the feedback or TAU condition. The second client was then assigned to the other condition." Allocation concealment: "This was done by the person who assigned clients at the respective centres. This was done after enrolment into the study. Investigators and client participants could not foresee which condition a participant would be placed into." Outcome blinding: "The researchers did not know which condition participants were in until the time of analysis." Query over discrepancy in data presented in main text and table: "The table is correct and it should be 4.69. That is what was used in the analyses as well." Further data regarding number of treatment sessions and standard deviations provided on request in December 2015 Further information provided on diagnoses of study participants on 3 May 2016, confirming that more than 90% of them would have had qualifying clinical diagnoses of anxiety or depressive disorders, or both | ||
| Yes | Reply on 26 March 2015 in response to email sent on 26 March 2015 enquiring about the details of managed care in place in some of the study participants, and about outcome data. "Managed care consisted of session limits and utilization review". Further email exchanges from 31 March to 2 April to enquire about blinding details. Reply on 13 May 2016 to email sent 13 May 2016, enquiring whether study participants would have met our review inclusion/exclusion characteristics, confirming that they would have met them | ||
| No | Failed to respond | Email sent to [email protected] on 22 January 2015 as listed as corresponding author on all four studies. Enquiries about randomisation procedure and allocation concealment. No reply regarding any of the studies was made. Further email sent to [email protected] and Michael Lambert on 17 July 2015, no reply received | |
| Yes | Email sent to [email protected] on 18 November 2015, reply received: further data provided on OQ‐45 outcomes and number of treatment sessions on 7 December 2015 |