| 1 Mental state: 1. General: average endpoint scores (PANSS subscale, lower=better) Show forest plot | 1 | 36 | Mean Difference (IV, Fixed, 95% CI) | 2.70 [‐2.14, 7.54] |
|
| 2 Mental state: 2. General: any change in general symptoms: Show forest plot | 1 | 14 | Risk Ratio (M‐H, Random, 95% CI) | 0.14 [0.01, 2.34] |
|
| 3 Mental state: 3. Specific: positive, negative symptoms ‐ average endpoint scores (PANSS subscales, lower = better): Show forest plot | 1 | | Mean Difference (IV, Random, 95% CI) | Subtotals only |
|
| 3.1 Mental state: Positive symptoms ‐ average endpoint score (PANSS positive subscale, lower=better) | 1 | 36 | Mean Difference (IV, Random, 95% CI) | 0.90 [‐2.21, 4.01] |
| 3.2 Mental state: Negative symptoms ‐ average endpoint score (PANSS negative subscale, lower=better) | 1 | 36 | Mean Difference (IV, Random, 95% CI) | 4.0 [0.79, 7.21] |
| 4 Mental state: 4. Specific: anxiety symptoms Show forest plot | 1 | 14 | Risk Ratio (M‐H, Random, 95% CI) | 3.0 [0.14, 63.15] |
|
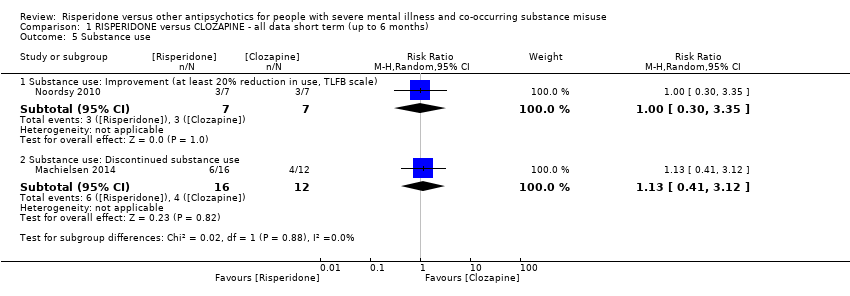
| 5 Substance use Show forest plot | 2 | | Risk Ratio (M‐H, Random, 95% CI) | Subtotals only |
|
| 5.1 Substance use: Improvement (at least 20% reduction in use, TLFB scale) | 1 | 14 | Risk Ratio (M‐H, Random, 95% CI) | 1.0 [0.30, 3.35] |
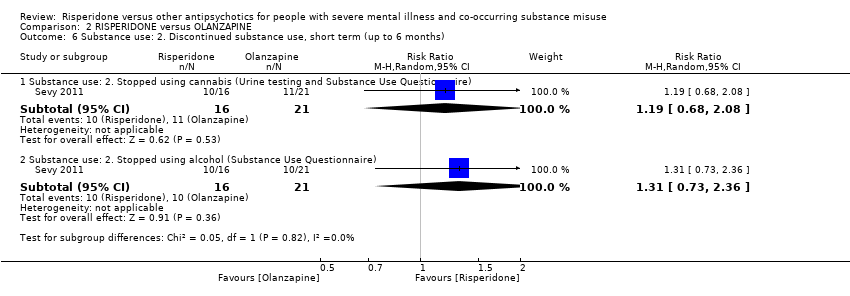
| 5.2 Substance use: Discontinued substance use | 1 | 28 | Risk Ratio (M‐H, Random, 95% CI) | 1.13 [0.41, 3.12] |
| 6 Subjective Well‐being: average endpoint scores (Subjective Well‐being under Neuroleptics scale, SWN scale, higher=better) Show forest plot | 1 | 36 | Mean Difference (IV, Random, 95% CI) | ‐6.0 [‐14.82, 2.82] |
|
| 7 Craving for substances Show forest plot | 1 | | Mean Difference (IV, Random, 95% CI) | Subtotals only |
|
| 7.1 Craving for substances: 1. Specific: current craving‐ average endpoint scores (Marijuana Craving Questionairre, MCQ, lower=better) | 1 | 28 | Mean Difference (IV, Random, 95% CI) | 7.00 [2.37, 11.63] |
| 7.2 Craving for substances: 2. Specific: past week craving‐ average endpoint scores (Obsessive Compulsive Drug Use Scale, OCDUS, lower=better) | 1 | 28 | Mean Difference (IV, Random, 95% CI) | 14.20 [4.45, 23.95] |
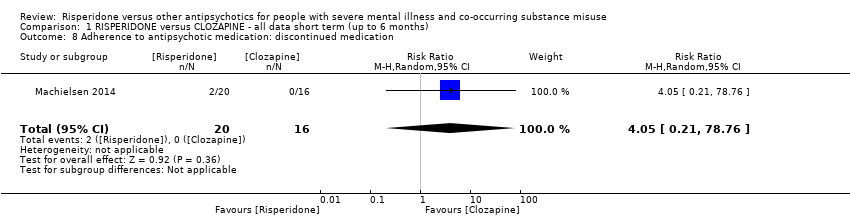
| 8 Adherence to antipsychotic medication: discontinued medication Show forest plot | 1 | 36 | Risk Ratio (M‐H, Random, 95% CI) | 4.05 [0.21, 78.76] |
|
| 9 Adverse effects. 1. Movement disorders Show forest plot | 2 | | Risk Ratio (M‐H, Random, 95% CI) | Subtotals only |
|
| 9.1 any extrapyramidal side‐effects | 2 | 50 | Risk Ratio (M‐H, Random, 95% CI) | 2.71 [0.30, 24.08] |
| 9.2 akathisia | 1 | 14 | Risk Ratio (M‐H, Random, 95% CI) | 2.0 [0.23, 17.34] |
| 10 Adverse effects: 2. Non‐movement disorder related side‐effects Show forest plot | 1 | | Risk Ratio (M‐H, Random, 95% CI) | Subtotals only |
|
| 10.1 Cardiovascular: palpitations | 1 | 14 | Risk Ratio (M‐H, Random, 95% CI) | 3.0 [0.14, 63.15] |
| 10.2 Cardiovascular: hypotension | 1 | 14 | Risk Ratio (M‐H, Random, 95% CI) | 0.33 [0.02, 7.02] |
| 10.3 Central nervous system: headache | 1 | 14 | Risk Ratio (M‐H, Random, 95% CI) | 0.2 [0.01, 3.54] |
| 10.4 Central Nervous System: somnolence | 1 | 14 | Risk Ratio (M‐H, Random, 95% CI) | 0.2 [0.03, 1.30] |
| 10.5 Dermatological: acne | 1 | 14 | Risk Ratio (M‐H, Random, 95% CI) | 3.0 [0.14, 63.15] |
| 10.6 Endocrinological: decreased libido | 1 | 14 | Risk Ratio (M‐H, Random, 95% CI) | 0.33 [0.02, 7.02] |
| 10.7 Ear and labarynthine: ear canal blockage | 1 | 14 | Risk Ratio (M‐H, Random, 95% CI) | 3.0 [0.14, 63.15] |
| 10.8 Gastrointestinal: abdominal pain | 1 | 14 | Risk Ratio (M‐H, Random, 95% CI) | 3.0 [0.14, 63.15] |
| 10.9 Gasstrointesinal: elevated liver function tests | 1 | 14 | Risk Ratio (M‐H, Random, 95% CI) | 3.0 [0.14, 63.15] |
| 10.10 Gastrointestinal: hypersalivation | 1 | 14 | Risk Ratio (M‐H, Random, 95% CI) | 0.11 [0.01, 1.74] |
| 10.11 General adverse effects: fatigue | 1 | 14 | Risk Ratio (M‐H, Random, 95% CI) | 0.33 [0.02, 7.02] |
| 10.12 Injuries: sprain | 1 | 14 | Risk Ratio (M‐H, Random, 95% CI) | 0.33 [0.02, 7.02] |
| 10.13 Metabolic: increased appetite | 1 | 14 | Risk Ratio (M‐H, Random, 95% CI) | 0.33 [0.02, 7.02] |
| 10.14 Metabolic: weight gain | 1 | 14 | Risk Ratio (M‐H, Random, 95% CI) | 1.0 [0.19, 5.24] |
| 10.15 Musculosceletal: ankle pain | 1 | 14 | Risk Ratio (M‐H, Random, 95% CI) | 0.33 [0.02, 7.02] |
| 10.16 Musculosceletal: knee and foot pain | 1 | 14 | Risk Ratio (M‐H, Random, 95% CI) | 0.33 [0.02, 7.02] |
| 10.17 Musculosceletal: muscle twitch | 1 | 14 | Risk Ratio (M‐H, Random, 95% CI) | 3.0 [0.14, 63.15] |
| 10.18 Renal: urinary retention | 1 | 14 | Risk Ratio (M‐H, Random, 95% CI) | 0.33 [0.02, 7.02] |
| 10.19 Renal: urinary urgency | 1 | 14 | Risk Ratio (M‐H, Random, 95% CI) | 0.33 [0.02, 7.02] |
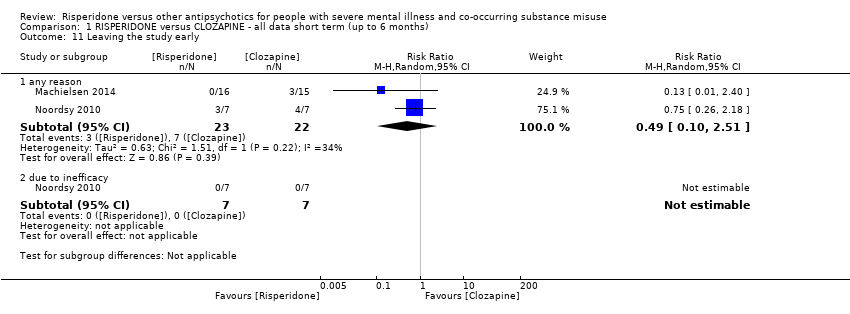
| 11 Leaving the study early Show forest plot | 2 | | Risk Ratio (M‐H, Random, 95% CI) | Subtotals only |
|
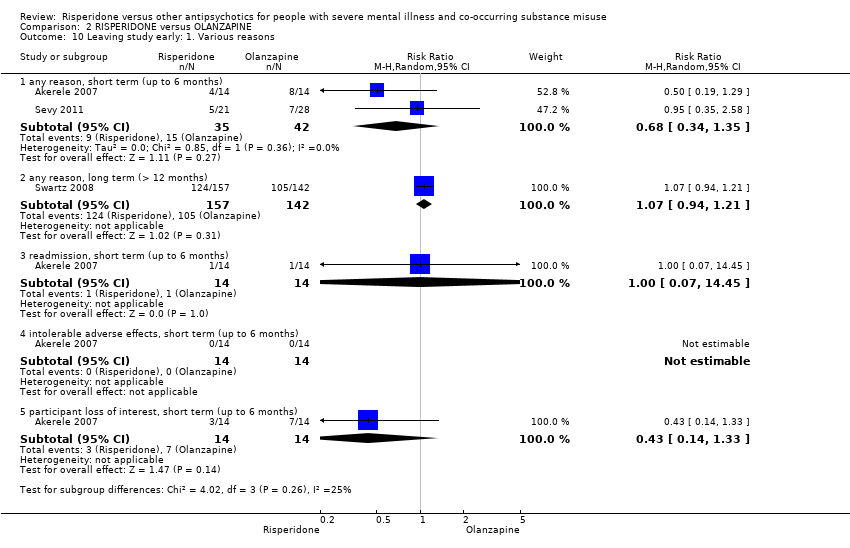
| 11.1 any reason | 2 | 45 | Risk Ratio (M‐H, Random, 95% CI) | 0.49 [0.10, 2.51] |
| 11.2 due to inefficacy | 1 | 14 | Risk Ratio (M‐H, Random, 95% CI) | 0.0 [0.0, 0.0] |