Quimioterapia y radioterapia para el cáncer de páncreas avanzado
Resumen
Antecedentes
El cáncer de páncreas (CP) es una enfermedad sumamente letal con pocas opciones efectivas de tratamiento. Durante las últimas décadas, se han evaluado muchos tratamientos anticancerosos en el contexto localmente avanzado y metastásico, con resultados contradictorios. Esta revisión intenta sintetizar todos los datos aleatorios disponibles para ayudar a informar mejor la toma de decisiones del paciente y el médico cuando se trata esta difícil enfermedad.
Objetivos
Evaluar el efecto de la quimioterapia, la radioterapia o ambas para el tratamiento de primera línea del cáncer de páncreas avanzado. El resultado primario fue la supervivencia general, mientras que los resultados secundarios incluyen la supervivencia libre de progresión, los eventos adversos de grado 3/4; la respuesta al tratamiento y la calidad de vida.
Métodos de búsqueda
Se hicieron búsquedas de estudios publicados y no publicados en las bases de datos CENTRAL (búsqueda 14 junio 2017), Embase (1980 hasta 14 junio 2017), MEDLINE (1946 hasta 14 junio 2017) y en CANCERLIT (1999 hasta 2002). También se buscaron de forma manual todos los resúmenes de congresos relevantes publicados hasta el 14 de junio de 2017.
Criterios de selección
Todos los estudios aleatorios que evaluaban los resultados de la supervivencia general en pacientes con adenocarcinoma ductal pancreático avanzado. La quimioterapia y la radioterapia, solas o en combinación, fueron los tratamientos aptos.
Obtención y análisis de los datos
Dos autores de la revisión analizaron los estudios de forma independiente, y un tercero resolvió cualquier discrepancia. Se extrajeron los datos sobre la supervivencia general (SG), la supervivencia libre de progresión (SLP), las tasas de respuesta, los eventos adversos (EA) y la calidad de vida (CdV), y se evaluó el riesgo de sesgo para cada estudio.
Resultados principales
Se incluyeron 42 estudios que consideraban la quimioterapia en 9463 pacientes con cáncer de páncreas avanzado. No se identificaron estudios elegibles sobre la radioterapia.
No se encontró ningún beneficio para la quimioterapia sobre el mejor tratamiento de apoyo. Sin embargo, dos estudios identificados no tuvieron datos suficientes para estar incluidos en el análisis, y muchos de los regímenes de quimioterapia estudiados eran antiguos.
En comparación con la gemcitabina sola, los participantes que recibieron 5FU presentaron resultados peores en la SG (CRI 1,69; IC del 95%: 1,26 a 2,27; evidencia de calidad moderada), la SLP (CRI 1,47; IC del 95%: 1,12 a 1,92) y la CdV. Por otro lado, dos estudios revelaron que el FOLFIRINOX fue mejor que la gemcitabina para la SG (CRI 0,51; IC del 95%: 0,43 a 0,60; evidencia de calidad moderada), la SLP (CRI 0,46; IC del 95%: 0,38 a 0,57) y las tasas de respuesta (CR 3,38; IC del 95%: 2,01 a 5,65), aunque aumentó la tasa de efectos secundarios. Los estudios que evaluaron el CO‐101, el ZD9331 y el exatecan no mostraron efectos beneficiosos ni perjudiciales en comparación con la gemcitabina sola.
La administración de gemcitabina en una tasa de dosis fija mejoró la SG (CRI 0,79; IC del 95%: 0,66 a 0,94; evidencia de alta calidad) aunque aumentó la tasa de efectos secundarios en comparación con la dosificación en bolo.
Al comparar las combinaciones de gemcitabina con la gemcitabina sola, la gemcitabina más platino mejoró la SLP (CRI 0,80; IC del 95%: 0,68 a 0,95) y las tasas de respuesta (CR 1,48; IC del 95%: 1,11 a 1,98) pero no la SG (CRI 0,94; IC del 95%: 0,81 a 1,08; evidencia de baja calidad). Se observó un aumento en la tasa de efectos secundarios. La gemcitabina más fluoropirimidina mejoró la SG (CRI 0,88; IC del 95%: 0,81 a 0,95), la SLP (CRI 0,79; IC del 95%: 0,72 a 0,87) y las tasas de respuesta (CR 1,78; IC del 95%: 1,29 a 2,47; evidencia de alta calidad), aunque también aumentó los efectos secundarios. La gemcitabina más inhibidor de topoisomerasa no mejoró los resultados de supervivencia aunque aumentó la toxicidad. Un estudio demostró que la gemcitabina más nab‐paclitaxel mejoró la SG (CRI 0,72; IC del 95%: 0,62 a 0,84; evidencia de alta calidad), la SLP (CRI 0,69; IC del 95%: 0,58 a 0,82) y las tasas de respuesta (CR 3,29; IC del 95%: 2,24 a 4,84) aunque aumentó los efectos secundarios. Las combinaciones multimedicamentosas que contienen gemcitabina (GEMOXEL o cisplatino/epirubicina/5FU/gemcitabina) mejoraron la SG (CRI 0,55; IC del 95%: 0,39 a 0,79; evidencia de baja calidad), la SLP (CRI 0,43; IC del 95%: 0,30 a 0,62) y la CdV.
No se encontró ninguna ventaja de supervivencia al comparar las combinaciones de 5FU con 5FU solo.
Conclusiones de los autores
La quimioterapia combinada recientemente ha superado la tradicional gemcitabina como el estándar de atención. El FOLFIRINOX y la gemcitabina más nab‐paclitaxel son sumamente eficaces, aunque el análisis muestra que otros regímenes de combinación también ofrecen un beneficio. La selección de la quimioterapia más apropiada para los pacientes individuales todavía sigue siendo difícil, y la estratificación clinicopatológica sigue siendo elusiva. El desarrollo de marcadores biológicos es esencial para ayudar a racionalizar la selección del tratamiento para los pacientes.
PICO
Resumen en términos sencillos
Efectos de los tratamientos anticancerosos sobre el cáncer de páncreas avanzado
Pregunta de la revisión
Esta revisión procuró responder la pregunta: ¿Cuáles son los tratamientos más efectivos para el cáncer de páncreas avanzado?
Antecedentes
El cáncer de páncreas (CP) es una enfermedad grave y a menudo mortal, y muchos pacientes no son diagnosticados hasta que presentan tumores avanzados que no pueden ser extraídos con cirugía. Los síntomas incluyen dolor abdominal, pérdida de peso y coloración amarillenta en la piel y los ojos. Hasta hace poco, la gemcitabina era el fármaco estándar para el tratamiento del cáncer de páncreas avanzado, aunque el mismo otorgaba a los pacientes sólo un beneficio moderado.
Características de los estudios
Se realizaron búsquedas de todos los estudios en pacientes con cáncer de páncreas que no podía ser sometido a cirugía (localmente avanzado) o que ya se había propagado más allá del páncreas (metastásico). Se encontraron 42 estudios clínicos que incluían a 9463 participantes que estaban recibiendo el primer tratamiento para el CP. La búsqueda está actualizada hasta junio de 2017.
Los estudios compararon un tratamiento versus el mejor tratamiento de apoyo (tratamiento de los síntomas solamente) u otro tipo de tratamiento. Los estudios tenían que evaluar la supervivencia general (o el tiempo hasta la muerte). El estudio podía evaluar la quimioterapia (fármacos que eliminan o desaceleran el crecimiento de las células cancerosas) o la radioterapia (tratamiento con rayos X). Se recopilaron los datos sobre la supervivencia, la tasa de respuesta tumoral, los efectos secundarios y la calidad de vida. Los resultados de los estudios clínicos que consideraron los tratamientos específicos/biológicos, las inmunoterapias, los tratamientos de segunda línea y los tratamientos locales para la enfermedad localmente avanzada se informarán en otra revisión Cochrane.
Resultados clave
Esta revisión ha mostrado que en las enfermedades avanzadas, la quimioterapia combinada con FOLFIRINOX (combinación de 5‐fluorouracilo, irinotecán, oxaliplatino); GEMOXEL (gemcitabina, oxaliplatino y capecitabina); cisplatino/epirubicina/5FU/gemcitabina; gemcitabina más nab‐paclitaxel; y gemcitabina más un agente de fluoropirimidina, proporcionan una ventaja de supervivencia sobre la gemcitabina sola. Estas combinaciones aumentan los efectos secundarios. La gemcitabina administrada lentamente mediante el uso de una tasa fija de infusión puede ser más efectiva que la administración de forma estándar, que es rápidamente durante 30 minutos.
Calidad de la evidencia
La calidad de la evidencia varió enormemente entre las comparaciones. La evidencia de calidad más alta se encontró para la gemcitabina versus gemcitabina en tasa de dosis fija y algunas de las combinaciones de gemcitabina (fluoropirimidina, topoisomerasa y taxano). La calidad de los estudios se consideró mediante factores como la adecuación de su realización, del informe de los resultados y si usaron un placebo.
Conclusiones de los autores
Summary of findings
| Anti‐cancer therapy versus best supportive care for advanced pancreatic cancer | |||||||
| Person or population: advanced pancreatic cancer | |||||||
| Outcomes | Anticipated risk of death* (95% CI) | Relative effect | № of participants | Quality of the evidence | Comments | Toxicity and QoL | |
| Risk with best supportive care | Risk with anti‐cancer therapy | ||||||
| Overall survival | Study population | HR 1.08 | 298 | ⊕⊕⊕⊝ | — | The analysis showed that toxicity data were inconsistently reported. Most studies reporting this outcome noted that gastrointestinal adverse events were the most frequent, occurring in between 15% to 31%. 1 study noted haematological toxicity was present in 81.5% of people. 2 out of the 3 studies that analysed QoL demonstrated a benefit with anti‐cancer therapy. 1 study showed no difference between the 2 groups. | |
| 707 per 1000 | 734 per 1000 | ||||||
| *The risk in the intervention group (and its 95% confidence interval) is based on the assumed risk in the comparison group and the relative effect of the intervention (and its 95% CI). | |||||||
| GRADE Working Group grades of evidence | |||||||
| aConfidence interval include both benefit and harm; optimal information size not met. | |||||||
| Various types of chemotherapy versus gemcitabine for advanced pancreatic cancer | |||||||
| Person or population: advanced pancreatic cancer | |||||||
| Outcomes | Anticipated risk of death* (95% CI) | Relative effect | № of participants | Quality of the evidence | Comments | Toxicity and QoL | |
| Risk with gemcitabine | Risk with various types of chemotherapy | ||||||
| Overall survival ‐ 5FU | Study population | HR 1.69 | 126 | ⊕⊕⊕⊝ | Only 1 study | More toxicity was seen in the gemcitabine arm. Clinical benefit was improved in the gemcitabine arm | |
| 825 per 1000 | 948 per 1000 | ||||||
| Overall survival ‐ FOLFIRINOX | Study population | HR 0.51 | 652 | ⊕⊕⊕⊝ | — | More toxicity was seen in the FOLFIRINOX arm. Longer time to degradation of QoL in FOLFIRINOX arm | |
| 794 per 1000 | 554 per 1000 | ||||||
| Overall survival ‐ Fixed dose rate gemcitabine | Study population | HR 0.79 | 644 | ⊕⊕⊕⊕ | — | More toxicity in the fixed‐dose rate arm. QoL was not tested | |
| 880 per 1000 | 812 per 1000 | ||||||
| Overall survival ‐ CO‐101 | Study population | HR 1.07 | 367 | ⊕⊕⊕⊝ | Only 1 study | Toxicity was similar in both arms, QoL was not tested | |
| 854 per 1000 | 872 per 1000 | ||||||
| Overall survival ‐ ZD9331 | Study population | HR 0.86 | 55 | ⊕⊕⊕⊝ | Only 1 study | Toxicity was similar in both arms, QoL was not tested | |
| 560 per 1000 | 506 per 1000 | ||||||
| Overall survival ‐ Exatecan | Study population | HR 1.27 | 339 | ⊕⊕⊕⊝ | Only 1 study | Toxicity was similar in both arms, QoL was superior in the gemcitabine arm | |
| 776 per 1000 | 851 per 1000 | ||||||
| *The risk in the intervention group (and its 95% confidence interval) is based on the assumed risk in the comparison group and the relative effect of the intervention (and its 95% CI). | |||||||
| GRADE Working Group grades of evidence | |||||||
| aSmall sample size; optimal information size not met. | |||||||
| Gemcitabine combinations versus gemcitabine alone for advanced pancreatic cancer | |||||||
| Person or population: advanced pancreatic cancer | |||||||
| Outcomes | Anticipated risk of death* (95% CI) | Relative effect | № of participants | Quality of the evidence | Comments | Toxicity and QoL | |
| Risk with gemcitabine alone | Risk with gemcitabine combinations | ||||||
| Overall survival ‐ Gemcitabine plus platinum agent | Study population | HR 0.94 | 1140 | ⊕⊕⊝⊝ | — | More toxicity in the combination arm with no differences shown in QoL | |
| 705 per 1000 | 683 per 1000 | ||||||
| Overall survival ‐ Gemcitabine plus fluoropyrimidine | Study population | HR 0.89 | 2718 | ⊕⊕⊕⊕ | — | More toxicity in the combination arm. 2 studies showed no difference in QoL, 2 studies showed an improved QoL in the combination arm | |
| 690 per 1000 | 648 per 1000 | ||||||
| Overall survival ‐ Gemcitabine plus topoisomerase inhibitor | Study population | HR 1.01 | 839 | ⊕⊕⊕⊕ | — | More toxicity in the combination arm. In 1 study, QoL was not different between the 2 arms | |
| 800 per 1000 | 803 per 1000 | ||||||
| Overall survival ‐ Gemcitabine plus taxane | Study population | HR 0.72 | 861 | ⊕⊕⊕⊕ | 1 study only | More toxicity in the combination arm. QoL not measured | |
| 779 per 1000 | 663 per 1000 | ||||||
| Overall survival ‐ Gemcitabine plus other combinations of chemotherapy | Study population | HR 0.55 | 166 | ⊕⊕⊝⊝ | — | Toxicity measured in 1 study and was not different. QoL was shown to be improved in the combination arms in both studies | |
| 850 per 1000 | 648 per 1000 | ||||||
| Overall survival ‐ Gemcitabine plus other agent(s) | Study population | HR 0.79 | 767 | ⊕⊕⊝⊝ | There was an increase in anaemia in the combination arm. 2 studies measured QoL and it was similar in both treatment arms | ||
| 825 per 1000 | 748 per 1000 | ||||||
| *The risk in the intervention group (and its 95% confidence interval) is based on the assumed risk in the comparison group and the relative effect of the intervention (and its 95% CI). | |||||||
| GRADE Working Group grades of evidence | |||||||
| aTwo studies were in abstract form and could not have full assessment completed. | |||||||
| Fluoropyrimidine combinations versus fluoropyrimidine alone for advanced pancreatic cancer | ||||||
| Person or population: advanced pancreatic cancer | ||||||
| Outcomes | Anticipated risk of death* (95% CI) | Relative effect | № of participants | Quality of the evidence | Toxicity and QoL | |
| Risk with fluoropyrimidine alone | Risk with fluoropyrimidine combinations | |||||
| Overall survival | Study population | HR 0.84 | 491 | ⊕⊕⊝⊝ | Toxicity was not different between the 2 treatment arms. QoL was measured in 1 study and showed an improvement in the combination arm | |
| 838 per 1000 | 783 per 1000 | |||||
| *The risk in the intervention group (and its 95% confidence interval) is based on the assumed risk in the comparison group and the relative effect of the intervention (and its 95% CI). | ||||||
| GRADE Working Group grades of evidence | ||||||
| aHigh statistical heterogeneity. | ||||||
Antecedentes
Las estadísticas mundiales del cáncer publicadas recientemente indican que el cáncer de páncreas (CP) representó 184 400 muertes en todo el mundo en 2012; y se observó la incidencia más alta en los hombres de países de ingresos altos a 8,6 casos por 100 000 (Torre 2015). En Australia, aunque el CP es relativamente poco común (incidencia de 11 por 100 000), es sumamente letal, y representa la cuarta causa principal de muerte causada por el cáncer (Tracey 2010). El National Cancer Institute de los EE.UU. ha informado una supervivencia a cinco años de un 21,5% para los que presentan enfermedades localizadas (www.cancer.gov); sin embargo, una revisión del Finnish Cancer Registry mostró una supervivencia a cinco años de sólo un 4,3% para los que presentan enfermedades localizadas y una supervivencia general a cinco años de un 0,2% (Carpelan 2005).
El CP es un cáncer notoriamente insidioso, que comúnmente se presenta con síntomas vagos y no específicos que constan clásicamente de la tríada de dolor abdominal epigástrico, pérdida de peso e ictericia (Howard 1977; Warshaw 1992), y que empeoran gradualmente con el transcurso del tiempo. La exploración física a menudo es normal, con el signo más común de un hígado ampliado presente en menos de la mitad de los pacientes (Von Hoff 2005). Por lo tanto, la mayoría de los pacientes presentan enfermedades avanzadas cuando son diagnosticados.
Aproximadamente un 10% de los carcinomas pancreáticos en estadio inicial son susceptibles a la cirugía curativa (Siegel 2013). Sin embargo, el riesgo de recaída después de la resección quirúrgica todavía es muy alto, y sólo un 10% de los pacientes sobrevive por cinco años (Conlon 1996; Shahrudin 1997). Aunque los estudios informaron un beneficio para la quimioterapia en la enfermedad avanzada (Burris 1997; Heinemann 2008; Conroy 2011; Von Hoff 2013), la función de la segunda línea de quimioterapia y las posteriores sigue siendo polémica (Nagrial 2015). Los beneficios de la radioterapia, ya sea sola o en combinación, como un tratamiento paliativo para la enfermedad avanzada o recidivante, son inciertos (Sultana 2007). Hammel 2013 evaluó las técnicas contemporáneas de quimioterapia y radioterapia aunque no demostró un beneficio de supervivencia en la enfermedad localmente avanzada. Están surgiendo tratamientos biológicos en el tratamiento del cáncer de páncreas aunque aún deben encontrar su lugar en la práctica clínica habitual (Castellanos 2011).
Hay otros metanálisis publicados que consideran diversos aspectos cubiertos por esta revisión. Li 2014 analizó ocho estudios que evaluaron los datos aleatorios sobre el uso de los agentes gemcitabina y fluoropirimidina, y encontró un beneficio del uso de gemcitabina más fluoropirimidina. Petrelli 2014 analizó 29 estudios que evaluaron la monoterapia con gemcitabina versus combinaciones de quimioterapia, y encontró mejorías en los resultados con las combinaciones de quimioterapia. Dos estudios han usado un metanálisis de redes de Bayesian para realizar las comparaciones directas e indirectas de las combinaciones de quimioterapia (Chan 2014; Gresham 2014). Chan 2014 estableció la conclusión de que el FOLFIRINOX probablemente fue el régimen más efectivo en el estadio avanzado. Dos metanálisis han evaluado la quimioterapia más radioterapia (Bernstein 2014; Chen 2013), y ambos encontraron un beneficio pequeño del agregado de quimioterapia a la radiación; sin embargo, ninguno incluyó el estudio reciente realizado por Hammel 2013.
Los tratamientos anticancerosos en el contexto metastásico se orientan idealmente a mejorar la calidad y la duración de la vida del paciente, con efectos secundarios tolerables. Esta revisión analizará tanto los efectos anticancerosos como los efectos adversos de los tratamientos en pacientes con cáncer de páncreas.
Descripción de la afección
El adenocarcinoma ductal pancreático (ACDP) es un tipo de cáncer que surge de los conductos en la glándula del páncreas. Puede localizarse en el páncreas (enfermedad local), ser localmente avanzado (todavía limitado al área alrededor del páncreas aunque posiblemente involucra las glándulas linfáticas u otras estructuras inmediatamente adyacentes) o metastásico (con propagación del cáncer a áreas distantes).
Esta revisión incluye estudios en pacientes con CP localmente avanzado (no susceptible a los tratamientos locales) o metastásico, formalmente definido del siguiente modo (Callery 2009).
-
Localmente avanzado o inoperable, definido por:
-
recubrimiento mayor que 180° de la vena mesentérica superior, cualquier tronco celiaco;
-
oclusión no reconstruible de la vena superior mesentérica o portal;
-
invasión o recubrimiento aórtico;
-
compromiso ganglionar más allá del área de la resección.
-
-
Metastásico, definido por los sitios distantes de la enfermedad.
Descripción de la intervención
Quimioterapia
La quimioterapia abarca todos los tratamientos con fármacos citotóxicos o antineoplásicos, intravenosos u orales, que funcionan al eliminar o desacelerar el crecimiento de las células cancerosas. Aunque los esquemas difieren entre los tratamientos, la mayoría se administra en una base de cuatro semanas (un ciclo) durante hasta seis ciclos.
Radioterapia
La radioterapia utiliza rayos X para destruir o lesionar las células cancerosas para que no puedan multiplicarse (Queensland Cancer Fund 2012). Se administra de diversas formas.
-
Radioterapia de haz externo: administrada durante varias sesiones (fracciones) utilizando una fuente de radioterapia externa que emite rayos X, rayos gamma, electrones o partículas pesadas.
-
Radioterapia corporal estereotáctica: una técnica sumamente conformal (específica) para aplicar la radioterapia de haz externo en una única fracción (radiocirugía estereotáctica) o varias fracciones (radioterapia estereotáctica).
-
Braquiterapia: radioterapia interna que utiliza una fuente radiactiva colocada en el páncreas o adyacente al mismo y administrada en una única fracción o en un número de fracciones, administrada sola o en combinación con radioterapia de haz externo.
-
Radioterapia intraoperatoria: administración de radioterapia de fuente externa o braquiterapia en el momento de la intervención quirúrgica, administrada sola o en combinación con radioterapia de haz externo.
Mejor tratamiento de apoyo
El mejor tratamiento de apoyo en las enfermedades avanzadas se define como todo lo que no sea quimioterapia. Puede incluir el control de los síntomas con radioterapia (no en el sitio primario), cirugía paliativa, inserción de stent biliar, analgesia, transfusión de sangre y apoyo psicológico o social.
De qué manera podría funcionar la intervención
El objetivo principal para todos los tratamientos para el cáncer de páncreas localmente avanzado o metastásico es paliar los síntomas y mejorar la supervivencia general (ver Apéndice 1, 'Glosario de términos'). En general, la quimioterapia y la radioterapia pueden eliminar potencialmente las células cancerosas en el cuerpo y reducir la gravedad de la enfermedad. A su vez, lo anterior puede reducir los síntomas y aumentar el tiempo de supervivencia. En el contexto avanzado, la quimioterapia y la radioterapia no ofrecen una curación. Por lo general el mejor tratamiento de apoyo es administrado junto con quimioterapia y radioterapia, aunque puede ser el único tratamiento administrado a algunos pacientes. Todos los tratamientos anticancerosos pueden causar efectos secundarios, que comúnmente incluyen fatiga, náuseas, vómitos, recuentos sanguíneos bajos (hemoglobina, células blancas y plaquetas) y diarrea. La radioterapia puede causar dolor local, erupción cutánea, fatiga, náuseas y vómitos.
Por qué es importante realizar esta revisión
Debido al pronóstico deficiente del CP, la toma de decisiones clínicas basadas en evidencia es fundamental para guiar a los pacientes a través de los tratamientos. La realización de un metanálisis de los estudios asegurará que los médicos y los pacientes tengan una referencia para informar sus elecciones clínicas.
El metanálisis publicado previamente en Yip 2009 ha sido criticado por no utilizar los cocientes de riesgos instantáneos para evaluar la supervivencia (Sultana 2007). Esta actualización usará los cocientes de riesgos instantáneos y también evaluará la calidad de vida.
El CP es un tipo de cáncer notoriamente difícil sobre el cual realizar estudios clínicos y existe mucha controversia. Aunque hay evidencia sobre el contexto de primera línea que apoya la administración de FOLFIRINOX (Conroy 2011), gemcitabina más erlotinib (Moore 2007), gemcitabina más fluoropirimidina (Cunningham 2009), o nab‐paclitaxel (Von Hoff 2013), aún hay preguntas con respecto a la toxicidad, el costo y los beneficios de supervivencia. Hay evidencia conflictiva sobre el lugar y el régimen de quimiorradiación y también existe debate acerca del fármaco y la dosis óptima (Kim 2007; Philip 2011).
Los metanálisis anteriores han tenido criterios de búsqueda limitados (Chan 2014; Li 2014; Petrelli 2014), o han usado sólo datos aleatorios de fase III (Gresham 2014). Aquí, se ha intentado sintetizar y organizar todos los datos aleatorios disponibles en cuanto a los pacientes que reciben tratamiento para el cáncer de páncreas avanzado con objeto de ayudar a informar la toma de decisiones clínicas y guiar la investigación adicional en esta área.
Objetivos
Evaluar el efecto de la quimioterapia, la radioterapia o ambos para el tratamiento de primera línea del cáncer de páncreas avanzado. El resultado primario fue la supervivencia general, mientras los resultados secundarios incluyen la supervivencia libre de progresión, los eventos adversos de grado 3/4; la respuesta al tratamiento y la calidad de vida.
Métodos
Criterios de inclusión de estudios para esta revisión
Tipos de estudios
Estudios controlados aleatorios, tanto publicados como no publicados, que comparaban uno de los tipos de intervención versus placebo, otro tipo de intervención o la mejor atención de apoyo.
Tipos de participantes
Pacientes con diagnóstico de adenocarcinoma pancreático confirmado por resultados histológicos o citológicos (investigaciones en células o tejidos del cuerpo). Los estudios que incluyeron a pacientes con enfermedades avanzadas, inoperables o recurrentes reunieron los requisitos para la inclusión.
Tipos de intervenciones
Cualquier tipo de quimioterapia, radioterapia o la combinación de quimioterapia más radioterapia versus placebo, ningún tratamiento, el mejor tratamiento de apoyo u otra quimioterapia o régimen de tratamiento con radioterapia.
El mejor tratamiento de apoyo en las enfermedades avanzadas puede incluir el control de los síntomas con radioterapia (no en el sitio primario), cirugía paliativa, inserción de stent biliar, analgesia, transfusión de sangre y apoyo psicológico/social.
Se realizaron búsquedas de las intervenciones que pertenecían a las siguientes comparaciones.
-
Cualquier tratamiento con quimioterapia versus placebo, ningún tratamiento o el mejor tratamiento de apoyo.
-
Cualquier tratamiento con quimioterapia versus cualquier otro tratamiento con quimioterapia.
-
Cualquier tratamiento con radioterapia versus placebo, ningún tratamiento o el mejor tratamiento de apoyo.
-
Cualquier tratamiento con radioterapia versus cualquier otro tratamiento con radioterapia.
-
Cualquier combinación de radioterapia y quimioterapia versus placebo, ningún tratamiento o el mejor tratamiento de apoyo.
-
Cualquier combinación de radioterapia y quimioterapia versus cualquier otra combinación de radioterapia y quimioterapia.
Después de completar la búsqueda, los estudios se organizaron en cuatro comparaciones específicas.
-
Tratamiento anticanceroso versus el mejor tratamiento de apoyo
-
Diversos tipos de quimioterapia versus gemcitabina
-
Combinaciones de gemcitabina versus gemcitabina sola
-
Combinaciones de fluoropirimidina versus fluoropirimidina sola
Tipos de medida de resultado
Resultados primarios
Supervivencia general (SG): supervivencia hasta la muerte por cualquier causa
Resultados secundarios
-
Supervivencia libre de progresión (SLP) ‐ tiempo hasta la progresión de la enfermedad en un tratamiento determinado. Por lo general, lo anterior se detecta mediante un aumento del tamaño o el número de lesiones del cáncer observadas en una tomografía computarizada (TC) mediante los criterios Response Evaluation Criteria in Solid Tumours (Nishino 2010).
-
Calidad de vida (CdV), medida con un instrumento validado, como el European Organisation for Research and Treatment of Cancer (EORTC) Quality of Life Questionnaire (QLQ‐C30) para los pacientes con cáncer (eortc.be/qol/).
-
Tasas de respuesta ‐ las mismas se relacionan con el encogimiento del cáncer en respuesta al tratamiento y se mide generalmente en tomografías computarizadas, donde el encogimiento del cáncer es definido según los criterios RECIST (Nishino 2010).
-
Eventos adversos de grado 3/4 ‐ los eventos adversos son definidos por el National Cancer Institute (cancer.gov) como un signo o síntoma no favorable y no intencional asociado con un tratamiento médico. La gravedad puede dividirse en grados. El grado 3 se clasifica como un evento grave o médicamente significativo pero que no presenta una amenaza inmediata para la vida. Se indica la hospitalización, y los efectos limitan la capacidad de los pacientes del autocuidado. El grado 4 se clasifica como un evento potencialmente mortal que requiere atención urgente.
Métodos de búsqueda para la identificación de los estudios
The authors completed searches to identify all relevant published and unpublished randomised controlled studies. Articles published in any language were eligible for inclusion.
We searched the following electronic databases.
-
Cochrane Central Register of Controlled Trials (CENTRAL; 2017; Issue 6), which includes the Cochrane Upper Gastrointestinal and Pancreatic Diseases Group Trials Register, in the Cochrane Library (searched 14 June 2017); Appendix 2.
-
MEDLINE (1946 to 14 June 2017); Appendix 3.
-
EMBASE (1980 to 14 June 2017); Appendix 4.
-
CANCERLIT (1999 to 2002). We did not undertake subsequent searches in CANCERLIT, as the database merged with MEDLINE in 2002.
To identify randomised controlled studies, we applied phases one, two and three of the Cochrane highly sensitive search strategy, as described in the Cochrane Handbook for Reviews of Interventions (Higgins 2011).
Búsquedas electrónicas
We handsearched reference lists from studies and review articles from the electronic searching to identify further relevant studies. We also handsearched published abstracts from the following conference proceedings.
-
American Gastroenterological Association (AGA) (1994 to 2014).
-
American Society of Clinical Oncology (ASCO) (1996 to 2016).
-
American Association of Cancer Research (AACR) (1957 to 2014).
-
American Pancreatic Association (APA) (2001 to 2014).
-
Digestive Disease Week (DDW) (1994 to 2014).
-
European Cancer Conference (ECCO) (1997, 1999, 2001, 2003, 2005, 2007, 2009, 2011, 2013).
-
European Society of Medical Oncology (ESMO) (1998, 2000, 2002, 2004, 2006, 2008, 2010, 2012, 2014).
-
Joint ECCO/ESMO meeting (2009, 2010, 2011, 2013).
-
European Pancreatic Club (EPC) (2000 to 2014).
-
Gastrointestinal Cancers Symposium (2007 to 2015).
-
United European Gastroenterology Week (UEGF) (1960 to 2014).
We searched the following information resources.
-
National Cancer Institute Physician Data Query.
-
UK Co‐ordinating Committee on Cancer Research.
We also searched the following study registers.
-
Australian and New Zealand Clinical Trials Registry.
-
National Research Register.
-
Medical Research Council.
-
Clinicaltrials.gov.
-
Current Controlled Trials.
-
Trialscentral.
-
Center Watch.
Búsqueda de otros recursos
We searched the Internet using the Google search engine. In addition, we contacted members of the Cochrane Upper Gastrointestinal and Pancreatic Diseases Group and other experts in the field and ask them to provide details of outstanding clinical studies and any relevant unpublished materials that were known to them.
Obtención y análisis de los datos
Selección de los estudios
We scanned titles of studies from the electronic search, removing duplicates. Two independent review authors (VC and AN) then considered the titles and abstracts to exclude clearly ineligible studies. We retrieved the full text of all remaining records, and two review authors (VC and AN) independently assessed them against inclusion criteria for the review, resolving disagreements with adjudication by a third review author (DY) according to the process outlined in Chapter 7.2.3 of the Cochrane Handbook for Systematic Reviews of Interventions (Higgins 2011). We documented reasons for excluding studies according to Higgins 2011.
Extracción y manejo de los datos
Two independent review authors (VC and AN) extracted data, recording the inclusion/exclusion criteria, number of participants and treatment arms for each study. For survival outcomes, we recorded hazard ratios (HRs) for OS and PFS from the published data where possible. If not reported, then we extracted time‐to‐event data and derived the HRs using the methods described in Tierney 2007. We also extracted median survival times. For response rates and adverse events (AEs), we recorded the number of people who had experienced an event of interest and the total number of people evaluated for that event to determine the risk ratio (RR). We extracted details on QoL in a descriptive fashion as published.
Evaluación del riesgo de sesgo de los estudios incluidos
Two review authors used the Cochrane 'Risk of bias' tool to independently assess risk of bias in the studies, with a a third independent review author settling disputes (Higgins 2011).
We summarised the results in a 'Risk of bias summary' graph. We interpreted the results of meta‐analyses in light of the findings of the risk of bias assessments.
Medidas del efecto del tratamiento
For survival data, we used the HR with 95% confidence intervals (CI) and median survival times. For dichotomous data (response rates and grade 3/4 AEs), we used the risk ratio (RR) with a 95% CI. We report quality of life in a descriptive, tabulated fashion.
Cuestiones relativas a la unidad de análisis
For studies that compared more than one treatment arm with a control arm in the same meta‐analysis, we divided the number of participants in the control group by the number of treatment arms. There were no other unit of analysis issues.
Manejo de los datos faltantes
When we could not extract data from the text, or when statistics were missing, we attempted to contact the authors of the original article to obtain the necessary information.
Evaluación de la heterogeneidad
We assessed heterogeneity by visual inspection of the forest plots and statistically with the Chi² test for homogeneity and the I² statistic for inconsistency.
Evaluación de los sesgos de notificación
Had we included comparisons with more than 10 included studies, we would have constructed funnel plots to assess reporting bias.
Síntesis de los datos
We used the generic inverse variance method for all meta‐analyses according to the guidance in the Cochrane Handbook for Systematic Reviews of Interventions (Higgins 2011). Due to the heterogeneity of the interventions and comparators, we used a random‐effects model in all instances. We performed all analyses using Review Manager 5 (RevMan 5) software (RevMan 2014), following an intention‐to‐treat principle when data permitted.
Análisis de subgrupos e investigación de la heterogeneidad
We did not perform any subgroup analyses.
Análisis de sensibilidad
We planned to perform sensitivity analyses by excluding studies at high risk of bias from the meta‐analysis, but due to the small number of studies in the various comparisons, we were unable to do so.
Summary of findings table
We created four summary of findings tables describing the primary outcome measure of OS for participants. We included a narrative summary of the toxicity and QoL data in the comments section of the table. We calculated the median 12‐month survival rate for the control arm to calculate the assumed risk for each comparison. We used the percentage of people alive at 12 months if it was available, otherwise we extracted the data from the Kaplan‐Meier curves. We then applied the summary HR to this rate to give an anticipated effect on the rate of death with the intervention versus the comparator, expressed as number of events per 1000 people. We used the 6‐month survival rate if all control arm participants had died by 12 months.
We used the GRADE approach to assess the quality of the body of evidence for the outcome OS as described by the GRADE Working Group and in the GRADE Handbook (Guyatt 2011; Schünemann 2013).
Results
Description of studies
Results of the search
Figure 1 presents the study flow chart. We identified 1304 studies through electronic searches and an additional 80 studies through handsearching. After removing duplicates and studies that were clearly not eligible for inclusion, we assessed 215 full‐text articles. Of these, we excluded 155, including 49 that did not meet the inclusion criteria for the review, and 106 that will be reported in a separate Cochrane Review.
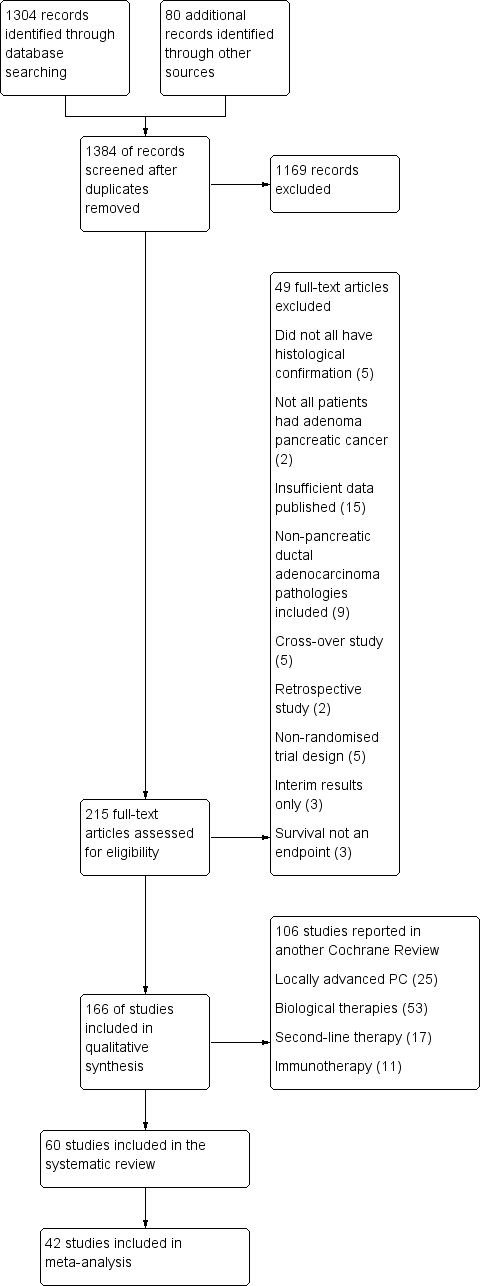
1 Study flow diagram.
Included studies
The original published protocol had wide inclusion criteria. Due to the large number of studies identified, we decided to split the review. Therefore, we will report studies addressing biological agents, immunotherapy, second‐line therapies and local therapies for locally advanced disease separately. This report focuses on studies of either chemotherapy or radiotherapy in the advanced setting only.
We included sixty studies assessing the effects on chemotherapy in advanced PC (Characteristics of included studies). We did not identify any studies that addressed radiotherapy in the advanced setting. Of the included studies, we were able to include 42 with data on 9463 participants in a meta‐analysis.
We categorised these studies into five main categories.
-
Any anti‐cancer treatment versus best supportive care (6 studies: Andren‐Sandberg 1983; Frey 1981; Glimelius 1996; Huguier 2001,Takada 1998; Xinopoulos 2008).
-
Various types of chemotherapy versus gemcitabine (8 studies: Burris 1997; Cheverton 2004; Conroy 2011; Poplin 2009; Poplin 2013; Singhal 2014; Smith 2003; Tempero 2003).
-
Gemcitabine combination versus gemcitabine alone (7 studies addressing platinum plus gemcitabine: Colucci 2002; Colucci 2010; Heinemann 2006; Li 2004; Louvet 2005; Viret 2004; Wang 2002; 10 studies addressing fluoropyrimidine plus gemcitabine: Berlin 2002; Cunningham 2009; Di Costanzo 2005; Herrmann 2007; Lee 2017; Ohkawa 2004; Ozaka 2012; Riess 2005; Scheithauer 2003; Ueno 2013; 3 studies addressing topoisomerase inhibitors plus gemcitabine: Abou‐Alfa 2006; Rocha Lima 2004; Stathopoulos 2006; 1 study addressing taxane plus gemcitabine: Von Hoff 2013; 2 studies addressing multi‐drug combinations including gemcitabine: Petrioli 2015; Reni 2005; and 4 studies of other agents combined with gemcitabine: Gansauge 2002; Meng 2012; Oettle 2005; Ueno 2013 – EPA study).
-
Fluoropyrimidine‐based studies (4 studies: Ducreux 2004; Kovach 1974; Maisey 2002; Moertel 1979).
-
Single studies addressing unique treatment comparisons (13 studies: Afchain 2009; Boeck 2008; Bukowski 1983; Corrie 2017; Hirao 2011; Kelsen 1991; Kulke 2009; Levi 2004; Lohr 2012; Lutz 2005; Moertel 1977; Reni 2012; Topham 1991).
1 Anti‐cancer therapy versus best supportive care
Six studies compared a type of anticancer therapy with best supportive care (BSC). Andren‐Sandberg 1983 (N = 47) compared 5FU/CCNU plus vincristine (n = 25) versus BSC (n = 22). Frey 1981 included 152 participants with unresectable PC and assessed 5‐fluorouracil (5FU) plus chloroethylcyclohexylnitrosurea (CCNU). Glimelius 1996 studied people with advanced PC or biliary tract cancer; of the 53 participants with PC, 29 were given 5FU/LV, with or without etoposide, and 24 received BSC. Huguier 2001 included 45 participants with unresectable PC; the treatment arm was cisplatin plus 5FU plus leucovorin (LV). Takada 1998 included 83 people with unresectable PC; the treatment arm was 5FU plus doxorubicin plus mitomycin C (MMC). Xinopoulos 2008 included 49 people with locally advanced PC; the treatment arm was gemcitabine.
2 Various types of chemotherapy versus gemcitabine
Eight studies compared various types of chemotherapy versus gemcitabine.
2.1 5FU versus gemcitabine
There was one study in this group involving 126 people with symptomatic advanced PC; 63 were given 5FU and 63 gemcitabine chemotherapy (Burris 1997).
2.2 FOLFIRINOX versus gemcitabine
Conroy 2011 tested FOLFIRINOX in 342 people, and Singhal 2014 in 310 people, with metastatic PC.
2.3 CO‐101 versus gemcitabine
One study in 367 participants with metastatic PC compared CO‐101 (lipid conjugate form of gemcitabine) versus gemcitabine (Poplin 2013).
2.4 ZD9331 versus gemcitabine
One study addressed this comparison (Smith 2003), including 55 participants with locally advanced (LA) or metastatic PC. The treatment arm was ZD9331 (thymidylate synthase inhibitor).
2.5 Fixed‐dose rate gemcitabine versus standard infusional gemcitabine
Two studies were available for analysis: Poplin 2009 and Tempero 2003. Both had slightly different schedules: Poplin 2009 involved 824 participants with LA or metastatic PC and compared gemcitabine at 1000 mg/m² given over 30 min weekly for 7 out of 8 weeks then 3 out of 4 weeks versus gemcitabine given at 1500 mg/m² over 150 min 3 out of 4 weeks. Tempero 2003 involved 92 people with LA or metastatic PC and compared a dose‐dense regimen of gemcitabine 2200 mg/m² weekly, 3 out of 4 weeks versus gemcitabine 1500 mg/m² given at 10 mg/m²/min, weekly, 3 out of 4 weeks.
2.6 Exatecan (DX‐8951f) versus gemcitabine
One study addressed this comparison (Cheverton 2004), including 339 chemotherapy‐naive participants with LA or metastatic PC. The treatment arm was exatecan (a hexacyclic, water‐soluble, topoisomerase‐1 inhibitor).
3 Gemcitabine combination studies
3.1 Gemcitabine plus a platinum agent versus gemcitabine alone
Seven studies compared gemcitabine plus a platinum agent versus gemcitabine alone (Colucci 2002; Colucci 2010; Heinemann 2006; Li 2004; Louvet 2005; Viret 2004; Wang 2002). Louvet 2005 used oxaliplatin, while the rest used cisplatin. All studies had gemcitabine alone as the control arm and gemcitabine plus a platinum agent in the treatment arm. Colucci 2002 (N = 107), Colucci 2010 (N = 400), Heinemann 2006 (N = 195). Li 2004 (N = 46) and Louvet 2005 (N = 326) all included people with LA or metastatic PC, while Viret 2004 (N = 83) and Wang 2002 (N = 42) included participants with stage III/IV PC.
3.2 Gemcitabine plus fluoropyrimidine versus gemcitabine alone
Ten studies compared gemcitabine plus fluoropyrimidine versus gemcitabine alone (Berlin 2002; Cunningham 2009; Di Costanzo 2005; Herrmann 2007; Lee 2017; Ohkawa 2004; Ozaka 2012; Riess 2005; Scheithauer 2003; Ueno 2013).
-
Two studies assessed infusional 5FU in 567 participants with with LA/metastatic PC (Di Costanzo 2005; Riess 2005), and one study tested bolus 5FU in 322 participants with unresectable PC (Berlin 2002).
-
Four studies used capecitabine in: 533 people with LA/metastatic PC (Cunningham 2009), 319 people with inoperable/metastatic PC (Herrmann 2007), 214 people with LA/metastatic PC (Lee 2017), and 83 people with metastatic PC (Scheithauer 2003).
-
Two studies used oral tegafur (S1) in LA/metastatic PC: Ozaka 2012 included 112 participants and Ueno 2013 832. Ueno 2013 was a multi‐armed study that compared gemcitabine versus S1 versus gemcitabine plus S1.
-
One study assessed tegafur‐uracil (UFT) in 19 participants (Ohkawa 2004).
3.3 Gemcitabine plus toposiomerase inhibitor versus gemcitabine alone
Three studies compared gemcitabine plus a toposiomerase inhibitor versus gemcitabine alone in participants with LA or metastatic PC (Abou‐Alfa 2006; Rocha Lima 2004; Stathopoulos 2006). Rocha Lima 2004 (N = 360) and Stathopoulos 2006 (N = 130) tested irinotecan, and Abou‐Alfa 2006 (N = 349) used exatecan.
3.4 Gemcitabine plus taxane versus gemcitabine alone
Only one study, in 861 participants with metastatic PC, was suitable for analysis (Von Hoff 2013).
3.5 Gemcitabine plus other combinations of chemotherapy versus gemcitabine alone
Two studies assessed gemcitabine plus other combinations of chemotherapy: Petrioli 2015 included 67 people with metastatic PC and combined oxaliplatin plus capecitabine plus gemcitabine (GEMOXEL). Reni 2005 assessed 99 people with LA/metastatic PC and used a combination cisplatin‐epirubicin‐5FU‐gemcitabine.
3.6 Gemcitabine in combination with other agents versus gemcitabine alone
Four studies examined different agents in combination with gemcitabine: Gansauge 2002 looked at 90 participants with unresectable PC and used Ukrain (herbal medicine), Meng 2012 assessed 76 people with unresectable PC and used huachansu (Chinese herbal medicine), Oettle 2005 included 565 people with LA/metastatic PC and used pemetrexed, and Ueno 2013 – EPA study included 66 people with advanced PC and used eicosapentaenoic acid supplement (EPA).
4 Fluoropyrimidine combinations versus fluoropyrimidine alone
Four studies compared fluoropyrimidine combinations versus fluoropyrimidine alone (Ducreux 2004; Kovach 1974; Maisey 2002; Moertel 1979). Ducreux 2004 was a three‐armed study in 63 participants with LA or metastatic PC, and Kovach 1974 included 82 participants with unresectable PC and compared 5FU versus bis‐chloroethylnitrosurea (BCNU) alone versus 5FU plus BCNU. Maisey 2002 analysed 209 participants with LA or metastatic PC and compared 5FU versus 5FU plus mitomycin C (MMC). Moertel 1979 involved 176 people with metastatic PC and used streptozocin in the treatment arm. We were unable to include Cullinan 1985 and Cullinan 1990 in the meta‐analysis, as they were multi‐armed studies in which the control arm could not be split.
5 Single studies addressing unique treatment comparisons
Many studies addressed unique comparisons, so we could not group them with other studies.
-
Boeck 2008 studied capecitabine plus oxaliplatin (n = 61) versus capecitabine plus gemcitabine (n = 64) versus modified gemcitabine plus oxaliplatin (n = 63).
-
Kulke 2009 was a multi‐armed study comparing fixed dose rate gemcitabine (n = 64) versus infusional gemcitabine plus cisplatin (n = 66) versus infusional gemcitabine plus docetaxel (n = 65) versus infusional gemcitabine plus irinotecan (n = 60).
-
Afchain 2009 compared standard gemcitabine plus oxaliplatin (n = 20) versus a simplified gemcitabine plus oxaliplatin protocol (n = 37).
-
Bukowski 1983 compared mitomycin C plus 5FU (MF) (n = 73) versus streptozocin plus MMC plus 5FU (SMF) (n = 72).
-
Hirao 2011 looked at gemcitabine given on a three‐week schedule (n = 45) versus gemcitabine given on a four‐week schedule (n = 45).
-
Kelsen 1991 compared streptozocin plus MMC plus 5FU (SMF) (n = 42) versus cisplatin plus ara‐C plus caffeine (CAC) (n = 40).
-
Levi 2004 studied 5FU given either as a constant or chronomodulated infusion, with (n = 52) versus without (n = 55) cisplatin.
-
Lutz 2005 compared gemcitabine plus docetaxel (n = 49) versus cisplatin plus docetaxel (n = 47).
-
Moertel 1977 looked at streptozocin plus 5FU (n = 40) versus streptozocin plus cyclophosphamide (n = 48).
-
Reni 2012 compared capecitabine plus cisplatin plus gemcitabine plus docetaxel (PDXG) (n = 53) versus capecitabine plus cisplatin plus gemcitabine plus epirubicin (PEXG) (n = 48).
-
Finally, Topham 1991 looked at epirubicin (n = 32) versus 5FU plus epirubicin plus MMC (n = 30).
Excluded studies
We excluded 155 studies. Other Cochrane Reviews will cover the 53 studies addressing biological agents, the 11 assessing immunotherapies, the 25 looking at local therapies in locally advanced disease and the 17 focusing on second‐line therapies. We excluded the remaining 49 studies for the following reasons.
-
Five studies did not mandate histological confirmation in the study protocol (Abdel Wahab 1999; Johnson 2001; Mallinson 1980; Nakai 2012; Palmer 1994).
-
Two studies included some participants who did not have advanced stage PC (Andersen 1981; Lygidakis 1995).
-
Fifteen studies did not provide sufficient data (Baker 1976; Cohen 2010; GITSG 1985; Kim 2011; Oberic 2011; Queisser 1979; Ramanathan 2011; Sakata 1992; Senzer 2006; Shapiro 2005; Sultana 2009; Sun 2011; Tagliaferri 2013; Trouilloud 2012; Van Cutsem 2013).
-
Nine studies included people with non‐PDAC histologies (Ducreux 2002; GITSG 1988; Lokich 1979; Mizuno 2013; Moertel 1981; Oster 1986; Schein 1978; Sudo 2014; Takada 1994).
-
Five were cross‐over studies (Berglund 2010; Dahan 2010; Heinemann 2013 (GUT); Horton 1981; Javle 2011).
-
Five had a non‐randomised study design (Bukowski 1993; Gong 2007; Mitry 2006; Yongxiang 2001; Zemskov 2000).
-
Three studies published only interim results (GITSG 1979; Topham 1993; Tuinmann 2008).
-
Survival was not an endpoint in three studies (Ardalan 1988; Meyer 2008; Schmitz‐Winnenthal 2013).
Risk of bias in included studies
Figure 2 and Figure 3 summarise the risk of bias of all included studies. Many studies did not publish sufficient details to make a judgement on selection bias. Of those that did, all were judged to be at a low risk of bias because they used centralised randomisation techniques. Only one study was double‐blind and placebo controlled (Meng 2012), and we judged it to be at low risk for performance bias. We assessed the remainder of the studies to be at a high risk of bias. We considered studies that used OS as the primary endpoint to be at a low risk for detection bias (Abou‐Alfa 2006; Berlin 2002; Cheverton 2004; Colucci 2010; Conroy 2011; Cullinan 1985; Cullinan 1990; Cunningham 2009; Frey 1981; Gansauge 2002; Glimelius 1996; Heinemann 2006; Herrmann 2007; Huguier 2001; Kulke 2009; Lee 2017; Levi 2004; Li 2004; Lohr 2012; Louvet 2005; Oettle 2005; Poplin 2009; Poplin 2013; Riess 2005; Rocha Lima 2004; Singhal 2014; Smith 2003; Stathopoulos 2006; Takada 1998; Tempero 2003; Ueno 2013; Von Hoff 2013; Xinopoulos 2008). If tumour assessments were needed to assess the primary outcome (e.g. RR or PFS), we assigned a low risk of bias only if an independent reviewer or by a blinded radiologist conducted the assessments (Ducreux 2004; Reni 2005; Reni 2012; Scheithauer 2003). We judged all other studies to be at a high risk of bias. We deemed studies that reported the intention‐to‐treat population (all participants randomised on the study regardless if they received any treatment or not) to be at a low risk of attrition bias, while we considered studies that did not report all randomised patients to be at a high risk of bias (Bukowski 1983; Cullinan 1985; Ducreux 2004; Kelsen 1991; Louvet 2005; Moertel 1977; Ozaka 2012). We detected selective reporting bias in only two studies (Bukowski 1983; Moertel 1979), the former because only the participants with measurable disease were reported in detail and the latter because the toxicity data were not comprehensively reported.

Risk of bias graph: review authors' judgements about each risk of bias item presented as percentages across all included studies.
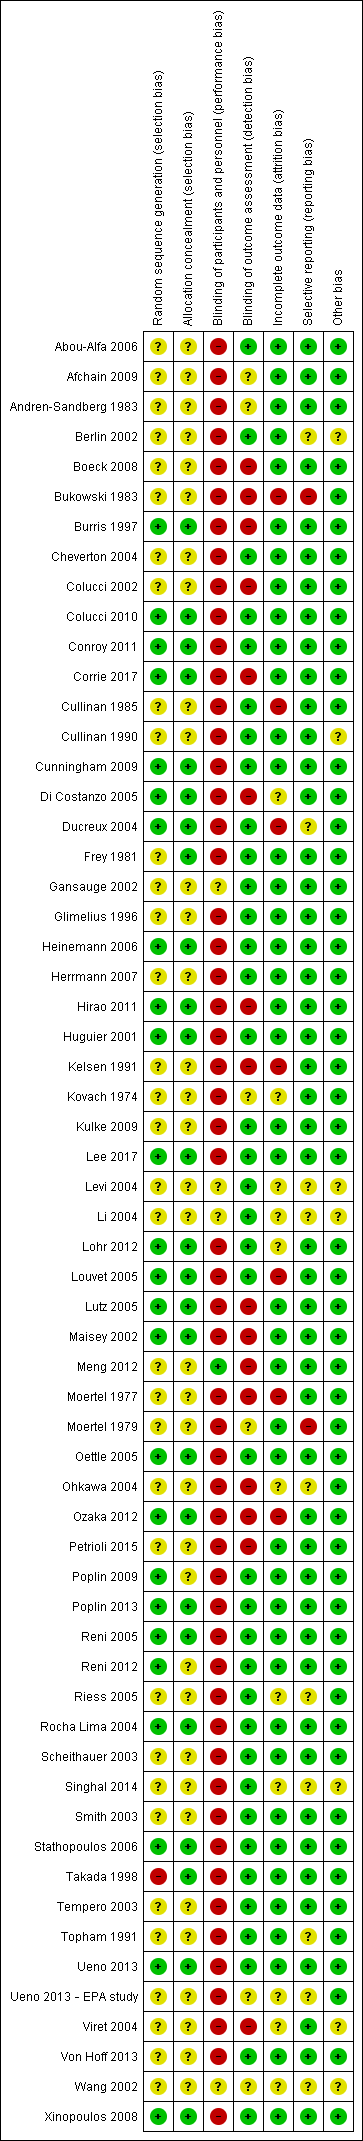
Risk of bias summary: review authors' judgements about each risk of bias item for each included study.
We describe details of the risk of bias of the included studies in the Effects of interventions section.
Effects of interventions
See: Summary of findings for the main comparison Anti‐cancer therapy versus best supportive care for advanced pancreatic cancer; Summary of findings 2 Various types of chemotherapy versus gemcitabine for advanced pancreatic cancer; Summary of findings 3 Gemcitabine combinations versus gemcitabine alone for advanced pancreatic cancer; Summary of findings 4 Fluoropyrimidine combinations versus fluoropyrimidine alone for advanced pancreatic cancer
1 Anti‐cancer therapy versus best supportive care (BSC)
Six studies addressed any anti‐cancer therapy versus best supportive care (Andren‐Sandberg 1983; Frey 1981; Glimelius 1996; Huguier 2001,Takada 1998; Xinopoulos 2008). The main potential source of bias in these studies came from their non‐blinded design; however, we did not feel this significantly affected the results for overall survival (Figure 2; Figure 3). In three studies the risk of selection bias was unclear due to insufficient reporting (Andren‐Sandberg 1983; Glimelius 1996; Xinopoulos 2008).
Four of the six studies provided data in sufficient detail to derive hazard ratios (HR) for OS, with 298 people analysed. Pooled data of four studies in 298 people showed an HR of 1.08 (95% CI 0.88 to 1.33; Analysis 1.1). There was no statistical heterogeneity between studies (I² = 0%). Median survival ranged from 3.0 to 8.6 months in the anti‐cancer therapy group and 2.5 to 7.0 months in the BSC group. The difference in median survival times ranged from 0.9 months in favour of BSC to 3.5 months in favour of anticancer therapy (Table 1).
| Study | Anti‐cancer therapy details | Median survival:anti‐cancer therapy vs best supportive care (months) | Quality of life |
| 5FU + CCNU | 5 vs 4 | No difference in Karnofsky performance status (KPS) score | |
| 5FU + CCNU | 3.0 vs 3.9 | Not addressed | |
| 5FU + LV | 6.0 vs 2.5 | EORTC QLQ‐C30 results favoured the anti‐cancer therapy (NB: high rate of dropouts in the later time points) | |
| 5FU + LV + cisplatin | 8.6 vs 7.0 | Not addressed | |
| 5FU + doxorubicin + MMC | 4.9 vs 5.0 | Not addressed | |
| Gemcitabine | 5.25 vs 5.5 | Superior QoL (EORTC QLQ‐C30) in the gemcitabine group during the 1st month (P = 0.028), no difference from the 2nd to the 4th month; in the 5th and 6th month superior QoL in the BSC group (P = 0.010 and < 0.001) |
5FU: 5‐Fluorouracil; CCNU: chloroethylcyclohexylnitrosurea; EORTC QLQ‐C30: European Organisation for Research and Treatment of Cancer quality of life questionnaire for cancer patients; LV: leucovorin; MMC: 5FU+doxorubicin + mitomycin C
Three studies reported quality of life (Table 1). Andren‐Sandberg 1983 did not find a difference in Karnofsky performance status (KPS) score. In Glimelius 1996, the EORTC QLQ‐C30 results favoured the treatment group; however, there was a high rate of dropouts in the later time points. The third study (Xinopoulos 2008) demonstrated a superior QoL (EORTC QLQ‐C30) in the gemcitabine group during the first month (P = 0.028), but there was no difference in months two to four, and the BSC group had a superior QoL in months five (P = 0.010) and six (P = 0.0003).
Trials either did not study or did not adequately report PFS and response rates, with the exception of Takada 1998. This study reported complete or partial response in one person in the anti‐cancer therapy group versus none in the BSC group.
With respect to adverse effects or toxicity in the anti‐cancer therapy group, Frey 1981 reported that 31% of participants experienced at least one toxicity, with the most common being gastrointestinal. Huguier 2001 reported that the most common toxicities were haematological and gastrointestinal (each seen in 15% of people). Takada 1998 showed that the commonest grade 3/4 adverse events (AEs) were anorexia, which occurred in in 15/28 participants and nausea/vomiting, in 5/24 participants. Haematological toxicities were the most common in Xinopoulos 2008, with leucopenia occurring in 81.5% of participants.
2 Various types of chemotherapy versus gemcitabine
Eight studies compared various types of chemotherapy versus gemcitabine (Burris 1997; Cheverton 2004; Conroy 2011; Poplin 2009; Poplin 2013; Singhal 2014; Smith 2003; Tempero 2003), analysing a total of 1844 participants in six treatment subgroups. Due to the heterogeneity of the investigational agents, we did not pool the results. Five studies provided PFS data (Burris 1997; Conroy 2011; Poplin 2009; Singhal 2014; Smith 2003). The main potential source of bias in these studies came from the non‐blinded study design. We were unable to comprehensively assess selection bias in some studies (Cheverton 2004; Singhal 2014; Smith 2003; Tempero 2003), and there was a high risk of detection bias noted in Burris 1997,Poplin 2013 and Smith 2003; however, we did not consider that it significantly affected results for overall survival.
2.1 5FU versus gemcitabine
Burris 1997 (N = 126) was the only study to compare 5FU with gemcitabine, showing an HR for OS of 1.69 (95% CI 1.26 to 2.27, P < 0.001; Analysis 2.1). The difference in median survival was 1.3 months in favour of gemcitabine (Table 2). The analysis of PFS showed an HR of 1.47 (95% CI 1.12 to 1.92, P = 0.005; Analysis 2.2). There were better outcomes for both OS and PFS with gemcitabine, and this group also showed more treatment response (0 in the 5FU arm versus 3 in the gemcitabine arm; risk ratio (RR) 0.14, 95% CI 0.01 to 2.71, P = 0.19). On the other hand, the gemcitabine arm showed a higher risk of most types of grade 3/4 toxicity: anaemia (0 in the 5FU arm versus 6 events in the gemcitabine arm: RR 0.08, 95% CI 0.0 to 1.34, P = 0.08; Analysis 2.5); neutropenia (3 events versus 16 events: RR 0.19, 95% CI 0.06 to 0.61, P = 0.006; Analysis 2.6); thrombocytopenia (1 event versus 6 events: RR 0.17, 95% CI 0.02 to 1.34, P = 0.09; Analysis 2.7); and nausea (3 events versus 8 events: RR 0.38, 95% CI 0.10 to 1.35, P = 0.13; Analysis 2.8). Diarrhoea was the exception (3 events in the 5FU arm versus 1 event in the gemcitabine arm: RR 3.00, 95% CI 0.32 to 28.07, P = 0.34; Analysis 2.9). Clinical benefit was superior in the gemcitabine arm compared with the 5FU arm, with a higher clinical benefit response (23.8% versus 4.8%), shorter median time to clinical benefit response (3 weeks versus 7 weeks) and longer duration of clinical benefit response (18 weeks versus 13 weeks) (Table 2).
| Study | Type of other chemotherapy | Median survival:other chemotherapy vs gemcitabine (months) | Quality of life |
| 5FU | 4.4 vs 5.7 | Improved clinical benefit 4.8% vs 23.8%. Median time to benefit 7 vs 3 weeks. Duration of benefit 18 vs 13 weeks | |
| FOLFIRINOX | 11.1 vs 6.8 | QLQ‐C30: decrease in Global Health Status and QoL scale at 3 months 17% vs 31%; at 6 months 31% vs 66% Median time to definitive deterioration: not reached vs 5.7 months | |
| FOLFIRINOX | 10.8 vs 7.4 | Definitive degradation of QoL at six months: 29% vs 59% | |
| CO‐101 | 5.2 vs 6.0 | Not addressed | |
| ZD‐9331 | 5.0 vs 3.6 | Not addressed | |
| Fixed dose rate gemcitabine 1500 mg/m² over 150 min | 6.2 vs 4.9 | Not addressed | |
| Fixed dose rate gemcitabine 1500 mg/m² at 10 mg/m²/min | 8.0 vs 5.0 | Not addressed | |
| Exatecan (DX‐8951f) | 5.0 vs 6.6 | Time to worsening of clinical benefit was longer in the gemcitabine group. Pain (3.7 vs 7.9 months; P = 0.0493), KPS (3.4 vs 4.6 months; P = 0.0111) and weight (2.3 vs 3.8 months; P = 0.0203). QoL measured with QLQ‐C3 and QLQ‐PAN26 were similar in the 2 groups |
5FU: 5‐Fluorouracil; FOLFIRINOX: 5‐fluorouracil + irinotecan + oxaliplatin; QoL: quality of life; QLQ‐C30 and QLQ‐PAN26: general and pancreatic cancer specific QoL questionnaire.
2.2 FOLFIRINOX versus gemcitabine
Two studies in 652 people assessed the effects of FOLFIRINOX versus gemcitabine (Conroy 2011; Singhal 2014). The FOLFIRINOX group generally outperformed gemcitabine, showing improved OS (HR 0.51, 95% CI 0.43 to 0.60, P < 0.001; I² = 29%; Analysis 2.1), longer median survival (4.3 months versus 3.4 months; Table 2), longer PFS (HR 0.46, 95% CI 0.38 to 0.57, N = 652, P < 0.001; I² = 0%; Analysis 2.2), longer time to degradation of QoL (HR 0.46, 95% CI 0.35 to 0.61, P < 0.001; I² = 0%; Analysis 2.3; Table 2), and more treatment responses (54 responses versus 16 responses: RR 3.38, 95% CI 2.01 to 5.65, P < 0.001; Analysis 2.4). On the other hand, FOLFIRINOX also showed more grade 3/4 haematological toxicity for: anaemia (13 events versus 10 events: RR 1.30, 95% CI 0.59 to 2.88, P = 0.52; Analysis 2.5), neutropenia (75 events versus 35 events: RR 2.14, 95% CI 1.52 to 3.01, P < 0.001: Analysis 2.6), and thrombocytopenia (15 events versus 6 events: RR 2.50, 95% CI 0.99 to 6.29, P = 0.05; Analysis 2.7).
2.3 CO‐101 versus gemcitabine
Poplin 2013 tested CO‐101 in 367 people. Outcomes were not different for participants in either arm. The HR for OS was 1.07 (95% CI 0.86 to 1.34, P = 0.68; Analysis 2.1). Median survival was similar in both groups, 5.2 months for CO‐101 and 6.0 months for gemcitabine (Table 2). The trial did not report PFS. The RR for response was 0.67 (95% CI 0.43 to 1.04, P = 0.08; Analysis 2.4). We could neither prove nor rule out differences in various types of grade 3/4 toxicity (Analysis 2.5; Analysis 2.6; Analysis 2.7).
2.4 ZD9331 versus gemcitabine
Smith 2003 compared ZD9331 versus gemcitabine in 55 people. There was no difference in survival for participants in either arm. The HR for OS was 0.86 (95% CI 0.42 to 1.76, P = 0.68; Analysis 2.1) and for PFS, it was 0.78 (95% CI 0.46 to 1.32, P = 0.36; Analysis 2.2). Median survival was 5.0 months and 3.6 months, respectively (Table 2). The RR for response was 0.42 (95% CI 0.04 to 4.33, P = 0.46, Analysis 2.4). We could neither prove nor rule out differences in various types of grade 3/4 toxicity (Analysis 2.5; Analysis 2.6; Analysis 2.7; Analysis 2.8; Analysis 2.9).
2.5 Fixed dose rate gemcitabine (FDR‐gem) versus standard infusional gemcitabine
Two studies assessed the effects of FDR‐gem in 644 people (Poplin 2009; Tempero 2003). OS was improved in the FDR‐gem group (HR 0.79, 95% CI 0.66 to 0.94, P = 0.009, I² = 0%; Analysis 2.1). In the two studies, median survival was 1.3 months and 3.0 months longer in the FDR‐gem group (Table 2). Only Poplin 2009 (N = 552) reported PFS, finding no significant difference between groups (HR 0.88, 95% CI 0.77 to 1.01, P = 0.06, Analysis 2.2). There were more responses seen in the FDR‐gem group (30 responses versus 19 responses), but this was not significant (RR 1.59, 95% CI 0.91 to 2.79, P = 0.10; Analysis 2.4). Analyses also showed more grade 3/4 toxicity in the FDR‐gem group: anaemia (62 events versus 35 events: RR 1.79, 95% CI 1.22 to 2.63, P = 0.003; Analysis 2.5), neutropenia (183 events versus 100 events: RR 1.85, 95% CI 1.53 to 2.23, P < 0.001; Analysis 2.6), thrombocytopenia (107 events versus 39 events: RR 2.77, 95% CI 1.99 to 3.86, P < 0.001; Analysis 2.7), and nausea (37 events versus 25 events: RR 1.52, 95% CI 0.94 to 2.46, P = 0.09; Analysis 2.8). Diarrhoea was the exception (5 events versus 12 events: RR 0.44, 95% CI 0.16 to 1.23, P = 0.12; Analysis 2.9).
2.6 Exatecan (DX‐8951f) versus gemcitabine
Cheverton 2004 demonstrated that exatecan had an inferior effect on OS compared with gemcitabine (HR 1.27, 95% CI 0.96 to 1.68, P = 0.093). Median survival in the two respective groups was 5 months versus 6.6 months; 6‐month survival rates were 44.1% versus 51.1%; and 12‐month survival rates, 17.9% versus 22.1%. There were insufficient data to include this study in the PFS analysis; however, median PFS was 2.8 months versus 4.4 months. Response rates were available in 276 people (1 response versus 10 responses: RR 0.10, 95% CI 0.01 to 0.78, P = 0.03; Analysis 2.4). Toxicity data were available in 330 people and showed that both agents performed similarly for grade 3/4 anaemia (10 events versus 10 events: RR 1.00, 95% CI 0.43 to 2.34, P = 1.00; Analysis 2.5), neutropenia (32 events versus 32 events: RR 1.00, 95% CI 0.64 to 1.55, P = 1.00; Analysis 2.6), thrombocytopenia (12 events versus 16 events: RR 0.75, 95% CI 0.37 to 1.54, P = 0.43; Analysis 2.7) and nausea (7 events versus 4 events: RR 1.75, 95% CI 0.52 to 5.86, P = 0.36; Analysis 2.8). QoL analysis showed that time to worsening of clinical benefit was longer in the gemcitabine arm, with 3.7 months to worsening of pain in the exatecan group versus 7.9 months in the gemcitabine group (P = 0.049). The gemcitabine group also showed a longer time to worsening KPS (3.4 months versus 4.6 months; P = 0.011) and to weight loss (2.3 months versus 3.8 months; P = 0.020). Global and pancreas‐specific QoL questionnaires failed to elicit significant differences between the two groups. (Table 2).
3 Gemcitabine combination studies
We identified six subgroups in this comparison, and we pooled results in the subgroups only and not overall.
3.1 Gemcitabine plus a platinum agent versus gemcitabine alone
The HR for OS based on six studies in 1140 participants showed no difference between the treatment groups, 0.94 (95% CI 0.81 to 1.08, P = 0.38; Analysis 3.1). There was some statistical heterogeneity (I² = 15%). Four studies in 1015 participants reported PFS and showed some improvement in the gemcitabine + platinum group, giving an HR of 0.80 (95% CI 0.68 to 0.95, P = 0.01; Analysis 3.2). There was high statistical heterogeneity (I² = 46%). The median survival times are listed in Table 3.
| Study | Gemcitabine combination details | Median survival:gemcitabine combination vs gemcitabine alone (months) | Quality of life |
| Platinum combinations | |||
| Gemcitabine + cisplatin | 7.5 vs 5.0 | Not addressed | |
| Gemcitabine + cisplatin | 7.2 vs 8.3 | The mean difference from baseline in global QoL (EORTC C30) was not significantly different between the 2 groups: 0.09 (gemcitabine/cisplatin) vs 6.20 (gemcitabine), P = 0.07 | |
| Gemcitabine + cisplatin | 7.5 vs 6.0 | No difference was detected in the 2 groups with either the Spitzer index or the pain intensity score | |
| Gemcitabine + cisplatin | 5.6 vs 4.6 | Clinical benefit (pain control, performance status, body weight gain) 29% vs 36% (P > 0.05); Quality adjusted life months 3.8 vs 5.6 (P < 0.001) | |
| Gemcitabine + oxaliplatin | 9.0 vs 7.1 | Not addressed | |
| Gemcitabine + cisplatin | 8.0 vs 6.7 | Q‐TWiST results did not differ significantly between the 2 arms (EORTC C30) | |
| Gemcitabine + cisplatin | 7.2 vs 9.1 | Not addressed | |
| Fluoropyrimidine combinations | |||
| Gemcitabine + 5FU (weekly) | 6.7 vs 5.4 | Not addressed | |
| Gemcitabine + capecitabine | 7.1 vs 6.2 | 89% of people completed QoL questionnaires (EORTC QLQ‐C30 + ESPAC). No differences seen at baseline between the 2 groups and no differences across treatment groups at 3 or 6 months | |
| Gemcitabine + daily 5FU | 7.5 vs 7.75 | No differences were seen between the 2 groups in mean disturbed days after cycle 1 or 2 or mean of days a person would like to cancel treatment in cycle 1 or 2 | |
| Gemcitabine + capecitabine | 8.4 vs 7.2 | CBR seen in 29% of people in combination arm and 20% of people in gemcitabine arm. Median duration of response 9.5 and 6.5 weeks, respectively (P < 0.02). No differences in QoL as measured by LASA | |
| Gemcitabine + capecitabine | 10.3 vs 7.5 | Not addressed | |
| Gemcitabine + UFT | Not stated | Not addressed | |
| Gemcitabine + S1 | 13.7 vs 8.0 | Not addressed | |
| Gemcitabine + 5FU (24 hour infusion) + FA | Not stated | Not addressed | |
| Gemcitabine + capecitabine | 9.5 vs 8.2 | The gemcitabine + capecitabine arm had an improvement in pain (35.5 vs 20%), KPS (41.9 vs 27%), but not weight (9.7 vs 17%) | |
| Gemcitabine + S1 | 10.1 vs 8.8 | The gemcitabine + S1 group showed an improvement in QALYs 0.525 vs 0.401, P < 0.001 | |
| Topoisomerase combinations | |||
| Gemcitabine + exatecan | 6.2 vs 6.7 | Not addressed | |
| Gemcitabine + irinotecan | 6.3 vs 6.5 | FACT‐Hep questionnaires were completed by 80% of people in irinotecan/gemcitabine group and 73% of the gemcitabine group during the first 30 weeks of the study. There were no differences between the 2 groups. | |
| Gemcitabine + irinotecan | 6.4 vs 6.5 | Not addressed | |
| Taxane combinations | |||
| Gemcitabine + nab‐paclitaxel | 8.5 vs 6.7 | Not addressed | |
| Other combination chemotherapy including gemcitabine | |||
| Gemcitabine + oxaliplatin + capecitabine (GEMOXEL) | 11.9 vs 7.1 | The global QoL score was higher in the combination chemotherapy group at 2 months (61 vs 56) and 4 months (72 vs 66) | |
| Cisplatin/epirubicin/gemcitabine/5FU (PEFG) | Not stated | The EORTC‐QLQ Pan 26 questionnaire was done but the sample size was insufficient to obtain adequate statistical power to reliably detect differences between groups for multiple comparisons. People in PEFG group 20% to 44% more likely to have improvement in emotional functioning, overall quality of life, cognitive measures, pain, fatigue, indigestion, dyspnoea, appetite loss and flatulence. However, people in gemcitabine group had better scores for sexual function and body image | |
| Other agents in combination with gemcitabine | |||
| Gemcitabine + Ukrain | 10.4 vs 5.2 | Not addressed | |
| Gemcitabine + huachansu | 5.2 vs 5.3 | No significant differences were seen between the treatment groups with either the FACT‐G or MDASI assessments | |
| Gemcitabine + pemetrexed | 6.2 vs 6.3 | People in the gemcitabine group had better financial difficulties score, better physical functioning score and better cognitive functioning score. People in the gemcitabine/pemetrexed group had better pain scores. Performance status improvements was seen in 11.4% of gemcitabine/pemetrexed group and 9.4% of gemcitabine group. Weight gain was seen in 10.2% of gemcitabine/pemetrexed group and 5.7% of gemcitabine group | |
| Gemcitabine + EPA | 8.2 vs 9.7 | Not addressed | |
5FU: fluorouracil; CBR: clinical benefit response; ESPAC: European Study Group for Pancreatic Cancer; EORTC: European Organisation for Research and Treatment of Cancer; FACT‐G: Functional Assessment of Cancer Therapy; FA: folinic acid; KPS: Karnofsky performance status; LASA: linear‐analog self‐assessment indicators; MDASI: MD Anderson Symptom Inventory; QALY: quality‐adjusted life year; QLQ‐C30: quality of life questionnaire for cancer patients; QoL: quality of life; Q‐TWiST: quality‐adjusted time without symptoms or toxicity.
All studies (N = 1186) reported response rates favouring the combined treatment arm (100 responses versus 67 responses: RR 1.48, 95% CI 1.11 to 1.98, P = 0.007, I² = 0%; Analysis 3.3). Data from all studies (N = 1156) contributed to meta‐analyses for grade 3/4 anaemia (62 events in the gemcitabine plus platinum group versus 45 events in the gemcitabine alone group: RR 1.41, 95% CI 0.87 to 2.31, P = 0.17; Analysis 3.4) and neutropenia (122 events versus 97 events: RR 1.34, 95% CI 0.90 to 1.97, P = 0.14; Analysis 3.5), with similar rates between groups. For other adverse events, data in 1110 participants from six studies showed more grade 3/4 AEs in the combination group: thrombocytopenia (78 events versus 35 events: RR 1.96, 95% CI 1.00 to 3.84, P = 0.05; Analysis 3.6) and nausea (52 events versus 22 events: RR 2.28, 95% CI 1.40 to 3.71, P = 0.001; Analysis 3.7), although for diarrhoea, we could not rule out the possibility that these results were due to chance (23 events versus 14 events: RR 1.48, 95% CI 0.62 to 3.53, P = 0.38; Analysis 3.8).
Four studies reported QoL data. Colucci 2010 measured QoL using the EORTC QLQ C30 questionnaires in multiple areas. Scores were from a scale of 0‐100. The mean difference (MD) between baseline scores and scores after 4 weeks of treatment were measured. The study did not find a significant MD in global QoL scores between those taking gemcitabine alone (MD 6.20) versus gemcitabine plus platinum (MD 0.09), P = 0.07. Heinemann 2006 found no difference between the treatment groups in either the Spitzer index or pain intensity score, nor did Viret 2004 find any difference in the EORTC‐QLQ C30 results between treatment groups. Li 2004 reported finding no difference in clinical benefit but better quality of life outcomes in the gemcitabine alone arm (3.8 months versus 5.6 months in QoL‐adjusted life months gained P < 0.001; Table 3).
In the one study that we could not include in the meta‐analysis (Li 2004), there were no differences between the control and treatment groups for OS (4.6 months versus 5.6 months) or PFS (2.8 months versus 2.8 months; Table 3).
The main source of bias identified in these studies was their non‐blinded study design. There was a high risk of attrition bias in Louvet 2005 and insufficient details in Viret 2004 and Wang 2002 reports to make a comprehensive assessment of risk of bias.
3.2 Gemcitabine plus fluoropyrimidine versus gemcitabine alone
Ten studies reported OS in 2718 participants. A benefit for adding fluoropyrimidine to gemcitabine was detected (HR 0.88, 95% CI 0.81 to 0.95, P = 0.001; Analysis 3.1), with no statistical heterogeneity (I² = 0%). Eight studies reported PFS in 2608 participants and abenefit for the combination arm was also shown (HR 0.79, 95% CI 0.72 to 0.87, P < 0.001). There was moderate statistical heterogeneity with an I² of 34% (Analysis 3.2). The median survival times ranged from 5.4 months to 8.8 months in the gemcitabine alone group and from 6.7 months to 13.7 months in the combination group (Table 3). Ueno 2013 was a multi‐armed study that compared gemcitabine alone versus S1 alone versus gemcitabine plus S1. The analysis in this review includes only the gemcitabine alone and gemcitabine plus S1 arms.
Nine studies reported response rates in 2176 participants. Responses were more common in the combination group (228 responses in the combination group versus 124 responses in the gemcitabine alone group), RR 1.78 (95% CI 1.29 to 2.47, P < 0.001; Analysis 3.3), with high statistical heterogeneity (I² = 52%). Eight studies reported grade 3/4 AEs in 2158 participants in the combination group versus the gemcitabine alone group, with the combination treatment group tending to experience more AEs: anaemia (97 events versus 89 events: RR 1.11, 95% CI 0.84 to 1.45, P = 0.47; Analysis 3.4), neutropenia (353 events versus 234 events: RR 1.53, 95% CI 1.34 to 1.74, P < 0.001; Analysis 3.5), thrombocytopenia (122 events versus 81 events: RR 1.48, 95% CI 1.00 to 2.18, P = 0.05; Analysis 3.6), nausea (61 events versus 47 events: RR 1.27, 95% CI 0.87 to 1.84, P = 0.22; Analysis 3.7), and diarrhoea (55 events versus 23 events: RR 2.16, 95% CI 1.34 to 3.47, P = 0.002; Analysis 3.8).
Five studies recorded QoL data. Cunningham 2009 used the Memorial pain assessment card, EORTC QLQ C30 and ESPAC QoL questionnaires. Di Costanzo 2005 recorded mean disturbed days and the mean days the person would like to cancel treatment. Herrmann 2007 used a linear‐analogue self‐assessment (LASA) indicators for clinical benefit response (CBR). Scheithauer 2003 recorded a combination of pain, KPS and weight, and Ueno 2013 recorded quality adjusted life years (QALYs). Cunningham 2009 did not find any significant differences in QoL between treatment groups. Likewise, Di Costanzo 2005 did not show any differences in QoL outcomes. Herrmann 2007 did not show a difference in either CBR or QoL (measured by LASA); however, in those people who did have a CBR, the duration was longer in the combination arm (9.5 weeks versus 6.5 weeks, P < 0.02). Scheithauer 2003 demonstrated an improvement in pain response and KPS but not weight gain in the combination arm, and Ueno 2013 showed a statistically significant improvement in QALYs in the combination group: 0.401 versus 0.525, P < 0.001 (Table 3).
The main source of bias identified in this comparison was due to the non‐blinded study design. The risk of selection bias was unclear in Berlin 2002; Herrmann 2007; Ohkawa 2004; Riess 2005 and Scheithauer 2003, but we did not consider that this significantly affected the results.
3.3 Gemcitabine plus topoisomerase inhibitor versus gemcitabine alone
Three studies reported OS data in 839 participants, giving an HR of 1.01 (95% CI 0.87 to 1.16, P = 0.92; Analysis 3.1), indicating no difference between groups. There was no heterogeneity (I² = 0%). Two studies reported similar PFS in 709 participants (HR 0.91, 95% CI 0.78 to 1.07, P = 0.26, I² = 0%; Analysis 3.2). The median survival times were very similar between the two groups (Table 3). All studies reported response rates, with data on 729 participants (49 responses in the combined treatment group versus 22 responses in the gemcitabine alone group: RR 1.50, (95% CI 0.92 to 2.46, P = 0.11, I² = 0%; Analysis 3.3). The combination arms were shown to be more toxic with data for grade 3/4 AEs in 797 participants: anaemia (41 events versus 37 events: RR 1.09, 95% CI 0.72 to 1.66, P = 0.68; Analysis 3.4), neutropenia (132 events versus 88 events: RR 1.54, 95% CI 1.04 to 2.30, P = 0.03; Analysis 3.5), thrombocytopenia (63 events versus 31 events: RR 2.28, 95% CI 0.97 to 5.36, P = 0.06; Analysis 3.6), nausea (36 events versus 23 events: RR 1.55, 95% CI 0.94 to 2.55, P = 0.09; Analysis 3.7) and diarrhoea (36 events versus 6 events: RR 3.47, 95% CI 0.74 to 16.33, P = 0.12; Analysis 3.8).
Rocha Lima 2004 was the only study to record QoL data (FACT‐Hep questionnaire) and reported no significant differences between the two groups (Table 3).
The main source of bias identified in this comparison was due to the non‐blinded study design, but we did not consider that this affected the results.
3.4 Gemcitabine plus taxane versus gemcitabine alone
Von Hoff 2013 was the only study in this group, and trialists analysed all 861 participants for OS, PFS and response rate. A benefit in survival outcomes was demonstrated in the combination arm. For OS, the HR was 0.72 (95% CI 0.62 to 0.84; P < 0.001; Analysis 3.1), and for PFS, HR was 0.69 (95% CI 0.58 to 0.82; P < 0.001; Analysis 3.2). The median survival time was 8.5 months in the combination group versus 6.7 months in the gemcitabine control (Table 3). There was a higher response rate in the combination arm (99 responses versus 30 responses: RR 3.29, 95% CI 2.24 to 4.84, P < 0.001; Analysis 3.3). Data on grade 3/4 AEs were available for 793 participants and overall, toxicity was more common in the combination arm: anaemia (53 events versus 48 events: RR 1.06, 95% CI 0.73 to 1.52, P = 0.76; Analysis 3.4), neutropenia (153 events versus 103 events: RR 1.42, 95% CI 1.16 to 1.75, P < 0.001; Analysis 3.5), thrombocytopenia (52 events versus 36 events: RR 1.38, 95% CI 0.93 to 2.07, P = 0.11; Analysis 3.6), neuropathy (70 events versus 3 events: RR 22.35, 95% CI 7.10 to 70.40, P < 0.001; Analysis 3.9) and fatigue (70 events versus 27 events: RR 2.48, 95% CI 1.63 to 3.79, P < 0.001; Analysis 3.10). The studies did not report on QoL.
Corrie 2017 was a unique study that we could not include in this analysis, addressing nab‐paclitaxel plus gemcitabine versus the same agents given in a sequential dosing schedule. Here the standard arm had similar results to the nab‐paclitaxel plus gemcitabine arm of Von Hoff 2013, with a median survival of 7.9 months, median PFS of 4.0 months and response rate of 33%.
Likewise, we could not include Lohr 2012 in the analysis as it was a multi‐armed study. It showed that overall survival for the gemcitabine alone arm was 6.8 months, compared to 8.1 months in combination with liposomal paclitaxel 11 mg/m², 8.7 months in combination with liposomal paclitaxel 22 mg/m² and 9.3 months in combination with liposomal paclitaxel 44 mg/m². When comparing each combination arm with gemcitabine alone the HRs all crossed the line of null effect: for concomitant doses of 11 mg/m²: HR 0.93 (95% CI 0.60 to 1.43); for 22 mg/m²: HR 0.69 (95% CI 0.44 to 1.07); and for 44 mg/m²: HR 0.66 (95% CI 0.43 to 1.03). PFS in the gemcitabine alone group was 2.7 months compared with each of the combination arms: 4.1 months, 4.6 months and 4.4 months (11 mg/m², 22 mg/m² and 44 mg/m², respectively). When comparing each experimental arm with gemcitabine alone for PFS, the HRs were 0.84 (95% CI 0.44 to 1.28), 0.58 (95% CI 0.38 to 0.90) and 0.74 (95% CI 0.49 to 1.13), respectively. The number of responses were similar in all groups (14%, 14%, 14% and 16%, respectively). Neutropenia and fatigue were the commonest AEs and occurred at similar rates across the four groups. The trials did not report QoL. Toxicity was more common in the combination arm with a dose dependent increase in thrombocytopenia, chills and pyrexia.
Although there were insufficient details to make an assessment of selection bias, overall we assessed the study as being at low risk of bias, the main source being due to the non‐blinded study design, which we considered to not affect the results.
3.5 Gemcitabine plus other combinations of chemotherapy versus gemcitabine alone
Two studies reported OS data on 166 participants which showed improved survival in the combination group (HR 0.55, 95% CI 0.39 to 0.79, P = 0.001; Analysis 3.1). There was some statistical heterogeneity (I² = 24%). Both studies reported PFS and again showed a benefit to the combination arm, with an HR of 0.43 (95% CI 0.30 to 0.62, P < 0.001, I² = 17%; Analysis 3.2). Median survival times were only available for Petrioli 2015, who reported that the combined treatment group survived for a median of 11.9 months versus 7.1 months in the gemcitabine alone group (Table 3). Only Petrioli 2015 reported response rates in 67 participants (12 responses versus 6 responses: RR 1.94, 95% CI 0.83 to 4.56, P = 0.13; Analysis 3.3). The same study reported grade 3/4 AEs. Although AEs were more common in the combination arm, the small number of events makes it difficult to assess the real difference between the arms: anaemia (6 events versus 3 events: RR 1.94, 95% CI 0.53 to 7.13, P = 0.32; Analysis 3.4), neutropenia (8 events versus 4 events: RR 1.94, 95% CI 0.65 to 5.83, P = 0.24; Analysis 3.5), thrombocytopenia (10 events versus 5 events: RR 1.94, 95% CI 0.74 to 5.07, P = 0.11; Analysis 3.6) and nausea (5 events versus 0 events: RR 10.69, 95% CI 0.61 to 185.91, P = 0.10; Analysis 3.7).
Both studies reported QoL data. Petrioli 2015 used the EORTC QLQ C30 and McGill Melzack questionnaires, and Reni 2005 used the EORTC‐QLQ Pan 26 questionnaire. Petrioli 2015 showed that global QoL was improved in the combined treatment group at two and four months. Reni 2005 stated that the sample size was insufficient to obtain statistical power to detect differences between the control and treatment groups. However, the treatment group had better average emotional functioning, overall QoL, cognitive measures, pain, fatigue, indigestion, dyspnoea, appetite loss and flatulence, while sexual function and body image were better in the control group (Table 3).
Petrioli 2015 did not publish enough data to make a full assessment of selection bias and had a high risk of performance and detection bias. Reni 2005 was a non‐blinded study but otherwise had a low risk of bias.
3.6 Gemcitabine plus other agent(s) versus gemcitabine alone
Four studies assessed OS in 767 participants, with no differences in survival detected (HR 0.79, 95% CI 0.56 to 1.10, P = 0.16; I² = 62%; Analysis 3.1). Only Meng 2012 reported PFS data in 76 people, with no differences seen, HR 1.05 (95% CI 0.68 to 1.62, P = 0.83; Analysis 3.2). Median survival times in the gemcitabine group ranged from 5.2 months to 9.7 months and in the combination group from 5.2 months to 10.4 months (Table 3). Three studies reported response rates in 691 participants (61 responses versus 22 responses: with RR 3.66, 95% CI 1.04 to 12.82, P = 0.04; Gansauge 2002; Meng 2012; Oettle 2005; Analysis 3.3). Three studies reported haematological toxicity data for grade 3/4 events in 688 participants revealing more anaemia in the combination arm (Meng 2012; Oettle 2005; Ueno 2013 – EPA study): anaemia (49 events versus 12 events: RR 3.58, 95% CI 1.93 to 6.62, P < 0.001; Analysis 3.4), neutropenia (140 events versus 45 events: RR 2.02, 95% CI 0.88 to 4.66, P = 0.10; Analysis 3.5), and thrombocytopenia (55 events versus 23 events: RR 1.41, 95% CI 0.45 to 4.39, P = 0.56; Analysis 3.6). Four studies reported on nausea in 748 participants (17 events versus 11 events: RR 1.25, 95% CI 0.48 to 3.26, P = 0.64; Analysis 3.7).
Two studies reported on QoL: Meng 2012 used the FACT‐G and MD Anderson Symptom Inventory questionnaires, and Oettle 2005 used the EORTC QLQ‐C30 questionnaire. Meng 2012 did not find a difference in either of the scales used (FACT‐G and MD Anderson Symptom Inventory questionnaire) at eight weeks. Oettle 2005 showed that people in the gemcitabine alone group had lower financial difficulties and better physical and cognitive functioning, but the combination arm had lower pain scores. There was no clear trend in QoL scores between the treatment groups, however (Table 3).
There was an unclear risk of selection bias in Gansauge 2002 and Meng 2012 due to insufficient details being published. Ueno 2013 – EPA study did not provide enough details to perform a comprehensive assessment.
4 Fluoropyrimidine combinations versus fluoropyrimidine alone
Four studies reported OS in 491 participants receiving either fluoropyrimidine combinations or fluoropyrimidine alone with no differences in survival detected (HR 0.84, 95% CI 0.61 to 1.15, P = 0.27; Analysis 4.1). There was high statistical heterogeneity with an I² of 66%. Ducreux 2004, which studied 5FU with or without oxaliplatin, showed a large benefit in the treatment group in contrast to the other three studies, which did not show much benefit with the combination arms. Only two studies reported PFS in 255 participants, and there were no differences (HR 0.52, 95% CI 0.19 to 1.38, P = 0.19; Analysis 4.2), again, with large statistical heterogeneity (I² = 89%). Median survival times ranged from 3.7 months to 6.5 months in the combination group and from 3.4 months to 5.25 months in the 5FU group (Table 4). All four studies reported response rates, but there were no differences between arms (32 responses versus 24 responses: RR 1.18, 95% CI 0.52 to 2.68, P = 0.10; I² = 52%; Analysis 4.3). Two studies (N = 255) reported rates of grade 3/4 anaemia, neutropenia, thrombocytopenia, nausea, and diarrhoea (Ducreux 2004; Maisey 2002). There were no significant differences between groups in: anaemia (8 events versus 11 events: RR 0.48, 95% CI 0.06 to 3.62, P = 0.16; Analysis 4.4); neutropenia (7 events versus 0 events: RR 5.70, 95% CI 0.73 to 44.46, P = 0.10; Analysis 4.5); thrombocytopenia (5 events versus 3 events: RR 1.40, 95% CI 0.34 to 5.80, P = 0.65; Analysis 4.6); nausea (7 events versus 5 events, RR 1.06, 95% CI 0.32 to 3.53, P = 0.93; Analysis 4.8); or diarrhoea (6 events versus 6 events: RR 0.92, 95% CI 0.31 to 2.78, P = 0.89; Analysis 4.9). Maisey 2002 reported similar rates of grade 3/4 fatigue in both arms (26 events versus 30 events: RR 0.91, 95% CI 0.58 to 1.43, P = 0.68; Analysis 4.7).
| Study | Fluoropyrimidine combination details | Median survival:fluoropyrimidine combination vs fluoropyrimidine alone (months) | Quality of life |
| 5FU + oxaliplatin | 3.7 vs 3.4 | Not addressed | |
| 5FU + BCNU | Not stated | Not addressed | |
| 5FU + MMC | 6.5 vs 5.1 | EORTC‐QLQ C30 showed that at 24 weeks, global QoL was superior in the combination arm compared to baseline (P = 0.035), and the pain score was also improved (P = 0.048). There was less dyspnoea at 12 weeks in the combination arm when compared to baseline (P = 0.033). | |
| 5FU + streptozocin | 4.5 vs 5.25 | Not addressed |
5FU: fluorouracil; BCNU: bis‐chloroethylnitrosourea (carmustine); EORTC QLQ‐C30: European Organisation for Research and Treatment of Cancer quality of life questionnaire for cancer patients; MMC: 5FU+doxorubicin + mitomycin C; QoL: quality of life.
One study recorded QoL data (Maisey 2002), using the EORTC‐QLQ C30 questionnaire, which did not demonstrate a difference between the two groups at baseline, 12 weeks or 24 weeks (Table 4).
The main source of bias was in the non‐blinded study design. We assessed both Ducreux 2004 and Kovach 1974 as being at high risk of attrition bias, and this may have affected the results.
5 Single studies addressing unique treatment comparisons
Ten studies addressed unique comparisons that could not be categorised under the above‐mentioned comparisons (Table 5).
| Study | Treatment arms/no. of participants | Survival outcomes | Response rates | Adverse events | Quality of life |
| Multi‐armed studies | |||||
| Capecitabine/oxaliplatin (n = 61) versus capecitabine/gemcitabine (n = 64) versus modified gemcitabine/oxaliplatin (n = 63) | OS: 8.1 vs 9.0 v 6.9 months PFS 4.2 vs 5.7 v 3.9 months | PR 13% vs 25% vs 13% SbD: 36% vs 39% vs 43% | Haematological AEs more common in the gemcitabine containing arms | Not studied | |
| 5FU (n = 50) versus 5FU/doxorubicin (n = 44) versus 5FU/doxorubicin/mitomycin C (n = 50) | Median survival of 22 weeks in all treatment groups | 30% vs 30% vs 7.7% | Haematological AEs more common in the 5FU and 5FU/doxorubicin arm, however the subgroup with PC were not reported separately. | Not studied | |
| 5FU (n = 64) versus 5FU/cyclophosphamide/methotrexate 'Mallinson Regimen' (n = 61) versus 5FU/doxorubicin/cisplatin 'FAP' (n = 59) | OS: 3.5 vs 4.5 vs 3.5 months respectively PFS: 2.5 vs 2.5 vs 2.5 months | 7% vs 21% vs 15% | More AEs reported in the combination arms compared with 5FU alone | Not studied | |
| Gemcitabine (fixed dose rate) (n = 64) versus infusional gemcitabine + cisplatin (n = 66) versus infusional gemcitabine + docetaxel (n = 65) versus infusional gemcitabine + irinotecan (n = 60) | OS: 6.4 vs 6.7 vs 6.4 vs 7.1 months, respectively. Time to progression: 3.3 vs 4.5 vs 4.1 vs 4.0 months | 14 vs 12.5 vs 12 vs 14% | Neutropenia and fatigue most common AE and same in all groups | Not studied | |
| Other studies | |||||
| Gemcitabine/oxaliplatin (n = 20) vs simplified gemcitabine/oxaliplatin (n = 37) | OS: 3.2 vs 7.6 months PFS: 2.5 vs 4.0 months | PR: 10% vs 27% SbD: 45% vs 43% | Peripheral neuropathy more common in the simplified GemOx arm | Not studied | |
| Mitomycin C/5FU (MF) (n = 73) vs Streptozocin/mitomycin C/5FU (SMF) (n = 72) | OS: 17 vs 18 weeks | PR: 8% v 34% | More gastrointestinal and renal toxicity in the SMF arm | Not studied | |
| Standard nab‐paclitaxel and gemcitabine (n = 75) vs sequential nab‐paclitaxel and gemcitabine (n = 71) | OS: 7.9 vs 10.1 months (HR 0.88) PFS: 4.0 vs 5.8 months (HR 0.66) | PR: 33% vs 50% SbD: 28% vs 42% | Neutropenia more common in the sequential arm | QoL score dropped by −12.1 points at 24 weeks in the standard arm vs −2.1 in the sequential arm | |
| Gemcitabine 3‐week schedule (n = 45) vs gemcitabine 4‐week schedule (n = 45) | OS: 250 vs 206 days PFS: 114 vs 112 days | 17.1% vs 14.2% | Thrombocytopenia more common in the 4‐week schedule | Not studied | |
| Streptozocin/mitomycin C/5FU (SMF) (n = 42) vs cisplatin/ara‐C/caffeine (CAC) (n = 40) | OS: 10 vs 5 months | 10% vs 6% | Nausea and vomiting more common in CAC arm. | Not studied | |
| 5FU constant infusion vs 5FU constant infusion/cisplatin versus 5FU chronomodulated infusion vs 5FU chronomodulated infusion/cisplatin (no cisplatin n = 55, with cisplatin n = 52) | OS: 5.4 vs 8.3 months (no cis vs cis) OS: 6.1 vs 6.7 months (continuous vs chronomodulated) PFS: 2.1 vs 3.2 months | Not reported | Cisplatin increased rates of haematological AEs. Chronomodulated regimen increased rates of mucositis | Not studied | |
| Gemcitabine + docetaxel (n = 49) vs cisplatin + docetaxel (n = 47) | OS: 7.0 vs 7.5 months PFS: 3.9 vs 2.8 months | 19.4% vs 23.5% | Febile neutropenia more common in the cisplatin/docetaxel arm | Not studied | |
| Streptozocin + 5FU (n = 40) vs streptozocin + cyclophosphamide (n = 48) | OS: 13 vs 9 weeks | CR: 3 vs 6 PR: 2 vs 0 SbD: 9 vs 9 | Haematological AEs more common in the cyclophosphamide arm | Not studied | |
| Capecitabine + cisplatin + gemcitabine + docetaxel (PDXG) (n = 53) vs capecitabine + cisplatin + gemcitabine + epirubicin (PEXG) (n = 52) | OS: 10.7 vs 11 months PFS: 7.4 vs 7.6 months | CR: 2 vs 4% PR: 58 vs 33% | Neutropenia more common in the PEXG arm | Not studied | |
| Epirubicin (n = 32) vs 5FU + epirubicin + mitomycin C (n = 30) | 1 year survival rates 15.4 vs 23.2% | 8% vs 11% | AEs were similar in both arms | Not studied | |
5FU: fluorouracil; AE: adverse event; CR: complete response; OS: overall survival; PC: pancreatic cancer; PR: partial response; SbD: stable disease.
Boeck 2008 showed that capecitabine plus gemcitabine had superior median survival (9.0 months) and response rate (25%) compared with 8.1 months/13% in the capecitabine/oxaliplatin group and 6.9 months/13% in the gemcitabine/oxaliplatin group. Haematological AEs were more common in the gemcitabine‐containing regimens.
Kulke 2009 showed a similar OS in all four treatment groups, ranging from 6.4 months to 7.1 months and response rates of 12% to 14%. AEs were similar across treatment arms, with neutropenia and fatigue being the most common.
Afchain 2009 found that a simplified gemcitabine/oxaliplatin regimen was superior to a standard gemcitabine/oxaliplatin regimen with an OS of 7.6 months versus 3.2 months and response rate of 27% versus 10%. Peripheral neuropathy was more common in the simplified arm, however.
Bukowski 1983 did not demonstrate a difference in OS for streptozocin/MMC/5FU (SMF) versus MMC/5FU (18 weeks versus 17 weeks); however, there was an increase in response rate of 34% versus 8%. There was more gastrointestinal and renal toxicity in the SMF arm.
Hirao 2011 showed a slight increase in OS for the three‐week schedule of gemcitabine versus the four‐week schedule (250 days versus 206 days), but there was a similar response rate (17.1% versus 14.2%). Thrombocytopenia was more common in the four‐week schedule.
Kelsen 1991 found that the SMF arm had a longer OS than the cisplatin/ara‐C/caffeine arm (10 months versus 5 months), but a similar response rate (10% versus 6%). Nausea and vomiting were more common in the caffeine‐containing arm.
Levi 2004 showed that adding cisplatin to 5FU increased OS (8.3 months versus 5.4 months), but there was no difference between the continuous versus the chronomodulated arms (6.1 months versus 6.7 months). Cisplatin increased the rates of haematological AEs, and the chronomodulated regimen increased rates of mucositis.
Lutz 2005 did not demonstrate any striking differences between gemcitabine/docetaxel and cisplatin/docetaxel (OS 7.0 months versus 7.5 months); however, febrile neutropenia was more common in the cisplatin containing arm.
Moertel 1977 showed a slightly increased OS in the streptozocin/5FU arm compared with streptozocin/cyclophosphamide (13 weeks versus 9 weeks), with the cyclophosphamide arm experiencing more haematological AEs.
Reni 2012 showed a similar OS between capecitabine/cisplatin/gemcitabine/docetaxel (PDXG) and capecitabine/cisplatin/gemcitabine/epirubicin (PEXG) (10.7 months versus 11 months); however, there was a higher partial response rate in the PDXG group (58% versus 33%). The PEXG arm had more neutropenia.
Topham 1991 found a slightly higher one‐year survival rate in the 5FU/epirubicin/MMC arm compared with epirubicin alone (23.2% versus 15.4%), and the AEs were similar in both arms.
Discusión
Resumen de los resultados principales
1 Tratamiento anticanceroso versus el mejor tratamiento de apoyo
No es posible probar ni descartar un beneficio de supervivencia para el tratamiento anticanceroso versus MTA solo (evidencia de calidad moderada debido a la imprecisión; tabla de Resumen de los hallazgos 1). Lo anterior se contrapone a la versión anterior de esta revisión, que encontró un beneficio en las probabilidades de muerte tanto a los seis meses (OR 0,37; IC del 95%: 0,25 a 0,57; p < 0,001) como a los 12 meses (OR 0,46; IC del 95%: 0,25 a 0,84; P = 0,01). Debido al nuevo protocolo utilizado en este estudio, se excluyeron dos estudios que se habían presentado en la revisión anterior debido a que incluían a pacientes sin confirmación histológica (Mallinson 1980; Palmer 1994); esta es la causa probable de estos resultados discrepantes. Las diferencias en la supervivencia mediana fueron moderadas y variaron de 0,9 meses a favor del MTA a 3,5 meses a favor del tratamiento anticanceroso (Tabla 1).
Hay evidencia de una mejoría en la CdV con la administración del tratamiento anticanceroso en un estudio (Glimelius 1996), y Xinopoulos 2008 mostró un beneficio temprano que no se mantuvo después del mes 5.
Los lectores deben interpretar estos resultados con cuidado, debido a que los estudios incluidos abarcan más de 30 años, y Xinopoulos 2008 fue el único estudio que utilizó los regímenes de quimioterapia contemporáneos. Debido a que es improbable que se realicen estudios adicionales que utilicen el MTA como el brazo de control, podrían no generarse nunca datos aleatorios adicionales que muestren los efectos de la quimioterapia contemporánea sobre el MTA en el contexto de primera línea.
2 Diversos tipos de quimioterapia versus gemcitabina
El único estudio que considera la gemcitabina versus quimioterapia con 5FU, Burris 1997; mostró resultados inferiores para la SG (CRI 1,69; p = 0,004), la SLP (CRI 1,47; P = 0,005) y la CdV con el brazo de 5FU. La tabla de Resumen de los hallazgos 2 muestra una clasificación de la evidencia de calidad moderada debido a que hubo sólo un estudio pequeño disponible para el análisis. Estos resultados demuestran que la administración de gemcitabina reduce el riesgo de muerte en un 41% y la progresión en un 32% en comparación con el tratamiento con 5FU. La mejoría absoluta en la SG es moderada luego de poco más de un mes. La gemcitabina puede dar lugar a más EA de grado 3/4. Hay una mejoría en la CdV (respuesta de beneficio clínico).
El análisis de dos estudios que comparan FOLFIRINOX versus gemcitabina demostró una mejoría en la SG (CRI 0,51; P < 0,001), la SLP (CRI 0,46; P < 0,001) y la tasa de respuesta (CR 3,38; P < 0,001) aunque también significativamente más neutropenia y trombocitopenia (Conroy 2011; Singhal 2014). Hubo una mejoría en la CdV. La tabla de Resumen de los hallazgos 2 demuestra la clasificación de la evidencia de calidad moderada basado en la inconsistencia. Estos resultados indican que el FOLFIRINOX reduce el riesgo de muerte en un 49%, reduce el riesgo de progresión en un 54% y triplica la tasa de respuesta comparado con la gemcitabina. Las ganancias de supervivencia absoluta todavía son moderadas; la SG en el brazo de gemcitabina sola varía de 6,8 meses a 7,4 meses y en los brazos de FOLFIRINOX entre 10,8 meses a 11,1 meses.
Los dos estudios que evaluaron los efectos de la administración de gemcitabina en una tasa de dosis fija revelaron una mejoría en la SG (CRI 0,79; P = 0,009) aunque también más toxicidad hematológica (Poplin 2009; Tempero 2003). Como era de esperar, los brazos de gemcitabina “estándar” difirieron entre los dos estudios, aunque el estudio que utilizó un brazo de control más intenso (gemcitabina 2200 mg/m² por semana) todavía encontró una superioridad en el brazo de FDR‐gem. La tabla de Resumen de los hallazgos 2 detalla una clasificación de la evidencia de alta calidad. Este análisis indica que el uso de FDR‐gem reduce el riesgo de muerte en un 21%; sin embargo, las ganancias de supervivencia absoluta son nuevamente pequeñas; la SG en el brazo de gemcitabina infusional estándar varió de 4,9 meses a 5,0 meses y en el brazo de FDR‐gem de 6,2 meses a 8,0 meses.
Los estudios que compararon exatecan, CO‐101 y ZD9331 versus gemcitabina no mostraron un beneficio de supervivencia (Cheverton 2004; Poplin 2013; Smith 2003). Ninguno de estos estudios reveló una diferencia en la toxicidad y en cuanto al exatecan, los análisis mostraron que la CdV fue superior en el brazo de gemcitabina. Cada comparación se consideró como evidencia de calidad moderada debido a la imprecisión (tabla de Resumen de los hallazgos 2).
3 Estudios de la combinación de gemcitabina
3.1 Gemcitabina más un agente de platino versus gemcitabina sola
El análisis de siete estudios ha demostrado que la combinación de gemcitabina con un agente de platino no mejoró la SG de forma significativa (CRI 0,94; P = 0,38) aunque puede mejorar la SLP (CRI 0,80; P = 0,01) (Colucci 2002; Colucci 2010; Heinemann 2006; Louvet 2005; Viret 2004; Wang 2002). Lo anterior se equipara a una reducción del riesgo de progresión del 20%. La tabla de resumen de los hallazgos 3 muestra que la calidad de la evidencia en este análisis fue baja, debido a que dos estudios se realizaron en forma de resumen y no publicaron datos suficientes para realizar una evaluación completa, junto con la imprecisión. Estos resultados están de acuerdo con los hallazgos de la revisión anterior, que encontró un beneficio en la mortalidad a seis meses (OR 0,59; p = 0,001) aunque no en la mortalidad a 12 meses. No fue posible incluir todos los estudios de la revisión anterior (Li 2004 no publicó datos suficientes); sin embargo, se incluyeron dos estudios adicionales (Colucci 2010; Viret 2004). El agregado de platino mejoró las tasas de respuesta aunque aumentó la trombocitopenia y las náuseas. No se encontraron diferencias significativas en la CdV entre los brazos de control y de tratamiento en los pacientes examinados. Este hecho indica que mientras que el agregado del platino aumenta los efectos secundarios, este hecho no se traduce en una CdV peor. La mediana de los tiempos de supervivencia fue similar en los dos grupos (Tabla 3).
3.2 Gemcitabina más fluoropirimidina versus gemcitabina sola
El análisis de diez estudios demuestra que el agregado de un agente de fluoropirimidina puede mejorar la SG (CRI 0,88; P = 0,001), la SLP (0,79; P = 0,001) y la tasa de respuesta (CR 1,78; P = 0,001), aunque al costo de un aumento en las tasas de neutropenia y diarrea (Berlin 2002; Cunningham 2009; Di Costanzo 2005; Herrmann 2007; Lee 2017; Ohkawa 2004; Ozaka 2012; Riess 2005; Scheithauer 2003; Ueno 2013). La tabla de resumen de los hallazgos 3 muestra que la calidad de la evidencia es alta. Lo anterior indica que el agregado de 5FU reduce el riesgo de muerte en un 12%, reduce el riesgo de progresión en un 21% y casi duplica la tasa de respuesta, aunque también aumenta la toxicidad. Dos estudios no informaron diferencias en la CdV con el agregado de un agente de fluoropirimidina; sin embargo, dos estudios informaron una mejoría; Scheithauer 2003 mostró menos dolor y Ueno 2013 mostró una mejoría en los AVAC. La versión anterior de esta revisión no encontró beneficios significativos del agregado de fluoropirimidina a la gemcitabina; sin embargo, dicha versión analizó sólo cinco estudios, comparado con los 10 estudiados aquí. Debido a que este análisis incluyó agentes de fluoropirimidina tanto intravenosos como orales, estos resultados deben interpretarse con cuidado. Además, dos estudios usaron S1 (Ozaka 2012; Ueno 2013), y un estudio usó UFT (Ohkawa 2004), agentes que no se han estudiado bien en las poblaciones no asiáticas. La mejoría absoluta en la SG es pequeña y varió de 5,4 meses a 8,8 meses en el brazo de gemcitabina sola y de 6,7 meses a 13,7 meses en el brazo de combinación (Tabla 3).
3.3 Gemcitabina más inhibidor de topoisomerasa versus gemcitabina sola
El análisis de tres estudios demuestra que el agregado de un inhibidor de topoisomerasa a la gemcitabina no mejora significativamente la SG (CRI 1,01; P = 0,92) ni la SLP (CRI 0,91; P = 0,26) (Abou‐Alfa 2006; Rocha Lima 2004; Stathopoulos 2006). Las tasas de respuesta tampoco mejoraron de forma significativa (CR 1,50; P = 0,11); sin embargo, se observó una mejoría en la neutropenia. Sólo un estudio midió la CdV y no logró encontrar diferencias entre los dos grupos. La mediana de los tiempos de supervivencia fue similar en los dos grupos (Tabla 3).
Se evaluó la calidad de la evidencia como alta (tabla de Resumen de los hallazgos 3).
3.4 Gemcitabina más taxano versus gemcitabina sola
La búsqueda produjo sólo un estudio que pudo analizarse en esta categoría (Von Hoff 2013), y halló que el agregado de nab‐paclitaxel a la gemcitabina mejoró de forma significativa la SG (CRI 0,72; P < 0,001),la SLP (CRI 0,69; P < 0,001) y las tasas de respuesta (CR 3,29; P < 0,001). La tabla de Resumen de los hallazgos 3 muestra que la calidad de la evidencia es alta; sin embargo, hay sólo un estudio. Este hecho demuestra que el agregado de nab‐paclitaxel a la gemcitabina reduce el riesgo de muerte en un 28%, reduce el riesgo de progresión en un 31% y aumenta en más del triple la tasa de respuesta. Hay un mayor riesgo de neutropenia, neuropatía y fatiga, y no se midió la CdV. Aunque hay sólo un estudio en este análisis, también hubo otro estudio, Corrie 2017; que no pudo ser incluido; el mismo usó gemcitabina más nab‐paclitaxel como el grupo de control y publicó una SG, una SLP y datos de respuesta similares.
3.5 Gemcitabina más otras combinaciones de quimioterapia versus gemcitabina sola
Los dos estudios analizados revelaron que la combinación de gemcitabina con otros agentes múltiples mejora la SG (CRI 0,55; P = 0,001) y la SLP (CRI 0,43; P < 0,001) (Petrioli 2015; Reni 2005). Sólo un estudio informó las tasas de respuesta, que no fueron diferentes entre los grupos. Asimismo, un estudio informó una incidencia similar de EA. La CdV mejoró en ambos estudios. La tabla de Resumen de los hallazgos 3 muestra la clasificación baja para la calidad de la evidencia debido a que un estudio no publicó suficientes datos para realizar una evaluación completa y debido a la inconsistencia. Debido a que sólo un estudio informó las tasas de respuesta y los EA de grado 3/4; los números de eventos en estos análisis son reducidos y las conclusiones que pueden extraerse aquí son limitadas. Este análisis indica que la administración de tratamientos de combinación que contienen gemcitabina puede reducir el riesgo de muerte en un 45% y reducir el riesgo de progresión en un 57%; sin embargo, no es posible realizar evaluaciones con respecto a las tasas de efectos secundarios. Puede haber una mejoría en la CdV. Sólo un estudio informó el tiempo de supervivencia mediana, y mostró que la SG en el brazo de gemcitabina fue de 7,1 meses en comparación con 11,9 meses en el brazo de combinación (Tabla 3).
Las combinaciones multimedicamentosas que incluyen gemcitabina pueden ser efectivas para mejorar los resultados de supervivencia, y debido a los resultados positivos del estudio Conroy 2011; que utiliza FOLFIRINOX, los resultados agregan peso al argumento de que la quimioterapia intensiva tiene un lugar en el tratamiento del CP.
3.6 Gemcitabina más otro/s agente/s versus gemcitabina sola
Este grupo contiene estudios que no pertenecían a ninguno de los otros análisis agrupados. Los cuatro estudios analizados aquí son heterogéneos en cuanto a los agentes usados (Gansauge 2002; Meng 2012; Oettle 2005; Ueno 2013 – EPA study). El análisis demuestra que la SG no es significativamente diferente en el brazo de combinación. Tres estudios revelan una mejoría en las tasas de respuesta aunque también un aumento en la anemia. Se observó heterogeneidad estadística alta en ambos análisis de supervivencia, la cual probablemente sea representada por los diversos agentes utilizados. La CdV no fue significativamente diferente en los dos estudios que informaron este resultado. El tiempo de supervivencia mediana fue más prolongado en el estudio Gansauge 2002 aunque muy similar (Tabla 3).
Estos datos deben interpretarse con cuidado, debido a que los estudios usaron una gama amplia de agentes. Los resultados para Ukrain en Gansauge 2002 son sumamente provocativos y pueden justificar el estudio adicional en números mayores, apoyado por un metanálisis a través de diferentes tipos de cáncer (Ernst 2005). La calidad de la evidencia se evaluó como baja debido a la imprecisión y a la inconsistencia (tabla de Resumen de los hallazgos 3).
4 Combinaciones de fluoropirimidina versus fluoropirimidina sola
Este análisis demostró que el agrupamiento de los datos de los estudios que agregaron un agente al 5FU no dio lugar a un beneficio significativo en la SG (CRI 0,84; P = 0,27) ni en la SLP (0,52; P = 0,19) en comparación con 5FU solo (Ducreux 2004; Kovach 1974; Maisey 2002; Moertel 1979). Sin embargo, en estos dos análisis, hubo heterogeneidad estadística alta (I² = 66% y 89%, respectivamente), probablemente debido al rango de agentes evaluados. Tres estudios usaron quimioterapias bastante antiguas (BCNU, MMC y estreptozocina), mientras que un estudio usó oxaliplatino (Ducreux 2004). Este estudio representa la mayoría de la heterogeneidad observada, debido a que encontró un beneficio estadísticamente significativo tanto en la SG como en la SLP a diferencia de los otros estudios. Las tasas de respuesta no mejoraron significativamente (CR 1,18; P = 0,69), y nuevamente se observó una heterogeneidad estadística alta que se debió principalmente al estudio Kovach 1974 que evaluó la BCNU e informó respuestas más altas en el grupo de 5FU solo. Los EA de grado 3/4 no fueron significativamente diferentes entre los dos grupos. Sólo Maisey 2002 evaluó la CdV y demostró una mejoría en la disnea.
Las conclusiones que pueden extraerse de este análisis son limitadas. Parece que según los resultados del estudio Ducreux 2004 el oxaliplatino más 5FU es una combinación activa comparada con 5FU solo y no aumenta cuantificablemente los efectos secundarios.
La calidad de la evidencia se evaluó como baja debido a la imprecisión y a la heterogeneidad estadística (tabla de Resumen de los hallazgos 4).
Compleción y aplicabilidad general de las pruebas
Según lo que se conoce, esta revisión contiene una revisión completa de toda la evidencia disponible hasta la fecha de censo. Se hizo todo lo que estuvo al alcance para realizar el análisis de una manera clínicamente relevante con objeto de cumplir la meta de ayudar a los pacientes y a los médicos en la toma de decisiones.
Calidad de la evidencia
Dos autores de la revisión evaluaron de forma independiente el riesgo de sesgo de los estudios individuales mediante los criterios GRADE, y dicha información se tabuló en la Figura 2; la Figura 3 y las tablas de “Resumen de los hallazgos”. Sólo cuatro comparaciones de subgrupos fueron de alta calidad, mientras que las comparaciones restantes proporcionaron evidencia de calidad moderada o baja. Este hecho se debió principalmente a la inconsistencia y los tamaños de la muestra pequeños. Debido a que el CP es una enfermedad poco frecuente que comúnmente se observa en las personas de edad más avanzada, el reclutamiento para los estudios clínicos es increíblemente difícil. Además, los estudios recientes de secuenciación a gran escala han revelado la heterogeneidad genética marcada en el CP, que probablemente contribuya con los efectos inconsistentes observados entre los estudios (Bailey 2016). Lo anterior debe guiar los estudios futuros y promover el diseño de estudio estratificado.
Sesgos potenciales en el proceso de revisión
Para reducir los sesgos potenciales en el proceso de revisión, dos autores de la revisión por separado evaluaron los estudios y extrajeron los datos de forma independiente, resolviendo las controversias con la adjudicación por parte de un tercer autor de la revisión. No se identificaron otros posibles sesgos.
Acuerdos y desacuerdos con otros estudios o revisiones
A diferencia de la versión anterior de esta revisión (Yip 2009), no fue posible repetir el beneficio observado para el tratamiento anticanceroso versus el mejor tratamiento de apoyo solo. Según se consideró en el texto principal, lo anterior se debió principalmente al hecho de que no fue posible incluir todos los estudios previamente analizados debido a la falta de datos disponibles del tiempo hasta el evento.
Se ha hecho un agregado al alcance y los resultados de la revisión anterior al ampliar los criterios de inclusión y se han podido proporcionar más recomendaciones.

1 Study flow diagram.
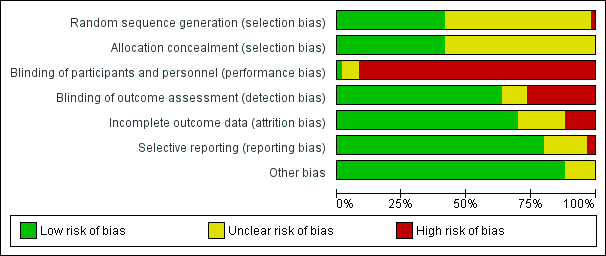
Risk of bias graph: review authors' judgements about each risk of bias item presented as percentages across all included studies.

Risk of bias summary: review authors' judgements about each risk of bias item for each included study.
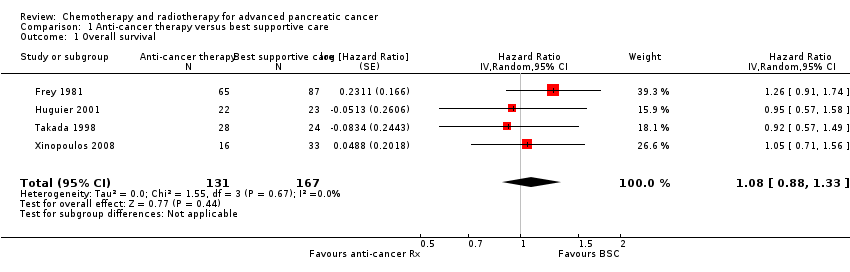
Comparison 1 Anti‐cancer therapy versus best supportive care, Outcome 1 Overall survival.

Comparison 2 Various types of chemotherapy versus gemcitabine, Outcome 1 Overall survival.

Comparison 2 Various types of chemotherapy versus gemcitabine, Outcome 2 Progression‐free survival.
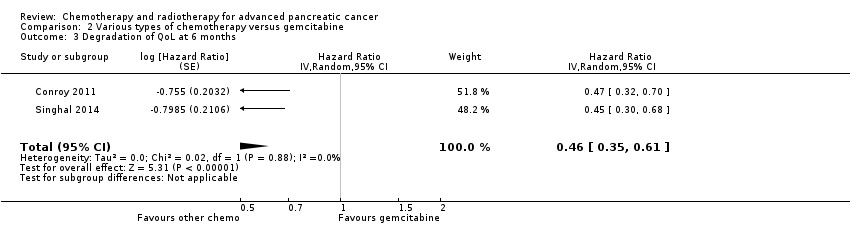
Comparison 2 Various types of chemotherapy versus gemcitabine, Outcome 3 Degradation of QoL at 6 months.
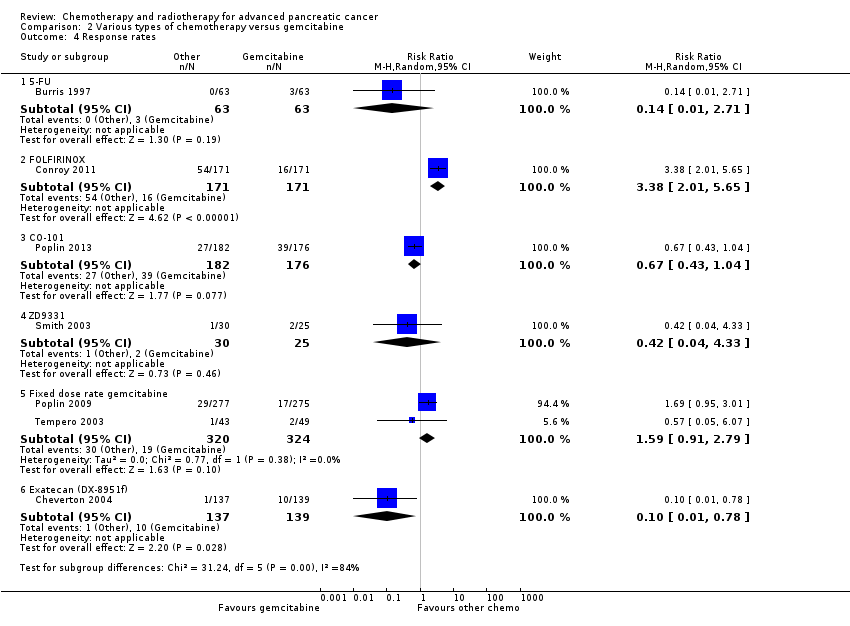
Comparison 2 Various types of chemotherapy versus gemcitabine, Outcome 4 Response rates.

Comparison 2 Various types of chemotherapy versus gemcitabine, Outcome 5 Grade 3/4 anaemia.

Comparison 2 Various types of chemotherapy versus gemcitabine, Outcome 6 Grade 3/4 neutropenia.

Comparison 2 Various types of chemotherapy versus gemcitabine, Outcome 7 Grade 3/4 thrombocytopenia.

Comparison 2 Various types of chemotherapy versus gemcitabine, Outcome 8 Grade 3/4 nausea.
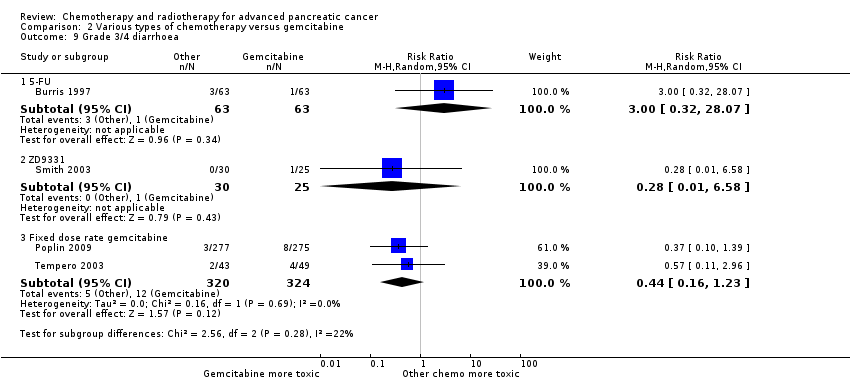
Comparison 2 Various types of chemotherapy versus gemcitabine, Outcome 9 Grade 3/4 diarrhoea.
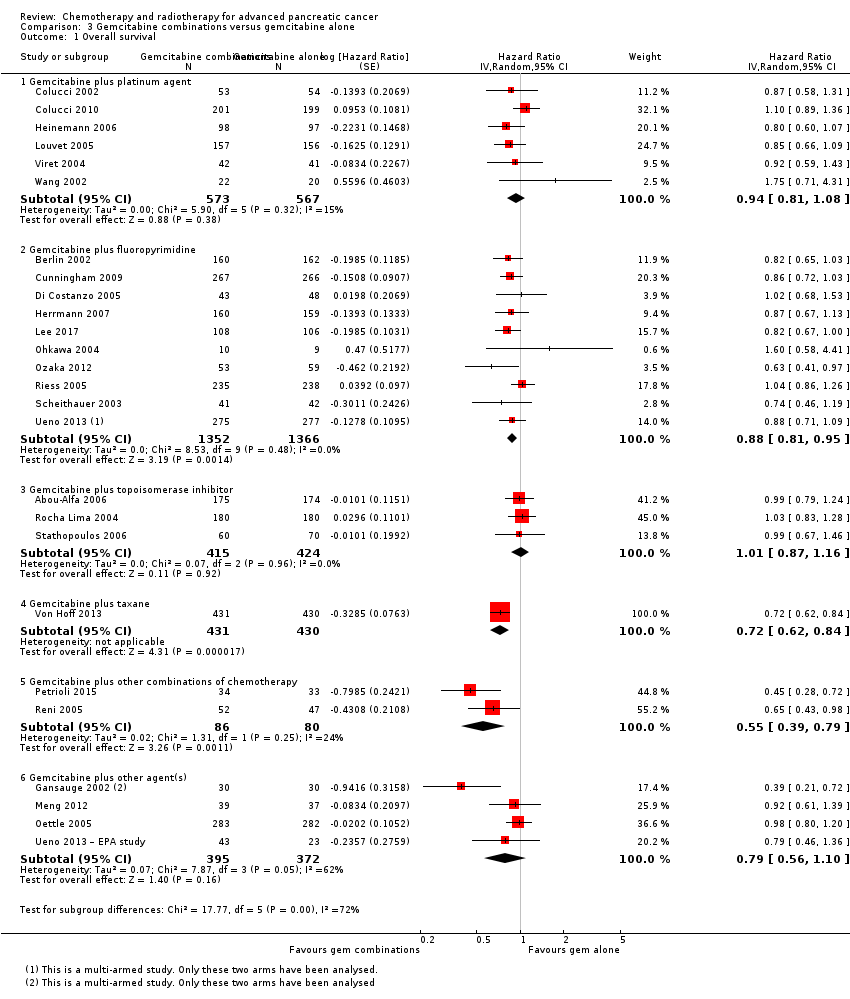
Comparison 3 Gemcitabine combinations versus gemcitabine alone, Outcome 1 Overall survival.
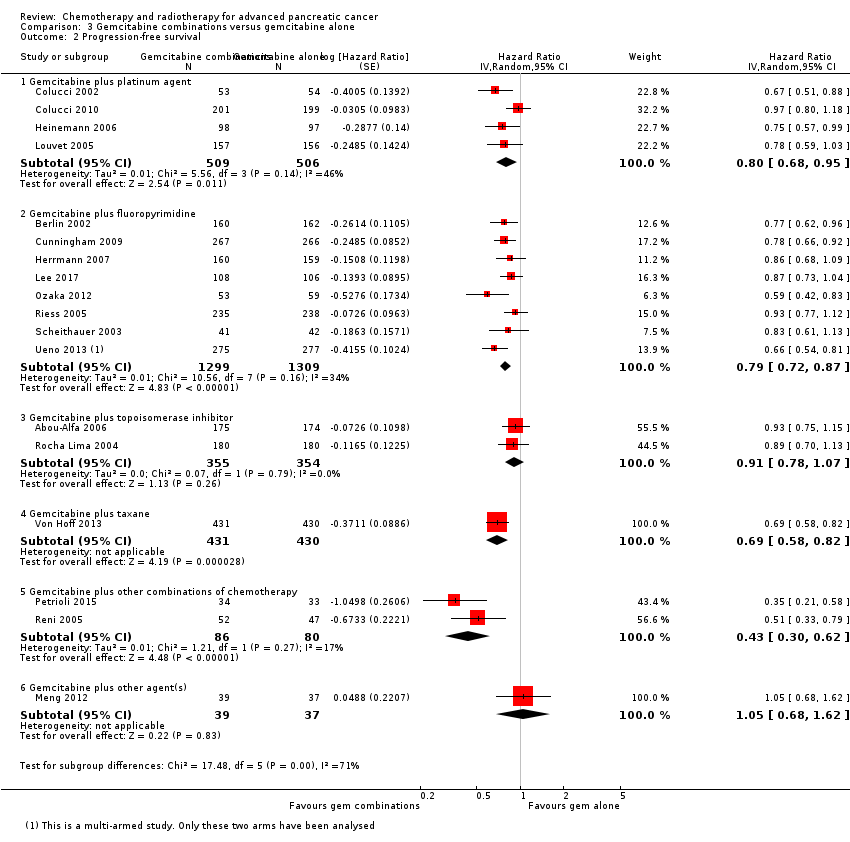
Comparison 3 Gemcitabine combinations versus gemcitabine alone, Outcome 2 Progression‐free survival.

Comparison 3 Gemcitabine combinations versus gemcitabine alone, Outcome 3 Response rates.

Comparison 3 Gemcitabine combinations versus gemcitabine alone, Outcome 4 Grade 3/4 anaemia.
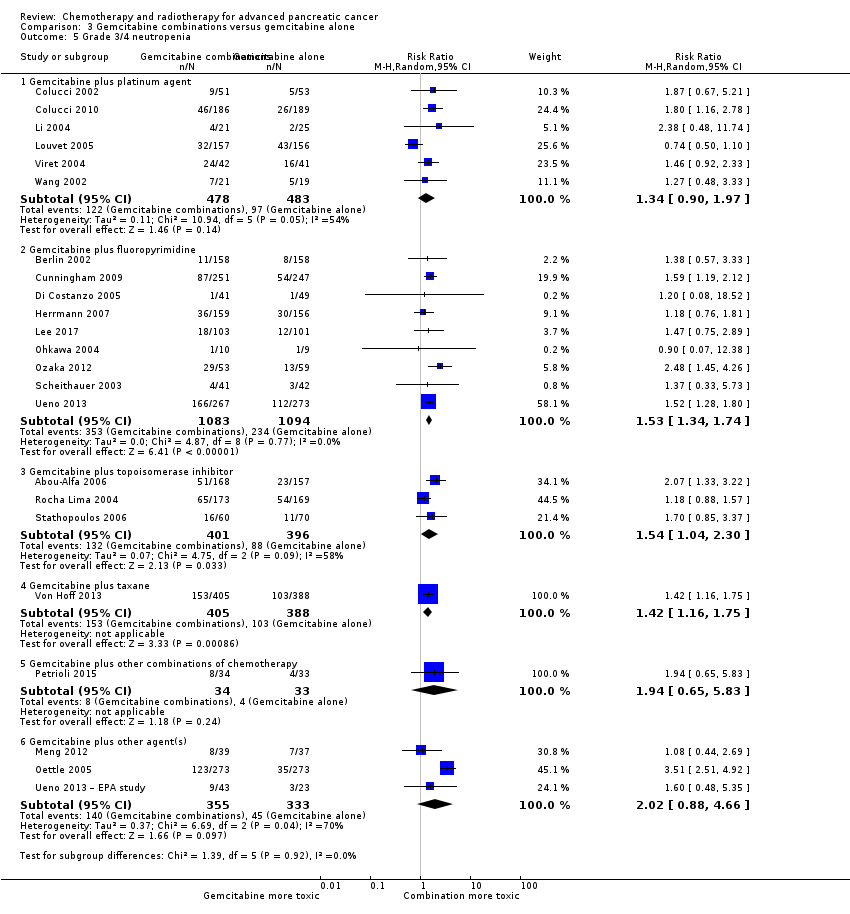
Comparison 3 Gemcitabine combinations versus gemcitabine alone, Outcome 5 Grade 3/4 neutropenia.

Comparison 3 Gemcitabine combinations versus gemcitabine alone, Outcome 6 Grade 3/4 thrombocytopenia.

Comparison 3 Gemcitabine combinations versus gemcitabine alone, Outcome 7 Grade 3/4 nausea.
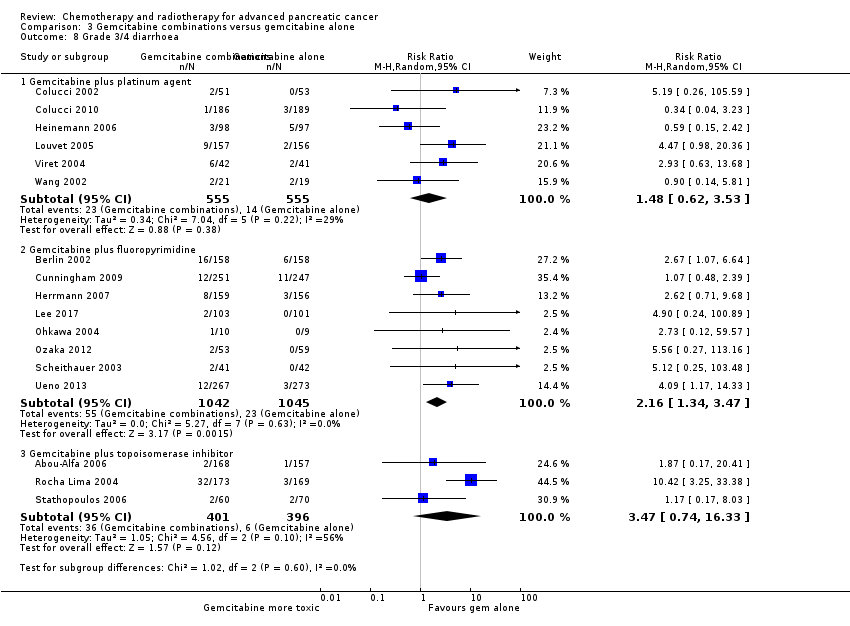
Comparison 3 Gemcitabine combinations versus gemcitabine alone, Outcome 8 Grade 3/4 diarrhoea.

Comparison 3 Gemcitabine combinations versus gemcitabine alone, Outcome 9 Grade 3/4 neuropathy.
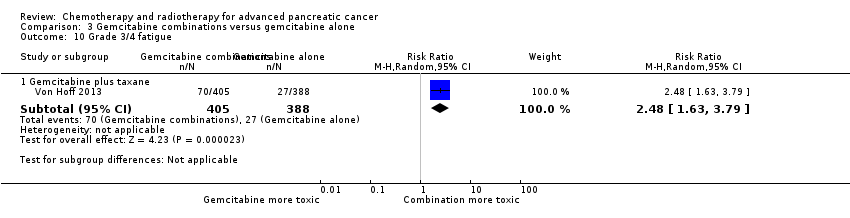
Comparison 3 Gemcitabine combinations versus gemcitabine alone, Outcome 10 Grade 3/4 fatigue.
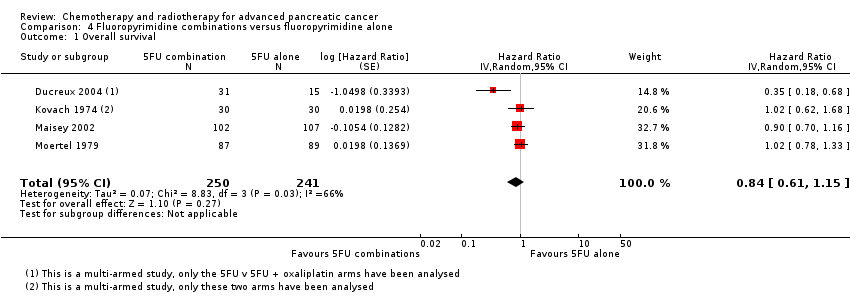
Comparison 4 Fluoropyrimidine combinations versus fluoropyrimidine alone, Outcome 1 Overall survival.
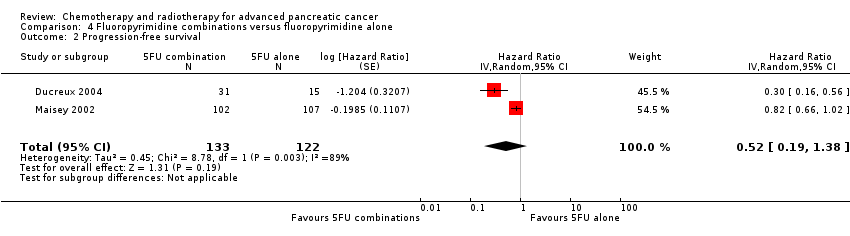
Comparison 4 Fluoropyrimidine combinations versus fluoropyrimidine alone, Outcome 2 Progression‐free survival.

Comparison 4 Fluoropyrimidine combinations versus fluoropyrimidine alone, Outcome 3 Response rates.
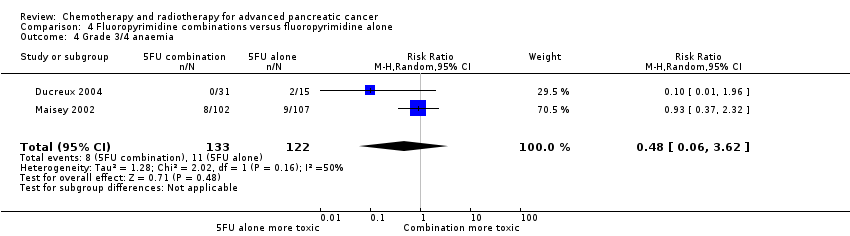
Comparison 4 Fluoropyrimidine combinations versus fluoropyrimidine alone, Outcome 4 Grade 3/4 anaemia.
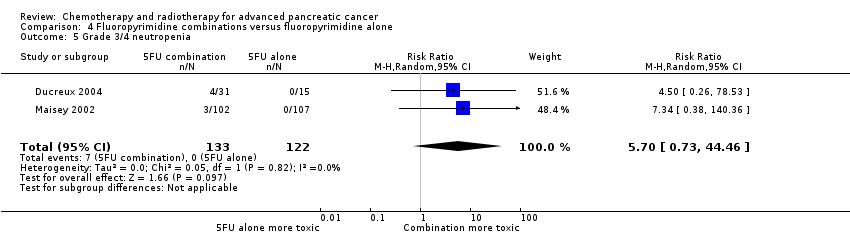
Comparison 4 Fluoropyrimidine combinations versus fluoropyrimidine alone, Outcome 5 Grade 3/4 neutropenia.

Comparison 4 Fluoropyrimidine combinations versus fluoropyrimidine alone, Outcome 6 Grade 3/4 thrombocytopenia.
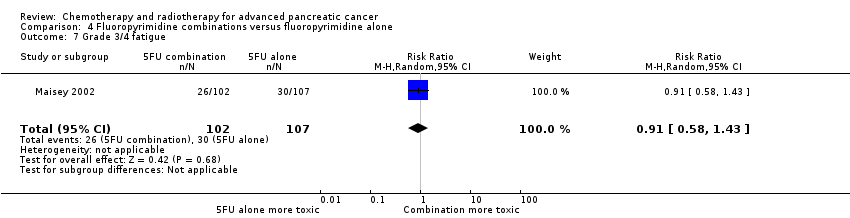
Comparison 4 Fluoropyrimidine combinations versus fluoropyrimidine alone, Outcome 7 Grade 3/4 fatigue.
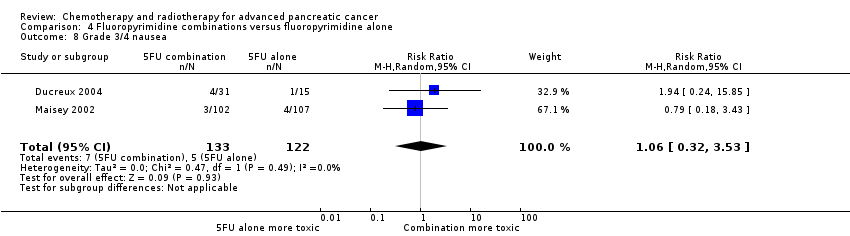
Comparison 4 Fluoropyrimidine combinations versus fluoropyrimidine alone, Outcome 8 Grade 3/4 nausea.

Comparison 4 Fluoropyrimidine combinations versus fluoropyrimidine alone, Outcome 9 Grade 3/4 diarrhoea.
| Anti‐cancer therapy versus best supportive care for advanced pancreatic cancer | |||||||
| Person or population: advanced pancreatic cancer | |||||||
| Outcomes | Anticipated risk of death* (95% CI) | Relative effect | № of participants | Quality of the evidence | Comments | Toxicity and QoL | |
| Risk with best supportive care | Risk with anti‐cancer therapy | ||||||
| Overall survival | Study population | HR 1.08 | 298 | ⊕⊕⊕⊝ | — | The analysis showed that toxicity data were inconsistently reported. Most studies reporting this outcome noted that gastrointestinal adverse events were the most frequent, occurring in between 15% to 31%. 1 study noted haematological toxicity was present in 81.5% of people. 2 out of the 3 studies that analysed QoL demonstrated a benefit with anti‐cancer therapy. 1 study showed no difference between the 2 groups. | |
| 707 per 1000 | 734 per 1000 | ||||||
| *The risk in the intervention group (and its 95% confidence interval) is based on the assumed risk in the comparison group and the relative effect of the intervention (and its 95% CI). | |||||||
| GRADE Working Group grades of evidence | |||||||
| aConfidence interval include both benefit and harm; optimal information size not met. | |||||||
| Various types of chemotherapy versus gemcitabine for advanced pancreatic cancer | |||||||
| Person or population: advanced pancreatic cancer | |||||||
| Outcomes | Anticipated risk of death* (95% CI) | Relative effect | № of participants | Quality of the evidence | Comments | Toxicity and QoL | |
| Risk with gemcitabine | Risk with various types of chemotherapy | ||||||
| Overall survival ‐ 5FU | Study population | HR 1.69 | 126 | ⊕⊕⊕⊝ | Only 1 study | More toxicity was seen in the gemcitabine arm. Clinical benefit was improved in the gemcitabine arm | |
| 825 per 1000 | 948 per 1000 | ||||||
| Overall survival ‐ FOLFIRINOX | Study population | HR 0.51 | 652 | ⊕⊕⊕⊝ | — | More toxicity was seen in the FOLFIRINOX arm. Longer time to degradation of QoL in FOLFIRINOX arm | |
| 794 per 1000 | 554 per 1000 | ||||||
| Overall survival ‐ Fixed dose rate gemcitabine | Study population | HR 0.79 | 644 | ⊕⊕⊕⊕ | — | More toxicity in the fixed‐dose rate arm. QoL was not tested | |
| 880 per 1000 | 812 per 1000 | ||||||
| Overall survival ‐ CO‐101 | Study population | HR 1.07 | 367 | ⊕⊕⊕⊝ | Only 1 study | Toxicity was similar in both arms, QoL was not tested | |
| 854 per 1000 | 872 per 1000 | ||||||
| Overall survival ‐ ZD9331 | Study population | HR 0.86 | 55 | ⊕⊕⊕⊝ | Only 1 study | Toxicity was similar in both arms, QoL was not tested | |
| 560 per 1000 | 506 per 1000 | ||||||
| Overall survival ‐ Exatecan | Study population | HR 1.27 | 339 | ⊕⊕⊕⊝ | Only 1 study | Toxicity was similar in both arms, QoL was superior in the gemcitabine arm | |
| 776 per 1000 | 851 per 1000 | ||||||
| *The risk in the intervention group (and its 95% confidence interval) is based on the assumed risk in the comparison group and the relative effect of the intervention (and its 95% CI). | |||||||
| GRADE Working Group grades of evidence | |||||||
| aSmall sample size; optimal information size not met. | |||||||
| Gemcitabine combinations versus gemcitabine alone for advanced pancreatic cancer | |||||||
| Person or population: advanced pancreatic cancer | |||||||
| Outcomes | Anticipated risk of death* (95% CI) | Relative effect | № of participants | Quality of the evidence | Comments | Toxicity and QoL | |
| Risk with gemcitabine alone | Risk with gemcitabine combinations | ||||||
| Overall survival ‐ Gemcitabine plus platinum agent | Study population | HR 0.94 | 1140 | ⊕⊕⊝⊝ | — | More toxicity in the combination arm with no differences shown in QoL | |
| 705 per 1000 | 683 per 1000 | ||||||
| Overall survival ‐ Gemcitabine plus fluoropyrimidine | Study population | HR 0.89 | 2718 | ⊕⊕⊕⊕ | — | More toxicity in the combination arm. 2 studies showed no difference in QoL, 2 studies showed an improved QoL in the combination arm | |
| 690 per 1000 | 648 per 1000 | ||||||
| Overall survival ‐ Gemcitabine plus topoisomerase inhibitor | Study population | HR 1.01 | 839 | ⊕⊕⊕⊕ | — | More toxicity in the combination arm. In 1 study, QoL was not different between the 2 arms | |
| 800 per 1000 | 803 per 1000 | ||||||
| Overall survival ‐ Gemcitabine plus taxane | Study population | HR 0.72 | 861 | ⊕⊕⊕⊕ | 1 study only | More toxicity in the combination arm. QoL not measured | |
| 779 per 1000 | 663 per 1000 | ||||||
| Overall survival ‐ Gemcitabine plus other combinations of chemotherapy | Study population | HR 0.55 | 166 | ⊕⊕⊝⊝ | — | Toxicity measured in 1 study and was not different. QoL was shown to be improved in the combination arms in both studies | |
| 850 per 1000 | 648 per 1000 | ||||||
| Overall survival ‐ Gemcitabine plus other agent(s) | Study population | HR 0.79 | 767 | ⊕⊕⊝⊝ | There was an increase in anaemia in the combination arm. 2 studies measured QoL and it was similar in both treatment arms | ||
| 825 per 1000 | 748 per 1000 | ||||||
| *The risk in the intervention group (and its 95% confidence interval) is based on the assumed risk in the comparison group and the relative effect of the intervention (and its 95% CI). | |||||||
| GRADE Working Group grades of evidence | |||||||
| aTwo studies were in abstract form and could not have full assessment completed. | |||||||
| Fluoropyrimidine combinations versus fluoropyrimidine alone for advanced pancreatic cancer | ||||||
| Person or population: advanced pancreatic cancer | ||||||
| Outcomes | Anticipated risk of death* (95% CI) | Relative effect | № of participants | Quality of the evidence | Toxicity and QoL | |
| Risk with fluoropyrimidine alone | Risk with fluoropyrimidine combinations | |||||
| Overall survival | Study population | HR 0.84 | 491 | ⊕⊕⊝⊝ | Toxicity was not different between the 2 treatment arms. QoL was measured in 1 study and showed an improvement in the combination arm | |
| 838 per 1000 | 783 per 1000 | |||||
| *The risk in the intervention group (and its 95% confidence interval) is based on the assumed risk in the comparison group and the relative effect of the intervention (and its 95% CI). | ||||||
| GRADE Working Group grades of evidence | ||||||
| aHigh statistical heterogeneity. | ||||||
| Study | Anti‐cancer therapy details | Median survival:anti‐cancer therapy vs best supportive care (months) | Quality of life |
| 5FU + CCNU | 5 vs 4 | No difference in Karnofsky performance status (KPS) score | |
| 5FU + CCNU | 3.0 vs 3.9 | Not addressed | |
| 5FU + LV | 6.0 vs 2.5 | EORTC QLQ‐C30 results favoured the anti‐cancer therapy (NB: high rate of dropouts in the later time points) | |
| 5FU + LV + cisplatin | 8.6 vs 7.0 | Not addressed | |
| 5FU + doxorubicin + MMC | 4.9 vs 5.0 | Not addressed | |
| Gemcitabine | 5.25 vs 5.5 | Superior QoL (EORTC QLQ‐C30) in the gemcitabine group during the 1st month (P = 0.028), no difference from the 2nd to the 4th month; in the 5th and 6th month superior QoL in the BSC group (P = 0.010 and < 0.001) | |
| 5FU: 5‐Fluorouracil; CCNU: chloroethylcyclohexylnitrosurea; EORTC QLQ‐C30: European Organisation for Research and Treatment of Cancer quality of life questionnaire for cancer patients; LV: leucovorin; MMC: 5FU+doxorubicin + mitomycin C | |||
| Study | Type of other chemotherapy | Median survival:other chemotherapy vs gemcitabine (months) | Quality of life |
| 5FU | 4.4 vs 5.7 | Improved clinical benefit 4.8% vs 23.8%. Median time to benefit 7 vs 3 weeks. Duration of benefit 18 vs 13 weeks | |
| FOLFIRINOX | 11.1 vs 6.8 | QLQ‐C30: decrease in Global Health Status and QoL scale at 3 months 17% vs 31%; at 6 months 31% vs 66% Median time to definitive deterioration: not reached vs 5.7 months | |
| FOLFIRINOX | 10.8 vs 7.4 | Definitive degradation of QoL at six months: 29% vs 59% | |
| CO‐101 | 5.2 vs 6.0 | Not addressed | |
| ZD‐9331 | 5.0 vs 3.6 | Not addressed | |
| Fixed dose rate gemcitabine 1500 mg/m² over 150 min | 6.2 vs 4.9 | Not addressed | |
| Fixed dose rate gemcitabine 1500 mg/m² at 10 mg/m²/min | 8.0 vs 5.0 | Not addressed | |
| Exatecan (DX‐8951f) | 5.0 vs 6.6 | Time to worsening of clinical benefit was longer in the gemcitabine group. Pain (3.7 vs 7.9 months; P = 0.0493), KPS (3.4 vs 4.6 months; P = 0.0111) and weight (2.3 vs 3.8 months; P = 0.0203). QoL measured with QLQ‐C3 and QLQ‐PAN26 were similar in the 2 groups | |
| 5FU: 5‐Fluorouracil; FOLFIRINOX: 5‐fluorouracil + irinotecan + oxaliplatin; QoL: quality of life; QLQ‐C30 and QLQ‐PAN26: general and pancreatic cancer specific QoL questionnaire. | |||
| Study | Gemcitabine combination details | Median survival:gemcitabine combination vs gemcitabine alone (months) | Quality of life |
| Platinum combinations | |||
| Gemcitabine + cisplatin | 7.5 vs 5.0 | Not addressed | |
| Gemcitabine + cisplatin | 7.2 vs 8.3 | The mean difference from baseline in global QoL (EORTC C30) was not significantly different between the 2 groups: 0.09 (gemcitabine/cisplatin) vs 6.20 (gemcitabine), P = 0.07 | |
| Gemcitabine + cisplatin | 7.5 vs 6.0 | No difference was detected in the 2 groups with either the Spitzer index or the pain intensity score | |
| Gemcitabine + cisplatin | 5.6 vs 4.6 | Clinical benefit (pain control, performance status, body weight gain) 29% vs 36% (P > 0.05); Quality adjusted life months 3.8 vs 5.6 (P < 0.001) | |
| Gemcitabine + oxaliplatin | 9.0 vs 7.1 | Not addressed | |
| Gemcitabine + cisplatin | 8.0 vs 6.7 | Q‐TWiST results did not differ significantly between the 2 arms (EORTC C30) | |
| Gemcitabine + cisplatin | 7.2 vs 9.1 | Not addressed | |
| Fluoropyrimidine combinations | |||
| Gemcitabine + 5FU (weekly) | 6.7 vs 5.4 | Not addressed | |
| Gemcitabine + capecitabine | 7.1 vs 6.2 | 89% of people completed QoL questionnaires (EORTC QLQ‐C30 + ESPAC). No differences seen at baseline between the 2 groups and no differences across treatment groups at 3 or 6 months | |
| Gemcitabine + daily 5FU | 7.5 vs 7.75 | No differences were seen between the 2 groups in mean disturbed days after cycle 1 or 2 or mean of days a person would like to cancel treatment in cycle 1 or 2 | |
| Gemcitabine + capecitabine | 8.4 vs 7.2 | CBR seen in 29% of people in combination arm and 20% of people in gemcitabine arm. Median duration of response 9.5 and 6.5 weeks, respectively (P < 0.02). No differences in QoL as measured by LASA | |
| Gemcitabine + capecitabine | 10.3 vs 7.5 | Not addressed | |
| Gemcitabine + UFT | Not stated | Not addressed | |
| Gemcitabine + S1 | 13.7 vs 8.0 | Not addressed | |
| Gemcitabine + 5FU (24 hour infusion) + FA | Not stated | Not addressed | |
| Gemcitabine + capecitabine | 9.5 vs 8.2 | The gemcitabine + capecitabine arm had an improvement in pain (35.5 vs 20%), KPS (41.9 vs 27%), but not weight (9.7 vs 17%) | |
| Gemcitabine + S1 | 10.1 vs 8.8 | The gemcitabine + S1 group showed an improvement in QALYs 0.525 vs 0.401, P < 0.001 | |
| Topoisomerase combinations | |||
| Gemcitabine + exatecan | 6.2 vs 6.7 | Not addressed | |
| Gemcitabine + irinotecan | 6.3 vs 6.5 | FACT‐Hep questionnaires were completed by 80% of people in irinotecan/gemcitabine group and 73% of the gemcitabine group during the first 30 weeks of the study. There were no differences between the 2 groups. | |
| Gemcitabine + irinotecan | 6.4 vs 6.5 | Not addressed | |
| Taxane combinations | |||
| Gemcitabine + nab‐paclitaxel | 8.5 vs 6.7 | Not addressed | |
| Other combination chemotherapy including gemcitabine | |||
| Gemcitabine + oxaliplatin + capecitabine (GEMOXEL) | 11.9 vs 7.1 | The global QoL score was higher in the combination chemotherapy group at 2 months (61 vs 56) and 4 months (72 vs 66) | |
| Cisplatin/epirubicin/gemcitabine/5FU (PEFG) | Not stated | The EORTC‐QLQ Pan 26 questionnaire was done but the sample size was insufficient to obtain adequate statistical power to reliably detect differences between groups for multiple comparisons. People in PEFG group 20% to 44% more likely to have improvement in emotional functioning, overall quality of life, cognitive measures, pain, fatigue, indigestion, dyspnoea, appetite loss and flatulence. However, people in gemcitabine group had better scores for sexual function and body image | |
| Other agents in combination with gemcitabine | |||
| Gemcitabine + Ukrain | 10.4 vs 5.2 | Not addressed | |
| Gemcitabine + huachansu | 5.2 vs 5.3 | No significant differences were seen between the treatment groups with either the FACT‐G or MDASI assessments | |
| Gemcitabine + pemetrexed | 6.2 vs 6.3 | People in the gemcitabine group had better financial difficulties score, better physical functioning score and better cognitive functioning score. People in the gemcitabine/pemetrexed group had better pain scores. Performance status improvements was seen in 11.4% of gemcitabine/pemetrexed group and 9.4% of gemcitabine group. Weight gain was seen in 10.2% of gemcitabine/pemetrexed group and 5.7% of gemcitabine group | |
| Gemcitabine + EPA | 8.2 vs 9.7 | Not addressed | |
| 5FU: fluorouracil; CBR: clinical benefit response; ESPAC: European Study Group for Pancreatic Cancer; EORTC: European Organisation for Research and Treatment of Cancer; FACT‐G: Functional Assessment of Cancer Therapy; FA: folinic acid; KPS: Karnofsky performance status; LASA: linear‐analog self‐assessment indicators; MDASI: MD Anderson Symptom Inventory; QALY: quality‐adjusted life year; QLQ‐C30: quality of life questionnaire for cancer patients; QoL: quality of life; Q‐TWiST: quality‐adjusted time without symptoms or toxicity. | |||
| Study | Fluoropyrimidine combination details | Median survival:fluoropyrimidine combination vs fluoropyrimidine alone (months) | Quality of life |
| 5FU + oxaliplatin | 3.7 vs 3.4 | Not addressed | |
| 5FU + BCNU | Not stated | Not addressed | |
| 5FU + MMC | 6.5 vs 5.1 | EORTC‐QLQ C30 showed that at 24 weeks, global QoL was superior in the combination arm compared to baseline (P = 0.035), and the pain score was also improved (P = 0.048). There was less dyspnoea at 12 weeks in the combination arm when compared to baseline (P = 0.033). | |
| 5FU + streptozocin | 4.5 vs 5.25 | Not addressed | |
| 5FU: fluorouracil; BCNU: bis‐chloroethylnitrosourea (carmustine); EORTC QLQ‐C30: European Organisation for Research and Treatment of Cancer quality of life questionnaire for cancer patients; MMC: 5FU+doxorubicin + mitomycin C; QoL: quality of life. | |||
| Study | Treatment arms/no. of participants | Survival outcomes | Response rates | Adverse events | Quality of life |
| Multi‐armed studies | |||||
| Capecitabine/oxaliplatin (n = 61) versus capecitabine/gemcitabine (n = 64) versus modified gemcitabine/oxaliplatin (n = 63) | OS: 8.1 vs 9.0 v 6.9 months PFS 4.2 vs 5.7 v 3.9 months | PR 13% vs 25% vs 13% SbD: 36% vs 39% vs 43% | Haematological AEs more common in the gemcitabine containing arms | Not studied | |
| 5FU (n = 50) versus 5FU/doxorubicin (n = 44) versus 5FU/doxorubicin/mitomycin C (n = 50) | Median survival of 22 weeks in all treatment groups | 30% vs 30% vs 7.7% | Haematological AEs more common in the 5FU and 5FU/doxorubicin arm, however the subgroup with PC were not reported separately. | Not studied | |
| 5FU (n = 64) versus 5FU/cyclophosphamide/methotrexate 'Mallinson Regimen' (n = 61) versus 5FU/doxorubicin/cisplatin 'FAP' (n = 59) | OS: 3.5 vs 4.5 vs 3.5 months respectively PFS: 2.5 vs 2.5 vs 2.5 months | 7% vs 21% vs 15% | More AEs reported in the combination arms compared with 5FU alone | Not studied | |
| Gemcitabine (fixed dose rate) (n = 64) versus infusional gemcitabine + cisplatin (n = 66) versus infusional gemcitabine + docetaxel (n = 65) versus infusional gemcitabine + irinotecan (n = 60) | OS: 6.4 vs 6.7 vs 6.4 vs 7.1 months, respectively. Time to progression: 3.3 vs 4.5 vs 4.1 vs 4.0 months | 14 vs 12.5 vs 12 vs 14% | Neutropenia and fatigue most common AE and same in all groups | Not studied | |
| Other studies | |||||
| Gemcitabine/oxaliplatin (n = 20) vs simplified gemcitabine/oxaliplatin (n = 37) | OS: 3.2 vs 7.6 months PFS: 2.5 vs 4.0 months | PR: 10% vs 27% SbD: 45% vs 43% | Peripheral neuropathy more common in the simplified GemOx arm | Not studied | |
| Mitomycin C/5FU (MF) (n = 73) vs Streptozocin/mitomycin C/5FU (SMF) (n = 72) | OS: 17 vs 18 weeks | PR: 8% v 34% | More gastrointestinal and renal toxicity in the SMF arm | Not studied | |
| Standard nab‐paclitaxel and gemcitabine (n = 75) vs sequential nab‐paclitaxel and gemcitabine (n = 71) | OS: 7.9 vs 10.1 months (HR 0.88) PFS: 4.0 vs 5.8 months (HR 0.66) | PR: 33% vs 50% SbD: 28% vs 42% | Neutropenia more common in the sequential arm | QoL score dropped by −12.1 points at 24 weeks in the standard arm vs −2.1 in the sequential arm | |
| Gemcitabine 3‐week schedule (n = 45) vs gemcitabine 4‐week schedule (n = 45) | OS: 250 vs 206 days PFS: 114 vs 112 days | 17.1% vs 14.2% | Thrombocytopenia more common in the 4‐week schedule | Not studied | |
| Streptozocin/mitomycin C/5FU (SMF) (n = 42) vs cisplatin/ara‐C/caffeine (CAC) (n = 40) | OS: 10 vs 5 months | 10% vs 6% | Nausea and vomiting more common in CAC arm. | Not studied | |
| 5FU constant infusion vs 5FU constant infusion/cisplatin versus 5FU chronomodulated infusion vs 5FU chronomodulated infusion/cisplatin (no cisplatin n = 55, with cisplatin n = 52) | OS: 5.4 vs 8.3 months (no cis vs cis) OS: 6.1 vs 6.7 months (continuous vs chronomodulated) PFS: 2.1 vs 3.2 months | Not reported | Cisplatin increased rates of haematological AEs. Chronomodulated regimen increased rates of mucositis | Not studied | |
| Gemcitabine + docetaxel (n = 49) vs cisplatin + docetaxel (n = 47) | OS: 7.0 vs 7.5 months PFS: 3.9 vs 2.8 months | 19.4% vs 23.5% | Febile neutropenia more common in the cisplatin/docetaxel arm | Not studied | |
| Streptozocin + 5FU (n = 40) vs streptozocin + cyclophosphamide (n = 48) | OS: 13 vs 9 weeks | CR: 3 vs 6 PR: 2 vs 0 SbD: 9 vs 9 | Haematological AEs more common in the cyclophosphamide arm | Not studied | |
| Capecitabine + cisplatin + gemcitabine + docetaxel (PDXG) (n = 53) vs capecitabine + cisplatin + gemcitabine + epirubicin (PEXG) (n = 52) | OS: 10.7 vs 11 months PFS: 7.4 vs 7.6 months | CR: 2 vs 4% PR: 58 vs 33% | Neutropenia more common in the PEXG arm | Not studied | |
| Epirubicin (n = 32) vs 5FU + epirubicin + mitomycin C (n = 30) | 1 year survival rates 15.4 vs 23.2% | 8% vs 11% | AEs were similar in both arms | Not studied | |
| 5FU: fluorouracil; AE: adverse event; CR: complete response; OS: overall survival; PC: pancreatic cancer; PR: partial response; SbD: stable disease. | |||||
| Outcome or subgroup title | No. of studies | No. of participants | Statistical method | Effect size |
| 1 Overall survival Show forest plot | 4 | 298 | Hazard Ratio (Random, 95% CI) | 1.08 [0.88, 1.33] |
| Outcome or subgroup title | No. of studies | No. of participants | Statistical method | Effect size |
| 1 Overall survival Show forest plot | 8 | Hazard Ratio (Random, 95% CI) | Subtotals only | |
| 1.1 5‐FU | 1 | 126 | Hazard Ratio (Random, 95% CI) | 1.69 [1.26, 2.27] |
| 1.2 FOLFIRINOX | 2 | 652 | Hazard Ratio (Random, 95% CI) | 0.51 [0.43, 0.60] |
| 1.3 CO‐101 | 1 | 367 | Hazard Ratio (Random, 95% CI) | 1.07 [0.86, 1.34] |
| 1.4 ZD9331 | 1 | 55 | Hazard Ratio (Random, 95% CI) | 0.86 [0.42, 1.76] |
| 1.5 Fixed dose rate gemcitabine | 2 | 644 | Hazard Ratio (Random, 95% CI) | 0.79 [0.66, 0.94] |
| 1.6 Exatecan | 1 | 339 | Hazard Ratio (Random, 95% CI) | 1.27 [0.96, 1.68] |
| 2 Progression‐free survival Show forest plot | 5 | Hazard Ratio (Random, 95% CI) | Subtotals only | |
| 2.1 5‐FU | 1 | 126 | Hazard Ratio (Random, 95% CI) | 1.47 [1.12, 1.92] |
| 2.2 FOLFIRINOX | 2 | 652 | Hazard Ratio (Random, 95% CI) | 0.46 [0.38, 0.57] |
| 2.3 ZD9331 | 1 | 55 | Hazard Ratio (Random, 95% CI) | 0.78 [0.46, 1.32] |
| 2.4 Fixed dose rate gemcitabine | 1 | 552 | Hazard Ratio (Random, 95% CI) | 0.88 [0.77, 1.01] |
| 3 Degradation of QoL at 6 months Show forest plot | 2 | Hazard Ratio (Random, 95% CI) | 0.46 [0.35, 0.61] | |
| 4 Response rates Show forest plot | 7 | Risk Ratio (M‐H, Random, 95% CI) | Subtotals only | |
| 4.1 5‐FU | 1 | 126 | Risk Ratio (M‐H, Random, 95% CI) | 0.14 [0.01, 2.71] |
| 4.2 FOLFIRINOX | 1 | 342 | Risk Ratio (M‐H, Random, 95% CI) | 3.38 [2.01, 5.65] |
| 4.3 CO‐101 | 1 | 358 | Risk Ratio (M‐H, Random, 95% CI) | 0.67 [0.43, 1.04] |
| 4.4 ZD9331 | 1 | 55 | Risk Ratio (M‐H, Random, 95% CI) | 0.42 [0.04, 4.33] |
| 4.5 Fixed dose rate gemcitabine | 2 | 644 | Risk Ratio (M‐H, Random, 95% CI) | 1.59 [0.91, 2.79] |
| 4.6 Exatecan (DX‐8951f) | 1 | 276 | Risk Ratio (M‐H, Random, 95% CI) | 0.10 [0.01, 0.78] |
| 5 Grade 3/4 anaemia Show forest plot | 7 | Risk Ratio (M‐H, Random, 95% CI) | Subtotals only | |
| 5.1 5‐FU | 1 | 126 | Risk Ratio (M‐H, Random, 95% CI) | 0.08 [0.00, 1.34] |
| 5.2 FOLFIRINOX | 1 | 342 | Risk Ratio (M‐H, Random, 95% CI) | 1.3 [0.59, 2.88] |
| 5.3 CO‐101 | 1 | 360 | Risk Ratio (M‐H, Random, 95% CI) | 1.01 [0.59, 1.73] |
| 5.4 ZD9331 | 1 | 55 | Risk Ratio (M‐H, Random, 95% CI) | 0.28 [0.01, 6.58] |
| 5.5 Fixed dose rate gemcitabine | 2 | 644 | Risk Ratio (M‐H, Random, 95% CI) | 1.79 [1.22, 2.63] |
| 5.6 Exatecan | 1 | 330 | Risk Ratio (M‐H, Random, 95% CI) | 1.0 [0.43, 2.34] |
| 6 Grade 3/4 neutropenia Show forest plot | 7 | Risk Ratio (M‐H, Random, 95% CI) | Subtotals only | |
| 6.1 5‐FU | 1 | 126 | Risk Ratio (M‐H, Random, 95% CI) | 0.19 [0.06, 0.61] |
| 6.2 FOLFIRINOX | 1 | 342 | Risk Ratio (M‐H, Random, 95% CI) | 2.14 [1.52, 3.01] |
| 6.3 CO‐101 | 1 | 360 | Risk Ratio (M‐H, Random, 95% CI) | 1.31 [0.83, 2.07] |
| 6.4 ZD9331 | 1 | 55 | Risk Ratio (M‐H, Random, 95% CI) | 4.17 [0.52, 33.37] |
| 6.5 Fixed dose rate gemcitabine | 2 | 644 | Risk Ratio (M‐H, Random, 95% CI) | 1.85 [1.53, 2.23] |
| 6.6 Exatecan | 1 | 330 | Risk Ratio (M‐H, Random, 95% CI) | 1.0 [0.64, 1.55] |
| 7 Grade 3/4 thrombocytopenia Show forest plot | 7 | Risk Ratio (M‐H, Random, 95% CI) | Subtotals only | |
| 7.1 5‐FU | 1 | 126 | Risk Ratio (M‐H, Random, 95% CI) | 0.17 [0.02, 1.34] |
| 7.2 FOLFIRINOX | 1 | 342 | Risk Ratio (M‐H, Random, 95% CI) | 2.5 [0.99, 6.29] |
| 7.3 CO‐101 | 1 | 360 | Risk Ratio (M‐H, Random, 95% CI) | 1.10 [0.51, 2.34] |
| 7.4 ZD9331 | 1 | 55 | Risk Ratio (M‐H, Random, 95% CI) | 3.33 [0.40, 27.94] |
| 7.5 Fixed dose rate gemcitabine | 2 | 644 | Risk Ratio (M‐H, Random, 95% CI) | 2.77 [1.99, 3.86] |
| 7.6 Exatecan | 1 | 330 | Risk Ratio (M‐H, Random, 95% CI) | 0.75 [0.37, 1.54] |
| 8 Grade 3/4 nausea Show forest plot | 5 | Risk Ratio (M‐H, Random, 95% CI) | Subtotals only | |
| 8.1 5‐FU | 1 | 126 | Risk Ratio (M‐H, Random, 95% CI) | 0.38 [0.10, 1.35] |
| 8.2 ZD9331 | 1 | 55 | Risk Ratio (M‐H, Random, 95% CI) | 2.52 [0.11, 59.18] |
| 8.3 Fixed dose rate gemcitabine | 2 | 644 | Risk Ratio (M‐H, Random, 95% CI) | 1.52 [0.94, 2.46] |
| 8.4 Exatecan | 1 | 330 | Risk Ratio (M‐H, Random, 95% CI) | 1.75 [0.52, 5.86] |
| 9 Grade 3/4 diarrhoea Show forest plot | 4 | Risk Ratio (M‐H, Random, 95% CI) | Subtotals only | |
| 9.1 5‐FU | 1 | 126 | Risk Ratio (M‐H, Random, 95% CI) | 3.0 [0.32, 28.07] |
| 9.2 ZD9331 | 1 | 55 | Risk Ratio (M‐H, Random, 95% CI) | 0.28 [0.01, 6.58] |
| 9.3 Fixed dose rate gemcitabine | 2 | 644 | Risk Ratio (M‐H, Random, 95% CI) | 0.44 [0.16, 1.23] |
| Outcome or subgroup title | No. of studies | No. of participants | Statistical method | Effect size |
| 1 Overall survival Show forest plot | 26 | Hazard Ratio (Random, 95% CI) | Subtotals only | |
| 1.1 Gemcitabine plus platinum agent | 6 | 1140 | Hazard Ratio (Random, 95% CI) | 0.94 [0.81, 1.08] |
| 1.2 Gemcitabine plus fluoropyrimidine | 10 | 2718 | Hazard Ratio (Random, 95% CI) | 0.88 [0.81, 0.95] |
| 1.3 Gemcitabine plus topoisomerase inhibitor | 3 | 839 | Hazard Ratio (Random, 95% CI) | 1.01 [0.87, 1.16] |
| 1.4 Gemcitabine plus taxane | 1 | 861 | Hazard Ratio (Random, 95% CI) | 0.72 [0.62, 0.84] |
| 1.5 Gemcitabine plus other combinations of chemotherapy | 2 | 166 | Hazard Ratio (Random, 95% CI) | 0.55 [0.39, 0.79] |
| 1.6 Gemcitabine plus other agent(s) | 4 | 767 | Hazard Ratio (Random, 95% CI) | 0.79 [0.56, 1.10] |
| 2 Progression‐free survival Show forest plot | 18 | Hazard Ratio (Random, 95% CI) | Subtotals only | |
| 2.1 Gemcitabine plus platinum agent | 4 | 1015 | Hazard Ratio (Random, 95% CI) | 0.80 [0.68, 0.95] |
| 2.2 Gemcitabine plus fluoropyrimidine | 8 | 2608 | Hazard Ratio (Random, 95% CI) | 0.79 [0.72, 0.87] |
| 2.3 Gemcitabine plus topoisomerase inhibitor | 2 | 709 | Hazard Ratio (Random, 95% CI) | 0.91 [0.78, 1.07] |
| 2.4 Gemcitabine plus taxane | 1 | 861 | Hazard Ratio (Random, 95% CI) | 0.69 [0.58, 0.82] |
| 2.5 Gemcitabine plus other combinations of chemotherapy | 2 | 166 | Hazard Ratio (Random, 95% CI) | 0.43 [0.30, 0.62] |
| 2.6 Gemcitabine plus other agent(s) | 1 | 76 | Hazard Ratio (Random, 95% CI) | 1.05 [0.68, 1.62] |
| 3 Response rates Show forest plot | 24 | Risk Ratio (M‐H, Random, 95% CI) | Subtotals only | |
| 3.1 Gemcitabine plus platinum agent | 7 | 1186 | Risk Ratio (M‐H, Random, 95% CI) | 1.48 [1.11, 1.98] |
| 3.2 Gemcitabine plus fluoropyrimidine | 9 | 2176 | Risk Ratio (M‐H, Random, 95% CI) | 1.78 [1.29, 2.47] |
| 3.3 Gemcitabine plus topoisomerase inhibitor | 3 | 729 | Risk Ratio (M‐H, Random, 95% CI) | 1.50 [0.92, 2.46] |
| 3.4 Gemcitabine plus taxane | 1 | 861 | Risk Ratio (M‐H, Random, 95% CI) | 3.29 [2.24, 4.84] |
| 3.5 Gemcitabane plus other combinations of chemotherapy | 1 | 67 | Risk Ratio (M‐H, Random, 95% CI) | 1.94 [0.83, 4.56] |
| 3.6 Gemcitabine plus other agent(s) | 3 | 691 | Risk Ratio (M‐H, Random, 95% CI) | 3.66 [1.04, 12.82] |
| 4 Grade 3/4 anaemia Show forest plot | 23 | Risk Ratio (M‐H, Random, 95% CI) | Subtotals only | |
| 4.1 Gemcitabine plus platinum agent | 7 | 1156 | Risk Ratio (M‐H, Random, 95% CI) | 1.41 [0.87, 2.31] |
| 4.2 Gemcitabine plus fluoropyrimidine | 8 | 2158 | Risk Ratio (M‐H, Random, 95% CI) | 1.11 [0.84, 1.45] |
| 4.3 Gemcitabine plus topoisomerase inhibitor | 3 | 797 | Risk Ratio (M‐H, Random, 95% CI) | 1.09 [0.72, 1.66] |
| 4.4 Gemcitabine plus taxane | 1 | 793 | Risk Ratio (M‐H, Random, 95% CI) | 1.06 [0.73, 1.52] |
| 4.5 Gemcitabine plus other combinations of chemotherapy | 1 | 67 | Risk Ratio (M‐H, Random, 95% CI) | 1.94 [0.53, 7.13] |
| 4.6 Gemcitabine plus other agent(s) | 3 | 688 | Risk Ratio (M‐H, Random, 95% CI) | 3.58 [1.93, 6.62] |
| 5 Grade 3/4 neutropenia Show forest plot | 23 | Risk Ratio (M‐H, Random, 95% CI) | Subtotals only | |
| 5.1 Gemcitabine plus platinum agent | 6 | 961 | Risk Ratio (M‐H, Random, 95% CI) | 1.34 [0.90, 1.97] |
| 5.2 Gemcitabine plus fluoropyrimidine | 9 | 2177 | Risk Ratio (M‐H, Random, 95% CI) | 1.53 [1.34, 1.74] |
| 5.3 Gemcitabine plus topoisomerase inhibitor | 3 | 797 | Risk Ratio (M‐H, Random, 95% CI) | 1.54 [1.04, 2.30] |
| 5.4 Gemcitabine plus taxane | 1 | 793 | Risk Ratio (M‐H, Random, 95% CI) | 1.42 [1.16, 1.75] |
| 5.5 Gemcitabine plus other combinations of chemotherapy | 1 | 67 | Risk Ratio (M‐H, Random, 95% CI) | 1.94 [0.65, 5.83] |
| 5.6 Gemcitabine plus other agent(s) | 3 | 688 | Risk Ratio (M‐H, Random, 95% CI) | 2.02 [0.88, 4.66] |
| 6 Grade 3/4 thrombocytopenia Show forest plot | 23 | Risk Ratio (M‐H, Random, 95% CI) | Subtotals only | |
| 6.1 Gemcitabine plus platinum agent | 6 | 1110 | Risk Ratio (M‐H, Random, 95% CI) | 1.96 [1.00, 3.84] |
| 6.2 Gemcitabine plus fluoropyrimidine | 9 | 2177 | Risk Ratio (M‐H, Random, 95% CI) | 1.48 [1.00, 2.18] |
| 6.3 Gemcitabine plus topoisomerase inhibitor | 3 | 797 | Risk Ratio (M‐H, Random, 95% CI) | 2.28 [0.97, 5.36] |
| 6.4 Gemcitabine plus taxane | 1 | 793 | Risk Ratio (M‐H, Random, 95% CI) | 1.38 [0.93, 2.07] |
| 6.5 Gemcitabine plus other combinations of chemotherapy | 1 | 67 | Risk Ratio (M‐H, Random, 95% CI) | 1.94 [0.74, 5.07] |
| 6.6 Gemcitabine plus other agent(s) | 3 | 688 | Risk Ratio (M‐H, Random, 95% CI) | 1.41 [0.45, 4.39] |
| 7 Grade 3/4 nausea Show forest plot | 21 | Risk Ratio (M‐H, Random, 95% CI) | Subtotals only | |
| 7.1 Gemcitabine plus platinum agent | 6 | 1110 | Risk Ratio (M‐H, Random, 95% CI) | 2.28 [1.40, 3.71] |
| 7.2 Gemcitabine plus fluoropyrimidine | 7 | 2075 | Risk Ratio (M‐H, Random, 95% CI) | 1.27 [0.87, 1.84] |
| 7.3 Gemcitabine plus topoisomerase inhibitor | 3 | 797 | Risk Ratio (M‐H, Random, 95% CI) | 1.55 [0.94, 2.55] |
| 7.4 Gemcitabine plus other combinations of chemotherapy | 1 | 67 | Risk Ratio (M‐H, Random, 95% CI) | 10.69 [0.61, 185.91] |
| 7.5 Gemcitabine plus other agent(s) | 4 | 748 | Risk Ratio (M‐H, Random, 95% CI) | 1.25 [0.48, 3.26] |
| 8 Grade 3/4 diarrhoea Show forest plot | 17 | Risk Ratio (M‐H, Random, 95% CI) | Subtotals only | |
| 8.1 Gemcitabine plus platinum agent | 6 | 1110 | Risk Ratio (M‐H, Random, 95% CI) | 1.48 [0.62, 3.53] |
| 8.2 Gemcitabine plus fluoropyrimidine | 8 | 2087 | Risk Ratio (M‐H, Random, 95% CI) | 2.16 [1.34, 3.47] |
| 8.3 Gemcitabine plus topoisomerase inhibitor | 3 | 797 | Risk Ratio (M‐H, Random, 95% CI) | 3.47 [0.74, 16.33] |
| 9 Grade 3/4 neuropathy Show forest plot | 1 | Risk Ratio (M‐H, Random, 95% CI) | Subtotals only | |
| 9.1 Gemcitabine plus taxane | 1 | 793 | Risk Ratio (M‐H, Random, 95% CI) | 22.35 [7.10, 70.40] |
| 10 Grade 3/4 fatigue Show forest plot | 1 | Risk Ratio (M‐H, Random, 95% CI) | Subtotals only | |
| 10.1 Gemcitabine plus taxane | 1 | 793 | Risk Ratio (M‐H, Random, 95% CI) | 2.48 [1.63, 3.79] |
| Outcome or subgroup title | No. of studies | No. of participants | Statistical method | Effect size |
| 1 Overall survival Show forest plot | 4 | 491 | Hazard Ratio (Random, 95% CI) | 0.84 [0.61, 1.15] |
| 2 Progression‐free survival Show forest plot | 2 | 255 | Hazard Ratio (Random, 95% CI) | 0.52 [0.19, 1.38] |
| 3 Response rates Show forest plot | 4 | 410 | Risk Ratio (M‐H, Random, 95% CI) | 1.18 [0.52, 2.68] |
| 4 Grade 3/4 anaemia Show forest plot | 2 | 255 | Risk Ratio (M‐H, Random, 95% CI) | 0.48 [0.06, 3.62] |
| 5 Grade 3/4 neutropenia Show forest plot | 2 | 255 | Risk Ratio (M‐H, Random, 95% CI) | 5.70 [0.73, 44.46] |
| 6 Grade 3/4 thrombocytopenia Show forest plot | 2 | 255 | Risk Ratio (M‐H, Random, 95% CI) | 1.40 [0.34, 5.80] |
| 7 Grade 3/4 fatigue Show forest plot | 1 | 209 | Risk Ratio (M‐H, Random, 95% CI) | 0.91 [0.58, 1.43] |
| 8 Grade 3/4 nausea Show forest plot | 2 | 255 | Risk Ratio (M‐H, Random, 95% CI) | 1.06 [0.32, 3.53] |
| 9 Grade 3/4 diarrhoea Show forest plot | 2 | 255 | Risk Ratio (M‐H, Random, 95% CI) | 0.92 [0.31, 2.78] |