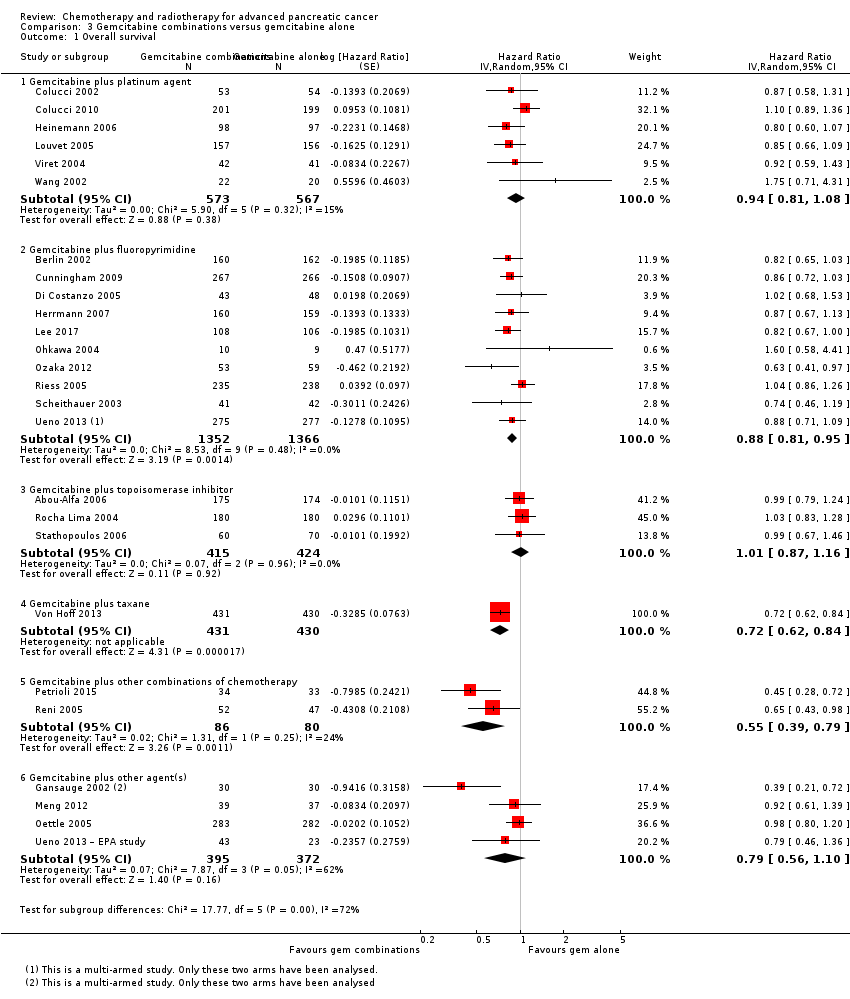
| 1 Overall survival Show forest plot | 26 | | Hazard Ratio (Random, 95% CI) | Subtotals only |
|
| 1.1 Gemcitabine plus platinum agent | 6 | 1140 | Hazard Ratio (Random, 95% CI) | 0.94 [0.81, 1.08] |
| 1.2 Gemcitabine plus fluoropyrimidine | 10 | 2718 | Hazard Ratio (Random, 95% CI) | 0.88 [0.81, 0.95] |
| 1.3 Gemcitabine plus topoisomerase inhibitor | 3 | 839 | Hazard Ratio (Random, 95% CI) | 1.01 [0.87, 1.16] |
| 1.4 Gemcitabine plus taxane | 1 | 861 | Hazard Ratio (Random, 95% CI) | 0.72 [0.62, 0.84] |
| 1.5 Gemcitabine plus other combinations of chemotherapy | 2 | 166 | Hazard Ratio (Random, 95% CI) | 0.55 [0.39, 0.79] |
| 1.6 Gemcitabine plus other agent(s) | 4 | 767 | Hazard Ratio (Random, 95% CI) | 0.79 [0.56, 1.10] |
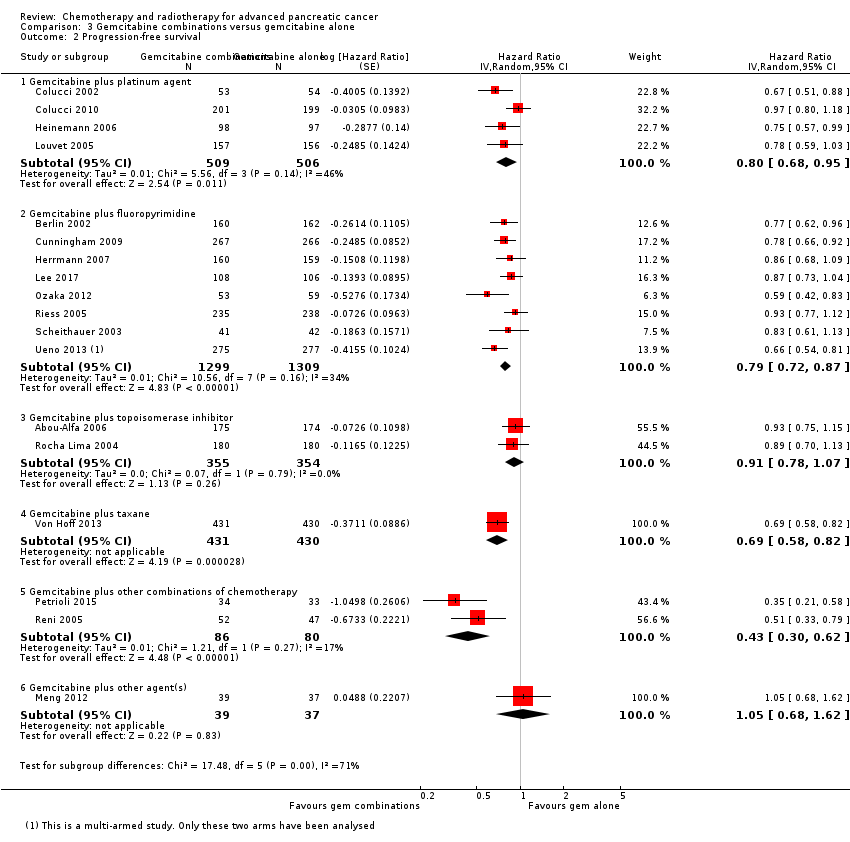
| 2 Progression‐free survival Show forest plot | 18 | | Hazard Ratio (Random, 95% CI) | Subtotals only |
|
| 2.1 Gemcitabine plus platinum agent | 4 | 1015 | Hazard Ratio (Random, 95% CI) | 0.80 [0.68, 0.95] |
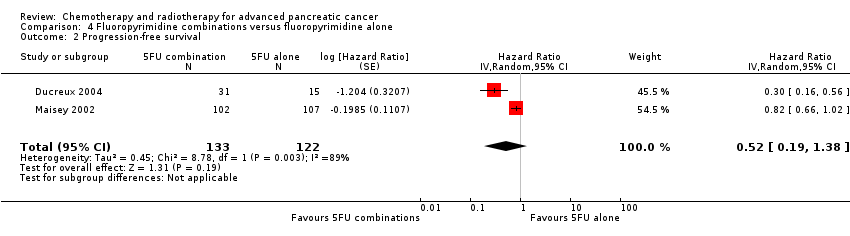
| 2.2 Gemcitabine plus fluoropyrimidine | 8 | 2608 | Hazard Ratio (Random, 95% CI) | 0.79 [0.72, 0.87] |
| 2.3 Gemcitabine plus topoisomerase inhibitor | 2 | 709 | Hazard Ratio (Random, 95% CI) | 0.91 [0.78, 1.07] |
| 2.4 Gemcitabine plus taxane | 1 | 861 | Hazard Ratio (Random, 95% CI) | 0.69 [0.58, 0.82] |
| 2.5 Gemcitabine plus other combinations of chemotherapy | 2 | 166 | Hazard Ratio (Random, 95% CI) | 0.43 [0.30, 0.62] |
| 2.6 Gemcitabine plus other agent(s) | 1 | 76 | Hazard Ratio (Random, 95% CI) | 1.05 [0.68, 1.62] |
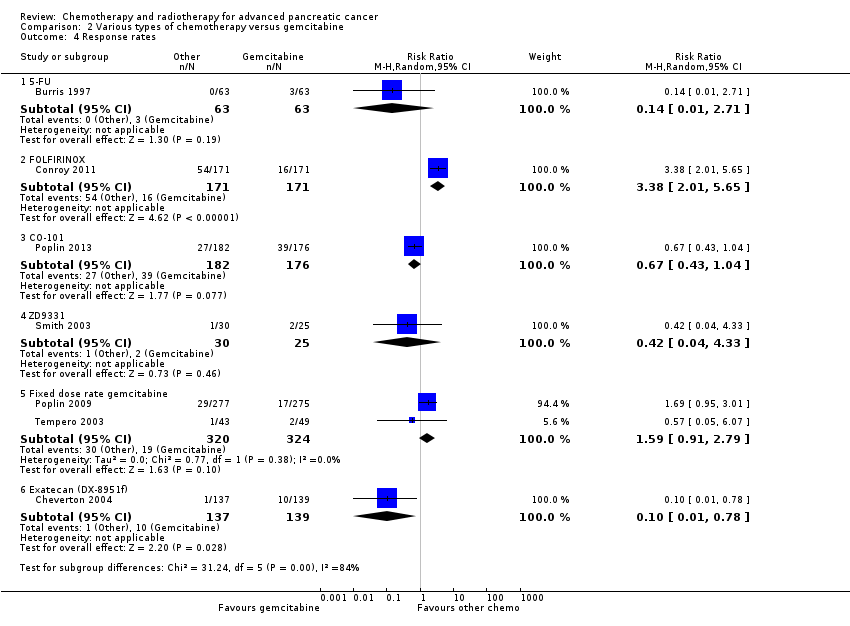
| 3 Response rates Show forest plot | 24 | | Risk Ratio (M‐H, Random, 95% CI) | Subtotals only |
|
| 3.1 Gemcitabine plus platinum agent | 7 | 1186 | Risk Ratio (M‐H, Random, 95% CI) | 1.48 [1.11, 1.98] |
| 3.2 Gemcitabine plus fluoropyrimidine | 9 | 2176 | Risk Ratio (M‐H, Random, 95% CI) | 1.78 [1.29, 2.47] |
| 3.3 Gemcitabine plus topoisomerase inhibitor | 3 | 729 | Risk Ratio (M‐H, Random, 95% CI) | 1.50 [0.92, 2.46] |
| 3.4 Gemcitabine plus taxane | 1 | 861 | Risk Ratio (M‐H, Random, 95% CI) | 3.29 [2.24, 4.84] |
| 3.5 Gemcitabane plus other combinations of chemotherapy | 1 | 67 | Risk Ratio (M‐H, Random, 95% CI) | 1.94 [0.83, 4.56] |
| 3.6 Gemcitabine plus other agent(s) | 3 | 691 | Risk Ratio (M‐H, Random, 95% CI) | 3.66 [1.04, 12.82] |
| 4 Grade 3/4 anaemia Show forest plot | 23 | | Risk Ratio (M‐H, Random, 95% CI) | Subtotals only |
|
| 4.1 Gemcitabine plus platinum agent | 7 | 1156 | Risk Ratio (M‐H, Random, 95% CI) | 1.41 [0.87, 2.31] |
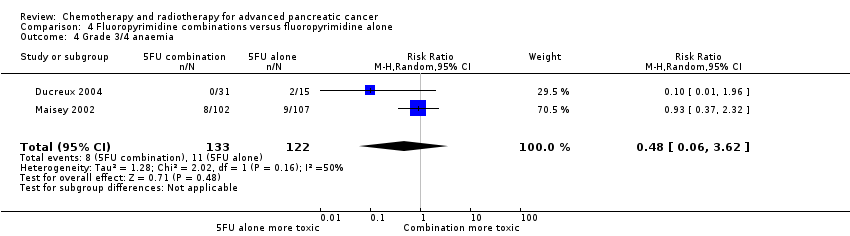
| 4.2 Gemcitabine plus fluoropyrimidine | 8 | 2158 | Risk Ratio (M‐H, Random, 95% CI) | 1.11 [0.84, 1.45] |
| 4.3 Gemcitabine plus topoisomerase inhibitor | 3 | 797 | Risk Ratio (M‐H, Random, 95% CI) | 1.09 [0.72, 1.66] |
| 4.4 Gemcitabine plus taxane | 1 | 793 | Risk Ratio (M‐H, Random, 95% CI) | 1.06 [0.73, 1.52] |
| 4.5 Gemcitabine plus other combinations of chemotherapy | 1 | 67 | Risk Ratio (M‐H, Random, 95% CI) | 1.94 [0.53, 7.13] |
| 4.6 Gemcitabine plus other agent(s) | 3 | 688 | Risk Ratio (M‐H, Random, 95% CI) | 3.58 [1.93, 6.62] |
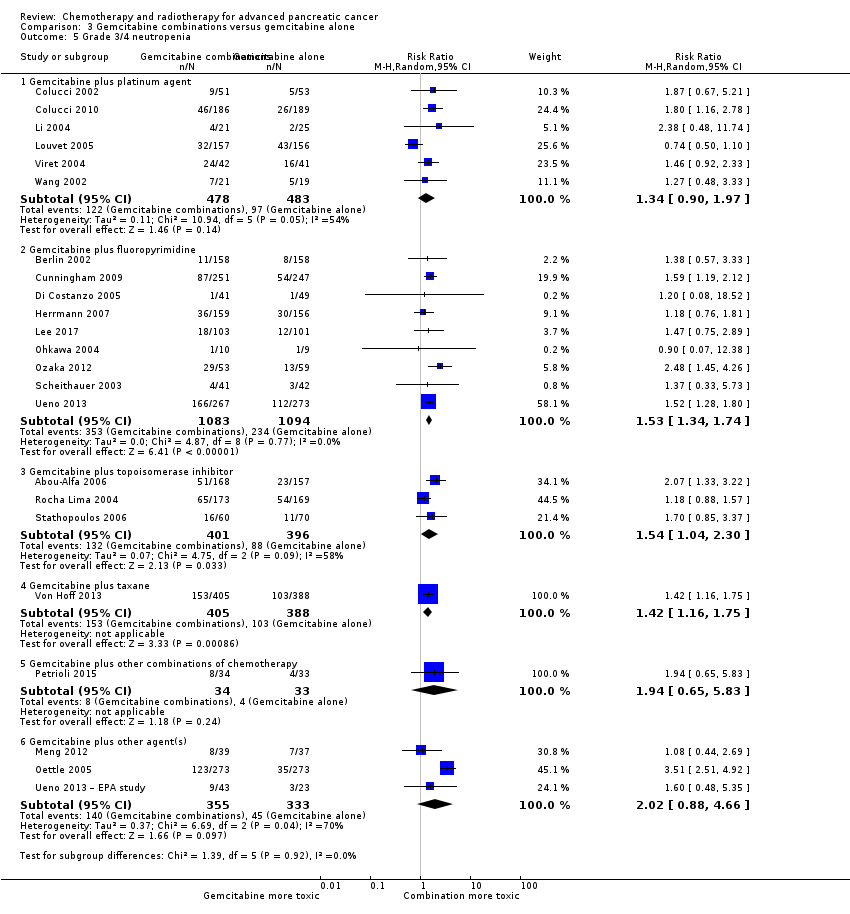
| 5 Grade 3/4 neutropenia Show forest plot | 23 | | Risk Ratio (M‐H, Random, 95% CI) | Subtotals only |
|
| 5.1 Gemcitabine plus platinum agent | 6 | 961 | Risk Ratio (M‐H, Random, 95% CI) | 1.34 [0.90, 1.97] |
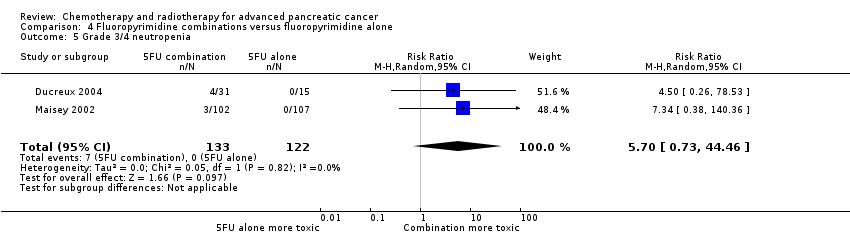
| 5.2 Gemcitabine plus fluoropyrimidine | 9 | 2177 | Risk Ratio (M‐H, Random, 95% CI) | 1.53 [1.34, 1.74] |
| 5.3 Gemcitabine plus topoisomerase inhibitor | 3 | 797 | Risk Ratio (M‐H, Random, 95% CI) | 1.54 [1.04, 2.30] |
| 5.4 Gemcitabine plus taxane | 1 | 793 | Risk Ratio (M‐H, Random, 95% CI) | 1.42 [1.16, 1.75] |
| 5.5 Gemcitabine plus other combinations of chemotherapy | 1 | 67 | Risk Ratio (M‐H, Random, 95% CI) | 1.94 [0.65, 5.83] |
| 5.6 Gemcitabine plus other agent(s) | 3 | 688 | Risk Ratio (M‐H, Random, 95% CI) | 2.02 [0.88, 4.66] |
| 6 Grade 3/4 thrombocytopenia Show forest plot | 23 | | Risk Ratio (M‐H, Random, 95% CI) | Subtotals only |
|
| 6.1 Gemcitabine plus platinum agent | 6 | 1110 | Risk Ratio (M‐H, Random, 95% CI) | 1.96 [1.00, 3.84] |
| 6.2 Gemcitabine plus fluoropyrimidine | 9 | 2177 | Risk Ratio (M‐H, Random, 95% CI) | 1.48 [1.00, 2.18] |
| 6.3 Gemcitabine plus topoisomerase inhibitor | 3 | 797 | Risk Ratio (M‐H, Random, 95% CI) | 2.28 [0.97, 5.36] |
| 6.4 Gemcitabine plus taxane | 1 | 793 | Risk Ratio (M‐H, Random, 95% CI) | 1.38 [0.93, 2.07] |
| 6.5 Gemcitabine plus other combinations of chemotherapy | 1 | 67 | Risk Ratio (M‐H, Random, 95% CI) | 1.94 [0.74, 5.07] |
| 6.6 Gemcitabine plus other agent(s) | 3 | 688 | Risk Ratio (M‐H, Random, 95% CI) | 1.41 [0.45, 4.39] |
| 7 Grade 3/4 nausea Show forest plot | 21 | | Risk Ratio (M‐H, Random, 95% CI) | Subtotals only |
|
| 7.1 Gemcitabine plus platinum agent | 6 | 1110 | Risk Ratio (M‐H, Random, 95% CI) | 2.28 [1.40, 3.71] |
| 7.2 Gemcitabine plus fluoropyrimidine | 7 | 2075 | Risk Ratio (M‐H, Random, 95% CI) | 1.27 [0.87, 1.84] |
| 7.3 Gemcitabine plus topoisomerase inhibitor | 3 | 797 | Risk Ratio (M‐H, Random, 95% CI) | 1.55 [0.94, 2.55] |
| 7.4 Gemcitabine plus other combinations of chemotherapy | 1 | 67 | Risk Ratio (M‐H, Random, 95% CI) | 10.69 [0.61, 185.91] |
| 7.5 Gemcitabine plus other agent(s) | 4 | 748 | Risk Ratio (M‐H, Random, 95% CI) | 1.25 [0.48, 3.26] |
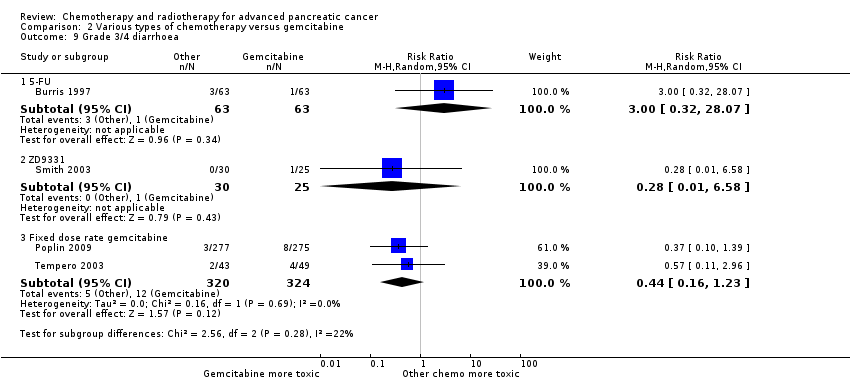
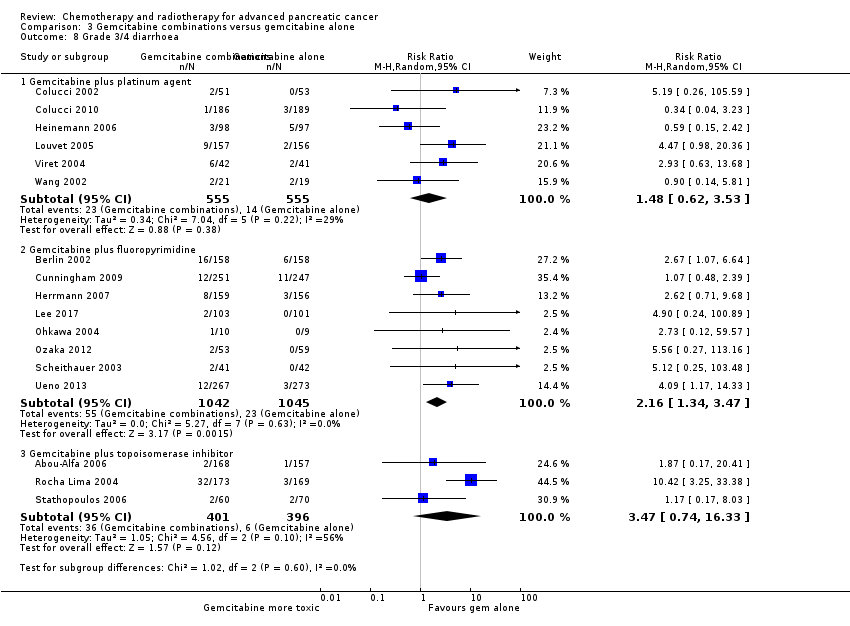
| 8 Grade 3/4 diarrhoea Show forest plot | 17 | | Risk Ratio (M‐H, Random, 95% CI) | Subtotals only |
|
| 8.1 Gemcitabine plus platinum agent | 6 | 1110 | Risk Ratio (M‐H, Random, 95% CI) | 1.48 [0.62, 3.53] |
| 8.2 Gemcitabine plus fluoropyrimidine | 8 | 2087 | Risk Ratio (M‐H, Random, 95% CI) | 2.16 [1.34, 3.47] |
| 8.3 Gemcitabine plus topoisomerase inhibitor | 3 | 797 | Risk Ratio (M‐H, Random, 95% CI) | 3.47 [0.74, 16.33] |
| 9 Grade 3/4 neuropathy Show forest plot | 1 | | Risk Ratio (M‐H, Random, 95% CI) | Subtotals only |
|
| 9.1 Gemcitabine plus taxane | 1 | 793 | Risk Ratio (M‐H, Random, 95% CI) | 22.35 [7.10, 70.40] |
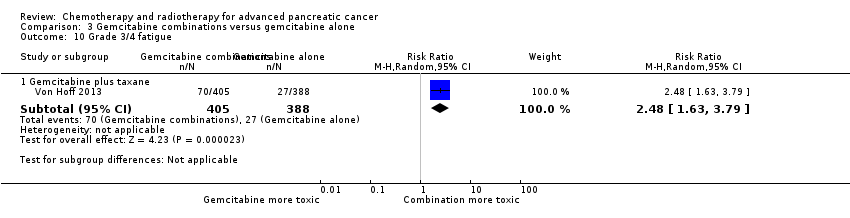
| 10 Grade 3/4 fatigue Show forest plot | 1 | | Risk Ratio (M‐H, Random, 95% CI) | Subtotals only |
|
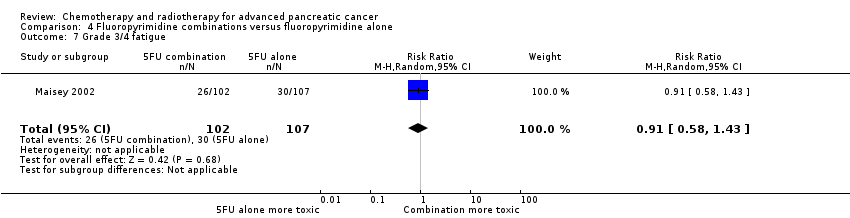
| 10.1 Gemcitabine plus taxane | 1 | 793 | Risk Ratio (M‐H, Random, 95% CI) | 2.48 [1.63, 3.79] |