化疗和放疗治疗晚期胰腺癌
摘要
研究背景
胰腺癌(pancreatic cancer, PC)是一种高度致命的疾病,几乎没有有效的治疗选择。在过去的几十年里,许多抗癌疗法已经在局部晚期和转移性的环境中进行了测试,结果喜忧参半。本系统综述试图综合所有可用的随机数据,以更好地为患者和临床医生在治疗这种疑难疾病做决策时提供信息。
研究目的
评价化疗、放疗或两者对胰腺癌晚期一线治疗的有效性。我们的主要结局为总体生存率、次要结局包括无进展生存期、3/4级不良事件、治疗反应和生活质量。
检索策略
我们在CENTRAL(2017年6月14日检索)、Embase(1980年至2017年6月14日)、MEDLINE(1946年至2017年6月14日)和CANCERLIT(1999年至2002年)数据库中检索了已发表和未发表的研究。我们也手工检索了截至2017年6月14日发表的所有相关的会议摘要。
纳入排除标准
所有的随机对照试验都评价了晚期胰腺导管腺癌患者总体生存率的结局。化疗和放疗,单独进行或联合进行,是合适的治疗方法。
资料收集与分析
两名系统综述作者独立分析了研究,还有第三位作者解决了许多争议。我们提取了有关总体生存率(overall survival, OS)、无进展生存期(progression‐free survival, PFS)、治疗反应率、不良事件(adverse events, AEs)和生活质量(quality of life, QoL)的数据,并评价了每项研究的偏倚风险。
主要结果
我们纳入了42项针对9463名晚期胰腺癌患者进行化疗的研究。我们没有发现任何符合条件的放疗研究。
我们没有发现化疗比最佳的支持性护理有任何益处。然而,两项已纳入的研究没有足够的数据以纳入分析,而且所研究的很多化疗方案已经过时。
与单独使用吉西他滨相比,接受5FU治疗的受试者的OS(HR=1.69, 95%CI [1.26, 2.27],中等质量证据)、PFS(HR=1.47, 95%CI [1.12, 1.92])和QoL更差。另一方面,两项研究显示FOLFIRINOX在OS(HR=0.51, 95%CI [0.43, 0.60],中等质量证据)、PFS(HR=0.46, 95%CI [0.38, 0.57])和治疗反应率(RR=3.38, 95%CI [2.01, 5.65])方面比吉西他滨效果更好,但是它也增加了副作用的发生率。与单独使用吉西他滨相比,评价了CO‐101、ZD9331和依沙替康的研究并未显示出其益处或伤害。
与单次用药的方式相比,以固定剂量率给予吉西他滨能够改善OS(HR=0.79, 95%CI [0.66, 0.94],高质量证据),但是会增加副作用的发生率。
当吉西他滨组合和单独使用吉西他滨相比时,吉西他滨加铂可以改善PFS(HR=0.80, 95%CI [0.68, 0.95])和治疗反应率(RR=1.48, 95%CI [1.11, 1.98]),但是OS并未改善(HR=0.94, 95%CI [0.81, 1.08],低质量证据)。副作用的发生率有所增加。吉西他滨加氟尿嘧啶改善了OS(HR=0.88, 95%CI [0.81, 0.95])、PFS(HR=0.79, 95%CI [0.72, 0.87])和治疗反应率(RR=1.78, 95%CI [1.29, 2.47],高质量证据),但是也会增加副作用的发生率。吉西他滨加拓扑异构酶抑制剂并未改善生存率的结局,但也确实增加了毒性。一项研究表明,吉西他滨加白蛋白结合型紫杉醇改善了OS(HR=0.72, 95%CI [0.62, 0.84],高质量证据)、PFS(HR=0.69, 95%CI [0.58, 0.82])和治疗反应率(RR=3.29, 95%CI [2.24, 4.84]),但是也增加了副作用的发生率。含有吉西他滨的多药组合(GEMOXEL或顺铂/表阿霉素/5FU/吉西他滨)改善了OS(HR=0.55, 95%CI [0.39, 0.79],低质量证据)、PFS(HR=0.43, 95%CI [0.30, 0.62])和QOL。
当5FU组合与单独使用5FU相比时,我们没有发现其在生存率方面有任何优势。
作者结论
联合化疗最近取代了长期使用的吉西他滨,成为治疗标准。FOLFIRINOX和吉西他滨加白蛋白结合型紫杉醇非常有效,但是我们的分析表明其他的联合用药方案也有益处。为个别患者选择最合适的化疗方法仍然很困难,临床病理分层仍难以捉摸。生物标志物的发展对于帮助患者合理选择治疗方法至关重要。
PICO
简语概要
抗癌治疗对晚期胰腺癌的影响
系统综述问题
本系统综述旨在回答此问题:哪些疗法对治疗晚期胰腺癌最有效?
系统综述背景
胰腺癌(pancreatic cancer, PC)是一种严重的、通常是致命的疾病,许多人直到肿瘤发展到不能通过手术切除时才被诊断出来。其症状包括腹痛、体重减轻以及皮肤和眼睛发黄。直到最近,吉西他滨还是治疗晚期胰腺癌的标准药物,但这也只能给人们带来有限的益处。
研究特征
我们寻找了所有与无法手术(局部晚期)或已经扩散到胰腺外(转移性)的胰腺癌患者有关的研究。我们发现了42项临床研究,涉及9463名接受了首次PC治疗的受试者。我们的检索截至2017年6月。
这些研究将一种疗法与最佳支持性护理(仅限症状管理)或另一种疗法进行了对比。研究必须评价总体生存率(或死亡时间)。该研究可以测试化疗(能够杀死或者延缓癌细胞生长的药物)或放疗(X射线治疗)的效果。我们收集了关于生存率、肿瘤反应率、副作用和生活质量的数据。针对局部晚期疾病的靶向/生物疗法、免疫疗法、二线疗法和局部疗法的临床研究结果将在另一项单独的Cochrane系统综述中报告。
主要研究结果
本系统综述表明,在晚期疾病中,相比于单独使用吉西他滨,FOLFIRINOX联合化疗 (5‐氟尿嘧啶、伊立替康、奥沙利铂联合用药);GEMOXEL(吉西他滨、奥沙利铂和卡培他滨);顺铂/表阿霉素/5FU/吉西他滨;吉西他滨加白蛋白结合型紫杉醇;和吉西他滨加氟嘧啶类药物在生存率方面有优势。但是这些用药组合也确实会增加副作用的发生率。使用固定速率缓慢给予吉西他滨可能比以标准方式给药更有效,而以标准方式给药能够在30分钟内快速完成。
证据质量
在这些进行比较的研究中,证据质量差异很大。最高质量的证据是吉西他滨与固定剂量率的吉西他滨和一些吉西他滨的用药组合(氟嘧啶、拓扑异构酶和紫杉醇)。我们根据研究的实施情况、报告研究结果的情况以及是否使用安慰剂等因素来判断研究的质量。
Authors' conclusions
Summary of findings
| Anti‐cancer therapy versus best supportive care for advanced pancreatic cancer | |||||||
| Person or population: advanced pancreatic cancer | |||||||
| Outcomes | Anticipated risk of death* (95% CI) | Relative effect | № of participants | Quality of the evidence | Comments | Toxicity and QoL | |
| Risk with best supportive care | Risk with anti‐cancer therapy | ||||||
| Overall survival | Study population | HR 1.08 | 298 | ⊕⊕⊕⊝ | — | The analysis showed that toxicity data were inconsistently reported. Most studies reporting this outcome noted that gastrointestinal adverse events were the most frequent, occurring in between 15% to 31%. 1 study noted haematological toxicity was present in 81.5% of people. 2 out of the 3 studies that analysed QoL demonstrated a benefit with anti‐cancer therapy. 1 study showed no difference between the 2 groups. | |
| 707 per 1000 | 734 per 1000 | ||||||
| *The risk in the intervention group (and its 95% confidence interval) is based on the assumed risk in the comparison group and the relative effect of the intervention (and its 95% CI). | |||||||
| GRADE Working Group grades of evidence | |||||||
| aConfidence interval include both benefit and harm; optimal information size not met. | |||||||
| Various types of chemotherapy versus gemcitabine for advanced pancreatic cancer | |||||||
| Person or population: advanced pancreatic cancer | |||||||
| Outcomes | Anticipated risk of death* (95% CI) | Relative effect | № of participants | Quality of the evidence | Comments | Toxicity and QoL | |
| Risk with gemcitabine | Risk with various types of chemotherapy | ||||||
| Overall survival ‐ 5FU | Study population | HR 1.69 | 126 | ⊕⊕⊕⊝ | Only 1 study | More toxicity was seen in the gemcitabine arm. Clinical benefit was improved in the gemcitabine arm | |
| 825 per 1000 | 948 per 1000 | ||||||
| Overall survival ‐ FOLFIRINOX | Study population | HR 0.51 | 652 | ⊕⊕⊕⊝ | — | More toxicity was seen in the FOLFIRINOX arm. Longer time to degradation of QoL in FOLFIRINOX arm | |
| 794 per 1000 | 554 per 1000 | ||||||
| Overall survival ‐ Fixed dose rate gemcitabine | Study population | HR 0.79 | 644 | ⊕⊕⊕⊕ | — | More toxicity in the fixed‐dose rate arm. QoL was not tested | |
| 880 per 1000 | 812 per 1000 | ||||||
| Overall survival ‐ CO‐101 | Study population | HR 1.07 | 367 | ⊕⊕⊕⊝ | Only 1 study | Toxicity was similar in both arms, QoL was not tested | |
| 854 per 1000 | 872 per 1000 | ||||||
| Overall survival ‐ ZD9331 | Study population | HR 0.86 | 55 | ⊕⊕⊕⊝ | Only 1 study | Toxicity was similar in both arms, QoL was not tested | |
| 560 per 1000 | 506 per 1000 | ||||||
| Overall survival ‐ Exatecan | Study population | HR 1.27 | 339 | ⊕⊕⊕⊝ | Only 1 study | Toxicity was similar in both arms, QoL was superior in the gemcitabine arm | |
| 776 per 1000 | 851 per 1000 | ||||||
| *The risk in the intervention group (and its 95% confidence interval) is based on the assumed risk in the comparison group and the relative effect of the intervention (and its 95% CI). | |||||||
| GRADE Working Group grades of evidence | |||||||
| aSmall sample size; optimal information size not met. | |||||||
| Gemcitabine combinations versus gemcitabine alone for advanced pancreatic cancer | |||||||
| Person or population: advanced pancreatic cancer | |||||||
| Outcomes | Anticipated risk of death* (95% CI) | Relative effect | № of participants | Quality of the evidence | Comments | Toxicity and QoL | |
| Risk with gemcitabine alone | Risk with gemcitabine combinations | ||||||
| Overall survival ‐ Gemcitabine plus platinum agent | Study population | HR 0.94 | 1140 | ⊕⊕⊝⊝ | — | More toxicity in the combination arm with no differences shown in QoL | |
| 705 per 1000 | 683 per 1000 | ||||||
| Overall survival ‐ Gemcitabine plus fluoropyrimidine | Study population | HR 0.89 | 2718 | ⊕⊕⊕⊕ | — | More toxicity in the combination arm. 2 studies showed no difference in QoL, 2 studies showed an improved QoL in the combination arm | |
| 690 per 1000 | 648 per 1000 | ||||||
| Overall survival ‐ Gemcitabine plus topoisomerase inhibitor | Study population | HR 1.01 | 839 | ⊕⊕⊕⊕ | — | More toxicity in the combination arm. In 1 study, QoL was not different between the 2 arms | |
| 800 per 1000 | 803 per 1000 | ||||||
| Overall survival ‐ Gemcitabine plus taxane | Study population | HR 0.72 | 861 | ⊕⊕⊕⊕ | 1 study only | More toxicity in the combination arm. QoL not measured | |
| 779 per 1000 | 663 per 1000 | ||||||
| Overall survival ‐ Gemcitabine plus other combinations of chemotherapy | Study population | HR 0.55 | 166 | ⊕⊕⊝⊝ | — | Toxicity measured in 1 study and was not different. QoL was shown to be improved in the combination arms in both studies | |
| 850 per 1000 | 648 per 1000 | ||||||
| Overall survival ‐ Gemcitabine plus other agent(s) | Study population | HR 0.79 | 767 | ⊕⊕⊝⊝ | There was an increase in anaemia in the combination arm. 2 studies measured QoL and it was similar in both treatment arms | ||
| 825 per 1000 | 748 per 1000 | ||||||
| *The risk in the intervention group (and its 95% confidence interval) is based on the assumed risk in the comparison group and the relative effect of the intervention (and its 95% CI). | |||||||
| GRADE Working Group grades of evidence | |||||||
| aTwo studies were in abstract form and could not have full assessment completed. | |||||||
| Fluoropyrimidine combinations versus fluoropyrimidine alone for advanced pancreatic cancer | ||||||
| Person or population: advanced pancreatic cancer | ||||||
| Outcomes | Anticipated risk of death* (95% CI) | Relative effect | № of participants | Quality of the evidence | Toxicity and QoL | |
| Risk with fluoropyrimidine alone | Risk with fluoropyrimidine combinations | |||||
| Overall survival | Study population | HR 0.84 | 491 | ⊕⊕⊝⊝ | Toxicity was not different between the 2 treatment arms. QoL was measured in 1 study and showed an improvement in the combination arm | |
| 838 per 1000 | 783 per 1000 | |||||
| *The risk in the intervention group (and its 95% confidence interval) is based on the assumed risk in the comparison group and the relative effect of the intervention (and its 95% CI). | ||||||
| GRADE Working Group grades of evidence | ||||||
| aHigh statistical heterogeneity. | ||||||
Background
Recently published global cancer statistics show that pancreatic cancer (PC) accounted for 184,400 deaths worldwide in 2012, with the highest incidence in men in high‐income countries at 8.6 cases per 100,000 (Torre 2015). In Australia, although PC is relatively uncommon (incidence of 11 per 100,000), it is highly lethal, representing the fourth leading cause of death from cancer (Tracey 2010). The US National Cancer Institute has reported a five‐year survival of 21.5% for those with localised disease (www.cancer.gov); however, a review of the Finnish Cancer Registry showed five‐year survival of only 4.3% for those with localised disease and an overall five‐year survival of 0.2% (Carpelan 2005).
PC is a notoriously insidious cancer, commonly presenting with vague, non‐specific symptoms that classically consist of the triad of epigastric abdominal pain, weight loss and jaundice (Howard 1977; Warshaw 1992), which gradually worsen over time. Physical examination is often normal, with the commonest sign of an enlarged liver present in fewer than half of patients (Von Hoff 2005). Thus, most patients have advanced disease when they are diagnosed.
Approximately 10% of early stage pancreatic carcinomas are amenable to curative surgery (Siegel 2013). However, the risk of relapse after surgical resection is still quite high, with only 10% of patients surviving for five years (Conlon 1996; Shahrudin 1997). Although studies have reported a benefit for chemotherapy in advanced disease (Burris 1997; Heinemann 2008; Conroy 2011; Von Hoff 2013), the role of second and subsequent lines of chemotherapy remains controversial (Nagrial 2015). The benefits of radiotherapy, either alone or in combination, as a palliative treatment for advanced or relapsed disease, is uncertain (Sultana 2007). Hammel 2013 tested contemporary chemotherapy and radiotherapy techniques but did not demonstrate a survival benefit in locally advanced disease. Biological therapies are emerging in the treatment of pancreatic cancer and but have yet to find their place in routine clinical practice (Castellanos 2011).
There are other published meta‐analyses that look at various aspects covered by this review. Li 2014 analysed eight studies that assessed randomised data using gemcitabine and fluoropyrimidine agents, finding a benefit using gemcitabine plus fluoropyrimidine. Petrelli 2014 analysed 29 studies that assessed gemcitabine monotherapy versus chemotherapy combinations, finding improved outcomes with the chemotherapy combinations. Two studies have used a Bayesian network meta‐analysis to perform direct and indirect comparisons of chemotherapy combinations (Chan 2014; Gresham 2014). Chan 2014 concluded that FOLFIRINOX was likely to be the most efficacious regimen in the advanced stage. Two meta‐analyses have assessed chemotherapy plus radiotherapy (Bernstein 2014; Chen 2013), both finding a small benefit to adding chemotherapy to radiation; however, neither included the recent study conducted by Hammel 2013.
Anti‐cancer therapies in the metastatic setting ideally aim to improve people's quality and length of life, with tolerable side effects. This review will analyse both the anti‐cancer effects and the adverse effects of treatments in patients with pancreatic cancer.
Description of the condition
Pancreatic ductal adenocarcinoma (PDAC) is a cancer arising from the ducts in the pancreas gland. It can be localised to the pancreas (local disease), locally advanced (still confined to the area around the pancreas but possibly involving lymph glands or other immediately adjacent structures) or metastatic (with cancer spread to distant areas).
This review includes studies in patients with locally advanced (not amenable to local therapies) or metastatic PC, formally defined as follows (Callery 2009).
-
Locally advanced or unresectable, defined by:
-
greater than 180° of superior mesenteric vein encasement, any coeliac abutment;
-
unreconstructable superior mesenteric vein or portal occlusion;
-
aortic invasion or encasement;
-
nodal involvement beyond the field of resection.
-
-
Metastatic, defined by distant sites of disease.
Description of the intervention
Chemotherapy
Chemotherapy encompasses all cytotoxic or antineoplastic drug treatments, intravenous or oral, which work by killing or slowing the growth of cancer cells. Although the schedules differ between therapies, most are given on a four‐weekly basis (one cycle) for up to six cycles.
Radiotherapy
Radiation therapy uses X‐rays to destroy or injure cancer cells so they cannot multiply (Queensland Cancer Fund 2012). It is given in a number of different ways.
-
External beam radiotherapy: delivered over a number of sessions (fractions) utilising an external radiotherapy source emitting X‐rays, gamma rays, electrons or heavy particles.
-
Stereotactic body radiation therapy: a highly conformal (targeted) technique for delivering external beam radiotherapy in a single fraction (stereotactic radiosurgery) or a number of fractions (stereotactic radiotherapy).
-
Brachytherapy: internal radiotherapy utilising a radioactive source placed into or adjacent to the pancreas and administered in a single fraction or number of fractions, given alone or in combination with external beam radiotherapy.
-
Intraoperative radiotherapy: administration of external source radiotherapy or brachytherapy at the time of surgery, given alone or in combination with external beam radiotherapy.
Best supportive care
Best supportive care in advanced disease is defined as anything other than chemotherapy. It may include symptom control by radiotherapy (not to the primary site), palliative surgery, biliary stent insertion, analgesia, blood transfusion, and psychological or social support.
How the intervention might work
The primary goal for all treatments for locally advanced or metastatic pancreatic cancer is to palliate symptoms and improve overall survival (see Appendix 1, 'Glossary of terms'). In general, chemotherapy and radiotherapy can potentially kill cancer cells in the body and reduce the severity of the disease. This can in turn, reduce symptoms and increase survival times. In the advanced setting, chemotherapy and radiotherapy do not offer a cure. Best supportive care is usually administered alongside chemotherapy and radiotherapy, but it can be the sole treatment given to some patients. All anti‐cancer therapies can cause side effects, which commonly include fatigue, nausea, vomiting, low blood counts (haemoglobin, white cells and platelets) and diarrhoea. Radiotherapy can cause local pain, skin rash, fatigue, nausea and vomiting.
Why it is important to do this review
Given the poor prognosis of PC, evidence‐based clinical decision‐making is paramount in guiding patients through treatments. Performing a meta‐analysis of studies will ensure that clinicians and patients have a reference to inform their clinical choices.
The meta‐analysis published previously in Yip 2009 has been criticised for not using hazard ratios to assess survival (Sultana 2007). This update will use hazard ratios and also assess quality of life.
PC is a notoriously difficult cancer in which to perform clinical studies, and much controversy exists. Although there is evidence in the first line setting that supports the use of FOLFIRINOX (Conroy 2011), gemcitabine plus erlotinib (Moore 2007), gemcitabine plus fluoropyrimidine (Cunningham 2009), or nab‐paclitaxel (Von Hoff 2013), questions remain with regard to toxicity, cost and survival benefits. There is conflicting evidence on the place for and schedule of chemoradiation as well as debate about the optimum drug and dose (Kim 2007; Philip 2011).
Previous meta‐analyses have had narrow search criteria (Chan 2014; Li 2014; Petrelli 2014), or they have used only phase III randomised data (Gresham 2014). Here, we have attempted to synthesise and organise all available randomised data concerning patients having treatment for advanced pancreas cancer in order to help inform clinical decision‐making and guide further research in this area.
Objectives
To assess the effect of chemotherapy, radiotherapy or both for first‐line treatment of advanced pancreatic cancer. Our primary outcome was overall survival, while secondary outcomes include progression‐free survival, grade 3/4 adverse events, therapy response and quality of life.
Methods
Criteria for considering studies for this review
Types of studies
Randomised controlled studies, both published and unpublished, comparing one of the intervention types versus placebo, another intervention type or best supportive care.
Types of participants
People with a diagnosis of pancreatic adenocarcinoma established by either histological or cytological findings (investigations on body tissue or cells). Studies enrolling people with advanced, unresectable or recurrent disease were eligible for inclusion.
Types of interventions
Any type of chemotherapy, radiotherapy or combination of chemotherapy plus radiotherapy versus placebo, no treatment, best supportive care or another chemotherapy and/or radiotherapy treatment regimen.
Best supportive care in advanced disease may include symptom control by radiotherapy (not to the primary site), palliative surgery, biliary stent insertion, analgesia, blood transfusion and psychological or social support.
We looked for interventions falling into the following comparisons.
-
Any chemotherapy treatment versus placebo, no treatment or best supportive care.
-
Any chemotherapy treatment versus any other chemotherapy treatment.
-
Any radiotherapy treatment versus placebo, no treatment or best supportive care.
-
Any radiotherapy treatment versus any other radiotherapy treatment.
-
Any combination of radiotherapy and chemotherapy versus placebo, no treatment or best supportive care.
-
Any combination of radiotherapy and chemotherapy versus any other combination of radiotherapy and chemotherapy.
After searching was complete, the studies were organised into four specific comparisons.
-
Anti‐cancer therapy versus best supportive care
-
Various types of chemotherapy versus gemcitabine
-
Gemcitabine combinations versus gemcitabine alone
-
Fluoropyrimidine combinations versus fluoropyrimidines alone
Types of outcome measures
Primary outcomes
Overall survival (OS) ‐ survival until death from any cause
Secondary outcomes
-
Progression‐free survival (PFS) ‐ time to progression of disease on a given therapy. This is usually detected by an increase of the size or number of cancer lesions seen on a computer tomography scan (CT) using the Response Evaluation Criteria in Solid Tumours (RECIST) criteria (Nishino 2010).
-
Quality of life (QoL), measured with a validated instrument, such as the European Organisation for Research and Treatment of Cancer (EORTC) quality of life questionnaire for cancer patients (QLQ‐C30) (eortc.be/qol/).
-
Response rates ‐ this relates to the shrinkage of a cancer in response to therapy and is usually measured on CT scans, with cancer shrinkage defined according to the RECIST criteria (Nishino 2010).
-
Grade 3/4 adverse events ‐ adverse events are defined by the National Cancer Institute (cancer.gov) as an unfavourable and unintended sign or symptom associated with a medical treatment. Severity is graded. Grade 3 is classed as a severe or medically significant event but not immediately life threatening. Hospitalisation is indicated, and the effects limit the patients' ability to self care. Grade 4 is classed as a life‐threatening event requiring urgent attention.
Search methods for identification of studies
The authors completed searches to identify all relevant published and unpublished randomised controlled studies. Articles published in any language were eligible for inclusion.
We searched the following electronic databases.
-
Cochrane Central Register of Controlled Trials (CENTRAL; 2017; Issue 6), which includes the Cochrane Upper Gastrointestinal and Pancreatic Diseases Group Trials Register, in the Cochrane Library (searched 14 June 2017); Appendix 2.
-
MEDLINE (1946 to 14 June 2017); Appendix 3.
-
EMBASE (1980 to 14 June 2017); Appendix 4.
-
CANCERLIT (1999 to 2002). We did not undertake subsequent searches in CANCERLIT, as the database merged with MEDLINE in 2002.
To identify randomised controlled studies, we applied phases one, two and three of the Cochrane highly sensitive search strategy, as described in the Cochrane Handbook for Reviews of Interventions (Higgins 2011).
Electronic searches
We handsearched reference lists from studies and review articles from the electronic searching to identify further relevant studies. We also handsearched published abstracts from the following conference proceedings.
-
American Gastroenterological Association (AGA) (1994 to 2014).
-
American Society of Clinical Oncology (ASCO) (1996 to 2016).
-
American Association of Cancer Research (AACR) (1957 to 2014).
-
American Pancreatic Association (APA) (2001 to 2014).
-
Digestive Disease Week (DDW) (1994 to 2014).
-
European Cancer Conference (ECCO) (1997, 1999, 2001, 2003, 2005, 2007, 2009, 2011, 2013).
-
European Society of Medical Oncology (ESMO) (1998, 2000, 2002, 2004, 2006, 2008, 2010, 2012, 2014).
-
Joint ECCO/ESMO meeting (2009, 2010, 2011, 2013).
-
European Pancreatic Club (EPC) (2000 to 2014).
-
Gastrointestinal Cancers Symposium (2007 to 2015).
-
United European Gastroenterology Week (UEGF) (1960 to 2014).
We searched the following information resources.
-
National Cancer Institute Physician Data Query.
-
UK Co‐ordinating Committee on Cancer Research.
We also searched the following study registers.
-
Australian and New Zealand Clinical Trials Registry.
-
National Research Register.
-
Medical Research Council.
-
Clinicaltrials.gov.
-
Current Controlled Trials.
-
Trialscentral.
-
Center Watch.
Searching other resources
We searched the Internet using the Google search engine. In addition, we contacted members of the Cochrane Upper Gastrointestinal and Pancreatic Diseases Group and other experts in the field and ask them to provide details of outstanding clinical studies and any relevant unpublished materials that were known to them.
Data collection and analysis
Selection of studies
We scanned titles of studies from the electronic search, removing duplicates. Two independent review authors (VC and AN) then considered the titles and abstracts to exclude clearly ineligible studies. We retrieved the full text of all remaining records, and two review authors (VC and AN) independently assessed them against inclusion criteria for the review, resolving disagreements with adjudication by a third review author (DY) according to the process outlined in Chapter 7.2.3 of the Cochrane Handbook for Systematic Reviews of Interventions (Higgins 2011). We documented reasons for excluding studies according to Higgins 2011.
Data extraction and management
Two independent review authors (VC and AN) extracted data, recording the inclusion/exclusion criteria, number of participants and treatment arms for each study. For survival outcomes, we recorded hazard ratios (HRs) for OS and PFS from the published data where possible. If not reported, then we extracted time‐to‐event data and derived the HRs using the methods described in Tierney 2007. We also extracted median survival times. For response rates and adverse events (AEs), we recorded the number of people who had experienced an event of interest and the total number of people evaluated for that event to determine the risk ratio (RR). We extracted details on QoL in a descriptive fashion as published.
Assessment of risk of bias in included studies
Two review authors used the Cochrane 'Risk of bias' tool to independently assess risk of bias in the studies, with a a third independent review author settling disputes (Higgins 2011).
We summarised the results in a 'Risk of bias summary' graph. We interpreted the results of meta‐analyses in light of the findings of the risk of bias assessments.
Measures of treatment effect
For survival data, we used the HR with 95% confidence intervals (CI) and median survival times. For dichotomous data (response rates and grade 3/4 AEs), we used the risk ratio (RR) with a 95% CI. We report quality of life in a descriptive, tabulated fashion.
Unit of analysis issues
For studies that compared more than one treatment arm with a control arm in the same meta‐analysis, we divided the number of participants in the control group by the number of treatment arms. There were no other unit of analysis issues.
Dealing with missing data
When we could not extract data from the text, or when statistics were missing, we attempted to contact the authors of the original article to obtain the necessary information.
Assessment of heterogeneity
We assessed heterogeneity by visual inspection of the forest plots and statistically with the Chi² test for homogeneity and the I² statistic for inconsistency.
Assessment of reporting biases
Had we included comparisons with more than 10 included studies, we would have constructed funnel plots to assess reporting bias.
Data synthesis
We used the generic inverse variance method for all meta‐analyses according to the guidance in the Cochrane Handbook for Systematic Reviews of Interventions (Higgins 2011). Due to the heterogeneity of the interventions and comparators, we used a random‐effects model in all instances. We performed all analyses using Review Manager 5 (RevMan 5) software (RevMan 2014), following an intention‐to‐treat principle when data permitted.
Subgroup analysis and investigation of heterogeneity
We did not perform any subgroup analyses.
Sensitivity analysis
We planned to perform sensitivity analyses by excluding studies at high risk of bias from the meta‐analysis, but due to the small number of studies in the various comparisons, we were unable to do so.
Summary of findings table
We created four summary of findings tables describing the primary outcome measure of OS for participants. We included a narrative summary of the toxicity and QoL data in the comments section of the table. We calculated the median 12‐month survival rate for the control arm to calculate the assumed risk for each comparison. We used the percentage of people alive at 12 months if it was available, otherwise we extracted the data from the Kaplan‐Meier curves. We then applied the summary HR to this rate to give an anticipated effect on the rate of death with the intervention versus the comparator, expressed as number of events per 1000 people. We used the 6‐month survival rate if all control arm participants had died by 12 months.
We used the GRADE approach to assess the quality of the body of evidence for the outcome OS as described by the GRADE Working Group and in the GRADE Handbook (Guyatt 2011; Schünemann 2013).
Results
Description of studies
Results of the search
Figure 1 presents the study flow chart. We identified 1304 studies through electronic searches and an additional 80 studies through handsearching. After removing duplicates and studies that were clearly not eligible for inclusion, we assessed 215 full‐text articles. Of these, we excluded 155, including 49 that did not meet the inclusion criteria for the review, and 106 that will be reported in a separate Cochrane Review.
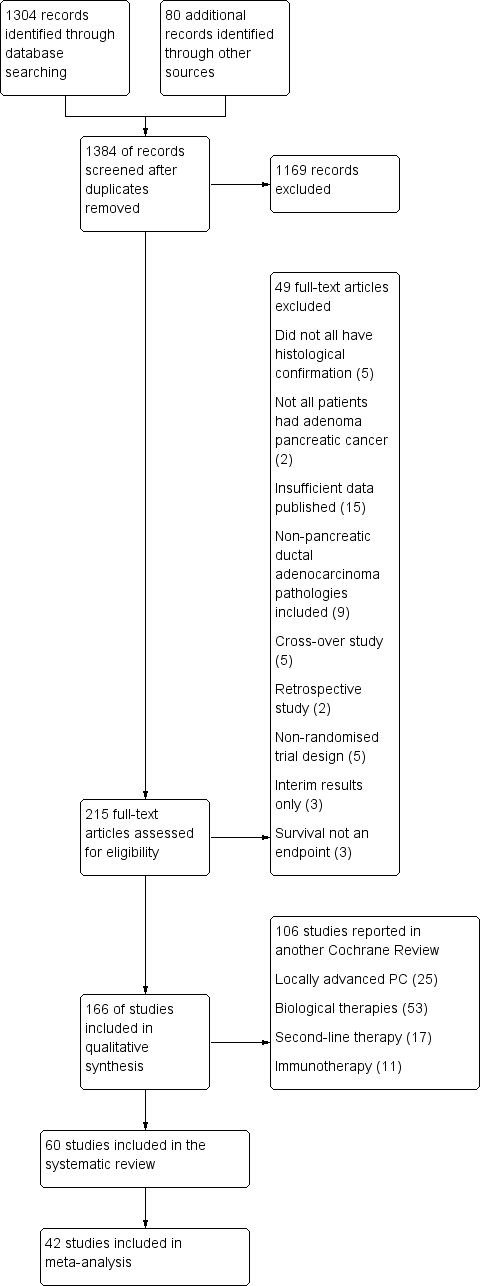
1 Study flow diagram.
Included studies
The original published protocol had wide inclusion criteria. Due to the large number of studies identified, we decided to split the review. Therefore, we will report studies addressing biological agents, immunotherapy, second‐line therapies and local therapies for locally advanced disease separately. This report focuses on studies of either chemotherapy or radiotherapy in the advanced setting only.
We included sixty studies assessing the effects on chemotherapy in advanced PC (Characteristics of included studies). We did not identify any studies that addressed radiotherapy in the advanced setting. Of the included studies, we were able to include 42 with data on 9463 participants in a meta‐analysis.
We categorised these studies into five main categories.
-
Any anti‐cancer treatment versus best supportive care (6 studies: Andren‐Sandberg 1983; Frey 1981; Glimelius 1996; Huguier 2001,Takada 1998; Xinopoulos 2008).
-
Various types of chemotherapy versus gemcitabine (8 studies: Burris 1997; Cheverton 2004; Conroy 2011; Poplin 2009; Poplin 2013; Singhal 2014; Smith 2003; Tempero 2003).
-
Gemcitabine combination versus gemcitabine alone (7 studies addressing platinum plus gemcitabine: Colucci 2002; Colucci 2010; Heinemann 2006; Li 2004; Louvet 2005; Viret 2004; Wang 2002; 10 studies addressing fluoropyrimidine plus gemcitabine: Berlin 2002; Cunningham 2009; Di Costanzo 2005; Herrmann 2007; Lee 2017; Ohkawa 2004; Ozaka 2012; Riess 2005; Scheithauer 2003; Ueno 2013; 3 studies addressing topoisomerase inhibitors plus gemcitabine: Abou‐Alfa 2006; Rocha Lima 2004; Stathopoulos 2006; 1 study addressing taxane plus gemcitabine: Von Hoff 2013; 2 studies addressing multi‐drug combinations including gemcitabine: Petrioli 2015; Reni 2005; and 4 studies of other agents combined with gemcitabine: Gansauge 2002; Meng 2012; Oettle 2005; Ueno 2013 – EPA study).
-
Fluoropyrimidine‐based studies (4 studies: Ducreux 2004; Kovach 1974; Maisey 2002; Moertel 1979).
-
Single studies addressing unique treatment comparisons (13 studies: Afchain 2009; Boeck 2008; Bukowski 1983; Corrie 2017; Hirao 2011; Kelsen 1991; Kulke 2009; Levi 2004; Lohr 2012; Lutz 2005; Moertel 1977; Reni 2012; Topham 1991).
1 Anti‐cancer therapy versus best supportive care
Six studies compared a type of anticancer therapy with best supportive care (BSC). Andren‐Sandberg 1983 (N = 47) compared 5FU/CCNU plus vincristine (n = 25) versus BSC (n = 22). Frey 1981 included 152 participants with unresectable PC and assessed 5‐fluorouracil (5FU) plus chloroethylcyclohexylnitrosurea (CCNU). Glimelius 1996 studied people with advanced PC or biliary tract cancer; of the 53 participants with PC, 29 were given 5FU/LV, with or without etoposide, and 24 received BSC. Huguier 2001 included 45 participants with unresectable PC; the treatment arm was cisplatin plus 5FU plus leucovorin (LV). Takada 1998 included 83 people with unresectable PC; the treatment arm was 5FU plus doxorubicin plus mitomycin C (MMC). Xinopoulos 2008 included 49 people with locally advanced PC; the treatment arm was gemcitabine.
2 Various types of chemotherapy versus gemcitabine
Eight studies compared various types of chemotherapy versus gemcitabine.
2.1 5FU versus gemcitabine
There was one study in this group involving 126 people with symptomatic advanced PC; 63 were given 5FU and 63 gemcitabine chemotherapy (Burris 1997).
2.2 FOLFIRINOX versus gemcitabine
Conroy 2011 tested FOLFIRINOX in 342 people, and Singhal 2014 in 310 people, with metastatic PC.
2.3 CO‐101 versus gemcitabine
One study in 367 participants with metastatic PC compared CO‐101 (lipid conjugate form of gemcitabine) versus gemcitabine (Poplin 2013).
2.4 ZD9331 versus gemcitabine
One study addressed this comparison (Smith 2003), including 55 participants with locally advanced (LA) or metastatic PC. The treatment arm was ZD9331 (thymidylate synthase inhibitor).
2.5 Fixed‐dose rate gemcitabine versus standard infusional gemcitabine
Two studies were available for analysis: Poplin 2009 and Tempero 2003. Both had slightly different schedules: Poplin 2009 involved 824 participants with LA or metastatic PC and compared gemcitabine at 1000 mg/m² given over 30 min weekly for 7 out of 8 weeks then 3 out of 4 weeks versus gemcitabine given at 1500 mg/m² over 150 min 3 out of 4 weeks. Tempero 2003 involved 92 people with LA or metastatic PC and compared a dose‐dense regimen of gemcitabine 2200 mg/m² weekly, 3 out of 4 weeks versus gemcitabine 1500 mg/m² given at 10 mg/m²/min, weekly, 3 out of 4 weeks.
2.6 Exatecan (DX‐8951f) versus gemcitabine
One study addressed this comparison (Cheverton 2004), including 339 chemotherapy‐naive participants with LA or metastatic PC. The treatment arm was exatecan (a hexacyclic, water‐soluble, topoisomerase‐1 inhibitor).
3 Gemcitabine combination studies
3.1 Gemcitabine plus a platinum agent versus gemcitabine alone
Seven studies compared gemcitabine plus a platinum agent versus gemcitabine alone (Colucci 2002; Colucci 2010; Heinemann 2006; Li 2004; Louvet 2005; Viret 2004; Wang 2002). Louvet 2005 used oxaliplatin, while the rest used cisplatin. All studies had gemcitabine alone as the control arm and gemcitabine plus a platinum agent in the treatment arm. Colucci 2002 (N = 107), Colucci 2010 (N = 400), Heinemann 2006 (N = 195). Li 2004 (N = 46) and Louvet 2005 (N = 326) all included people with LA or metastatic PC, while Viret 2004 (N = 83) and Wang 2002 (N = 42) included participants with stage III/IV PC.
3.2 Gemcitabine plus fluoropyrimidine versus gemcitabine alone
Ten studies compared gemcitabine plus fluoropyrimidine versus gemcitabine alone (Berlin 2002; Cunningham 2009; Di Costanzo 2005; Herrmann 2007; Lee 2017; Ohkawa 2004; Ozaka 2012; Riess 2005; Scheithauer 2003; Ueno 2013).
-
Two studies assessed infusional 5FU in 567 participants with with LA/metastatic PC (Di Costanzo 2005; Riess 2005), and one study tested bolus 5FU in 322 participants with unresectable PC (Berlin 2002).
-
Four studies used capecitabine in: 533 people with LA/metastatic PC (Cunningham 2009), 319 people with inoperable/metastatic PC (Herrmann 2007), 214 people with LA/metastatic PC (Lee 2017), and 83 people with metastatic PC (Scheithauer 2003).
-
Two studies used oral tegafur (S1) in LA/metastatic PC: Ozaka 2012 included 112 participants and Ueno 2013 832. Ueno 2013 was a multi‐armed study that compared gemcitabine versus S1 versus gemcitabine plus S1.
-
One study assessed tegafur‐uracil (UFT) in 19 participants (Ohkawa 2004).
3.3 Gemcitabine plus toposiomerase inhibitor versus gemcitabine alone
Three studies compared gemcitabine plus a toposiomerase inhibitor versus gemcitabine alone in participants with LA or metastatic PC (Abou‐Alfa 2006; Rocha Lima 2004; Stathopoulos 2006). Rocha Lima 2004 (N = 360) and Stathopoulos 2006 (N = 130) tested irinotecan, and Abou‐Alfa 2006 (N = 349) used exatecan.
3.4 Gemcitabine plus taxane versus gemcitabine alone
Only one study, in 861 participants with metastatic PC, was suitable for analysis (Von Hoff 2013).
3.5 Gemcitabine plus other combinations of chemotherapy versus gemcitabine alone
Two studies assessed gemcitabine plus other combinations of chemotherapy: Petrioli 2015 included 67 people with metastatic PC and combined oxaliplatin plus capecitabine plus gemcitabine (GEMOXEL). Reni 2005 assessed 99 people with LA/metastatic PC and used a combination cisplatin‐epirubicin‐5FU‐gemcitabine.
3.6 Gemcitabine in combination with other agents versus gemcitabine alone
Four studies examined different agents in combination with gemcitabine: Gansauge 2002 looked at 90 participants with unresectable PC and used Ukrain (herbal medicine), Meng 2012 assessed 76 people with unresectable PC and used huachansu (Chinese herbal medicine), Oettle 2005 included 565 people with LA/metastatic PC and used pemetrexed, and Ueno 2013 – EPA study included 66 people with advanced PC and used eicosapentaenoic acid supplement (EPA).
4 Fluoropyrimidine combinations versus fluoropyrimidine alone
Four studies compared fluoropyrimidine combinations versus fluoropyrimidine alone (Ducreux 2004; Kovach 1974; Maisey 2002; Moertel 1979). Ducreux 2004 was a three‐armed study in 63 participants with LA or metastatic PC, and Kovach 1974 included 82 participants with unresectable PC and compared 5FU versus bis‐chloroethylnitrosurea (BCNU) alone versus 5FU plus BCNU. Maisey 2002 analysed 209 participants with LA or metastatic PC and compared 5FU versus 5FU plus mitomycin C (MMC). Moertel 1979 involved 176 people with metastatic PC and used streptozocin in the treatment arm. We were unable to include Cullinan 1985 and Cullinan 1990 in the meta‐analysis, as they were multi‐armed studies in which the control arm could not be split.
5 Single studies addressing unique treatment comparisons
Many studies addressed unique comparisons, so we could not group them with other studies.
-
Boeck 2008 studied capecitabine plus oxaliplatin (n = 61) versus capecitabine plus gemcitabine (n = 64) versus modified gemcitabine plus oxaliplatin (n = 63).
-
Kulke 2009 was a multi‐armed study comparing fixed dose rate gemcitabine (n = 64) versus infusional gemcitabine plus cisplatin (n = 66) versus infusional gemcitabine plus docetaxel (n = 65) versus infusional gemcitabine plus irinotecan (n = 60).
-
Afchain 2009 compared standard gemcitabine plus oxaliplatin (n = 20) versus a simplified gemcitabine plus oxaliplatin protocol (n = 37).
-
Bukowski 1983 compared mitomycin C plus 5FU (MF) (n = 73) versus streptozocin plus MMC plus 5FU (SMF) (n = 72).
-
Hirao 2011 looked at gemcitabine given on a three‐week schedule (n = 45) versus gemcitabine given on a four‐week schedule (n = 45).
-
Kelsen 1991 compared streptozocin plus MMC plus 5FU (SMF) (n = 42) versus cisplatin plus ara‐C plus caffeine (CAC) (n = 40).
-
Levi 2004 studied 5FU given either as a constant or chronomodulated infusion, with (n = 52) versus without (n = 55) cisplatin.
-
Lutz 2005 compared gemcitabine plus docetaxel (n = 49) versus cisplatin plus docetaxel (n = 47).
-
Moertel 1977 looked at streptozocin plus 5FU (n = 40) versus streptozocin plus cyclophosphamide (n = 48).
-
Reni 2012 compared capecitabine plus cisplatin plus gemcitabine plus docetaxel (PDXG) (n = 53) versus capecitabine plus cisplatin plus gemcitabine plus epirubicin (PEXG) (n = 48).
-
Finally, Topham 1991 looked at epirubicin (n = 32) versus 5FU plus epirubicin plus MMC (n = 30).
Excluded studies
We excluded 155 studies. Other Cochrane Reviews will cover the 53 studies addressing biological agents, the 11 assessing immunotherapies, the 25 looking at local therapies in locally advanced disease and the 17 focusing on second‐line therapies. We excluded the remaining 49 studies for the following reasons.
-
Five studies did not mandate histological confirmation in the study protocol (Abdel Wahab 1999; Johnson 2001; Mallinson 1980; Nakai 2012; Palmer 1994).
-
Two studies included some participants who did not have advanced stage PC (Andersen 1981; Lygidakis 1995).
-
Fifteen studies did not provide sufficient data (Baker 1976; Cohen 2010; GITSG 1985; Kim 2011; Oberic 2011; Queisser 1979; Ramanathan 2011; Sakata 1992; Senzer 2006; Shapiro 2005; Sultana 2009; Sun 2011; Tagliaferri 2013; Trouilloud 2012; Van Cutsem 2013).
-
Nine studies included people with non‐PDAC histologies (Ducreux 2002; GITSG 1988; Lokich 1979; Mizuno 2013; Moertel 1981; Oster 1986; Schein 1978; Sudo 2014; Takada 1994).
-
Five were cross‐over studies (Berglund 2010; Dahan 2010; Heinemann 2013 (GUT); Horton 1981; Javle 2011).
-
Five had a non‐randomised study design (Bukowski 1993; Gong 2007; Mitry 2006; Yongxiang 2001; Zemskov 2000).
-
Three studies published only interim results (GITSG 1979; Topham 1993; Tuinmann 2008).
-
Survival was not an endpoint in three studies (Ardalan 1988; Meyer 2008; Schmitz‐Winnenthal 2013).
Risk of bias in included studies
Figure 2 and Figure 3 summarise the risk of bias of all included studies. Many studies did not publish sufficient details to make a judgement on selection bias. Of those that did, all were judged to be at a low risk of bias because they used centralised randomisation techniques. Only one study was double‐blind and placebo controlled (Meng 2012), and we judged it to be at low risk for performance bias. We assessed the remainder of the studies to be at a high risk of bias. We considered studies that used OS as the primary endpoint to be at a low risk for detection bias (Abou‐Alfa 2006; Berlin 2002; Cheverton 2004; Colucci 2010; Conroy 2011; Cullinan 1985; Cullinan 1990; Cunningham 2009; Frey 1981; Gansauge 2002; Glimelius 1996; Heinemann 2006; Herrmann 2007; Huguier 2001; Kulke 2009; Lee 2017; Levi 2004; Li 2004; Lohr 2012; Louvet 2005; Oettle 2005; Poplin 2009; Poplin 2013; Riess 2005; Rocha Lima 2004; Singhal 2014; Smith 2003; Stathopoulos 2006; Takada 1998; Tempero 2003; Ueno 2013; Von Hoff 2013; Xinopoulos 2008). If tumour assessments were needed to assess the primary outcome (e.g. RR or PFS), we assigned a low risk of bias only if an independent reviewer or by a blinded radiologist conducted the assessments (Ducreux 2004; Reni 2005; Reni 2012; Scheithauer 2003). We judged all other studies to be at a high risk of bias. We deemed studies that reported the intention‐to‐treat population (all participants randomised on the study regardless if they received any treatment or not) to be at a low risk of attrition bias, while we considered studies that did not report all randomised patients to be at a high risk of bias (Bukowski 1983; Cullinan 1985; Ducreux 2004; Kelsen 1991; Louvet 2005; Moertel 1977; Ozaka 2012). We detected selective reporting bias in only two studies (Bukowski 1983; Moertel 1979), the former because only the participants with measurable disease were reported in detail and the latter because the toxicity data were not comprehensively reported.

Risk of bias graph: review authors' judgements about each risk of bias item presented as percentages across all included studies.
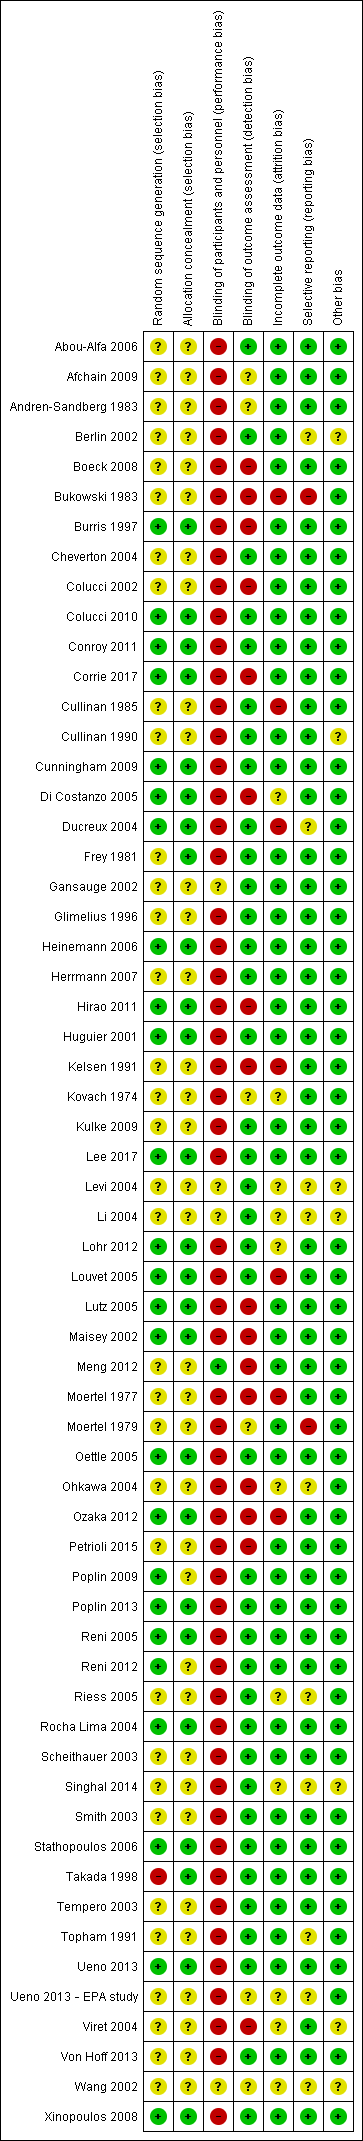
Risk of bias summary: review authors' judgements about each risk of bias item for each included study.
We describe details of the risk of bias of the included studies in the Effects of interventions section.
Effects of interventions
See: Summary of findings for the main comparison Anti‐cancer therapy versus best supportive care for advanced pancreatic cancer; Summary of findings 2 Various types of chemotherapy versus gemcitabine for advanced pancreatic cancer; Summary of findings 3 Gemcitabine combinations versus gemcitabine alone for advanced pancreatic cancer; Summary of findings 4 Fluoropyrimidine combinations versus fluoropyrimidine alone for advanced pancreatic cancer
1 Anti‐cancer therapy versus best supportive care (BSC)
Six studies addressed any anti‐cancer therapy versus best supportive care (Andren‐Sandberg 1983; Frey 1981; Glimelius 1996; Huguier 2001,Takada 1998; Xinopoulos 2008). The main potential source of bias in these studies came from their non‐blinded design; however, we did not feel this significantly affected the results for overall survival (Figure 2; Figure 3). In three studies the risk of selection bias was unclear due to insufficient reporting (Andren‐Sandberg 1983; Glimelius 1996; Xinopoulos 2008).
Four of the six studies provided data in sufficient detail to derive hazard ratios (HR) for OS, with 298 people analysed. Pooled data of four studies in 298 people showed an HR of 1.08 (95% CI 0.88 to 1.33; Analysis 1.1). There was no statistical heterogeneity between studies (I² = 0%). Median survival ranged from 3.0 to 8.6 months in the anti‐cancer therapy group and 2.5 to 7.0 months in the BSC group. The difference in median survival times ranged from 0.9 months in favour of BSC to 3.5 months in favour of anticancer therapy (Table 1).
| Study | Anti‐cancer therapy details | Median survival:anti‐cancer therapy vs best supportive care (months) | Quality of life |
| 5FU + CCNU | 5 vs 4 | No difference in Karnofsky performance status (KPS) score | |
| 5FU + CCNU | 3.0 vs 3.9 | Not addressed | |
| 5FU + LV | 6.0 vs 2.5 | EORTC QLQ‐C30 results favoured the anti‐cancer therapy (NB: high rate of dropouts in the later time points) | |
| 5FU + LV + cisplatin | 8.6 vs 7.0 | Not addressed | |
| 5FU + doxorubicin + MMC | 4.9 vs 5.0 | Not addressed | |
| Gemcitabine | 5.25 vs 5.5 | Superior QoL (EORTC QLQ‐C30) in the gemcitabine group during the 1st month (P = 0.028), no difference from the 2nd to the 4th month; in the 5th and 6th month superior QoL in the BSC group (P = 0.010 and < 0.001) |
5FU: 5‐Fluorouracil; CCNU: chloroethylcyclohexylnitrosurea; EORTC QLQ‐C30: European Organisation for Research and Treatment of Cancer quality of life questionnaire for cancer patients; LV: leucovorin; MMC: 5FU+doxorubicin + mitomycin C
Three studies reported quality of life (Table 1). Andren‐Sandberg 1983 did not find a difference in Karnofsky performance status (KPS) score. In Glimelius 1996, the EORTC QLQ‐C30 results favoured the treatment group; however, there was a high rate of dropouts in the later time points. The third study (Xinopoulos 2008) demonstrated a superior QoL (EORTC QLQ‐C30) in the gemcitabine group during the first month (P = 0.028), but there was no difference in months two to four, and the BSC group had a superior QoL in months five (P = 0.010) and six (P = 0.0003).
Trials either did not study or did not adequately report PFS and response rates, with the exception of Takada 1998. This study reported complete or partial response in one person in the anti‐cancer therapy group versus none in the BSC group.
With respect to adverse effects or toxicity in the anti‐cancer therapy group, Frey 1981 reported that 31% of participants experienced at least one toxicity, with the most common being gastrointestinal. Huguier 2001 reported that the most common toxicities were haematological and gastrointestinal (each seen in 15% of people). Takada 1998 showed that the commonest grade 3/4 adverse events (AEs) were anorexia, which occurred in in 15/28 participants and nausea/vomiting, in 5/24 participants. Haematological toxicities were the most common in Xinopoulos 2008, with leucopenia occurring in 81.5% of participants.
2 Various types of chemotherapy versus gemcitabine
Eight studies compared various types of chemotherapy versus gemcitabine (Burris 1997; Cheverton 2004; Conroy 2011; Poplin 2009; Poplin 2013; Singhal 2014; Smith 2003; Tempero 2003), analysing a total of 1844 participants in six treatment subgroups. Due to the heterogeneity of the investigational agents, we did not pool the results. Five studies provided PFS data (Burris 1997; Conroy 2011; Poplin 2009; Singhal 2014; Smith 2003). The main potential source of bias in these studies came from the non‐blinded study design. We were unable to comprehensively assess selection bias in some studies (Cheverton 2004; Singhal 2014; Smith 2003; Tempero 2003), and there was a high risk of detection bias noted in Burris 1997,Poplin 2013 and Smith 2003; however, we did not consider that it significantly affected results for overall survival.
2.1 5FU versus gemcitabine
Burris 1997 (N = 126) was the only study to compare 5FU with gemcitabine, showing an HR for OS of 1.69 (95% CI 1.26 to 2.27, P < 0.001; Analysis 2.1). The difference in median survival was 1.3 months in favour of gemcitabine (Table 2). The analysis of PFS showed an HR of 1.47 (95% CI 1.12 to 1.92, P = 0.005; Analysis 2.2). There were better outcomes for both OS and PFS with gemcitabine, and this group also showed more treatment response (0 in the 5FU arm versus 3 in the gemcitabine arm; risk ratio (RR) 0.14, 95% CI 0.01 to 2.71, P = 0.19). On the other hand, the gemcitabine arm showed a higher risk of most types of grade 3/4 toxicity: anaemia (0 in the 5FU arm versus 6 events in the gemcitabine arm: RR 0.08, 95% CI 0.0 to 1.34, P = 0.08; Analysis 2.5); neutropenia (3 events versus 16 events: RR 0.19, 95% CI 0.06 to 0.61, P = 0.006; Analysis 2.6); thrombocytopenia (1 event versus 6 events: RR 0.17, 95% CI 0.02 to 1.34, P = 0.09; Analysis 2.7); and nausea (3 events versus 8 events: RR 0.38, 95% CI 0.10 to 1.35, P = 0.13; Analysis 2.8). Diarrhoea was the exception (3 events in the 5FU arm versus 1 event in the gemcitabine arm: RR 3.00, 95% CI 0.32 to 28.07, P = 0.34; Analysis 2.9). Clinical benefit was superior in the gemcitabine arm compared with the 5FU arm, with a higher clinical benefit response (23.8% versus 4.8%), shorter median time to clinical benefit response (3 weeks versus 7 weeks) and longer duration of clinical benefit response (18 weeks versus 13 weeks) (Table 2).
| Study | Type of other chemotherapy | Median survival:other chemotherapy vs gemcitabine (months) | Quality of life |
| 5FU | 4.4 vs 5.7 | Improved clinical benefit 4.8% vs 23.8%. Median time to benefit 7 vs 3 weeks. Duration of benefit 18 vs 13 weeks | |
| FOLFIRINOX | 11.1 vs 6.8 | QLQ‐C30: decrease in Global Health Status and QoL scale at 3 months 17% vs 31%; at 6 months 31% vs 66% Median time to definitive deterioration: not reached vs 5.7 months | |
| FOLFIRINOX | 10.8 vs 7.4 | Definitive degradation of QoL at six months: 29% vs 59% | |
| CO‐101 | 5.2 vs 6.0 | Not addressed | |
| ZD‐9331 | 5.0 vs 3.6 | Not addressed | |
| Fixed dose rate gemcitabine 1500 mg/m² over 150 min | 6.2 vs 4.9 | Not addressed | |
| Fixed dose rate gemcitabine 1500 mg/m² at 10 mg/m²/min | 8.0 vs 5.0 | Not addressed | |
| Exatecan (DX‐8951f) | 5.0 vs 6.6 | Time to worsening of clinical benefit was longer in the gemcitabine group. Pain (3.7 vs 7.9 months; P = 0.0493), KPS (3.4 vs 4.6 months; P = 0.0111) and weight (2.3 vs 3.8 months; P = 0.0203). QoL measured with QLQ‐C3 and QLQ‐PAN26 were similar in the 2 groups |
5FU: 5‐Fluorouracil; FOLFIRINOX: 5‐fluorouracil + irinotecan + oxaliplatin; QoL: quality of life; QLQ‐C30 and QLQ‐PAN26: general and pancreatic cancer specific QoL questionnaire.
2.2 FOLFIRINOX versus gemcitabine
Two studies in 652 people assessed the effects of FOLFIRINOX versus gemcitabine (Conroy 2011; Singhal 2014). The FOLFIRINOX group generally outperformed gemcitabine, showing improved OS (HR 0.51, 95% CI 0.43 to 0.60, P < 0.001; I² = 29%; Analysis 2.1), longer median survival (4.3 months versus 3.4 months; Table 2), longer PFS (HR 0.46, 95% CI 0.38 to 0.57, N = 652, P < 0.001; I² = 0%; Analysis 2.2), longer time to degradation of QoL (HR 0.46, 95% CI 0.35 to 0.61, P < 0.001; I² = 0%; Analysis 2.3; Table 2), and more treatment responses (54 responses versus 16 responses: RR 3.38, 95% CI 2.01 to 5.65, P < 0.001; Analysis 2.4). On the other hand, FOLFIRINOX also showed more grade 3/4 haematological toxicity for: anaemia (13 events versus 10 events: RR 1.30, 95% CI 0.59 to 2.88, P = 0.52; Analysis 2.5), neutropenia (75 events versus 35 events: RR 2.14, 95% CI 1.52 to 3.01, P < 0.001: Analysis 2.6), and thrombocytopenia (15 events versus 6 events: RR 2.50, 95% CI 0.99 to 6.29, P = 0.05; Analysis 2.7).
2.3 CO‐101 versus gemcitabine
Poplin 2013 tested CO‐101 in 367 people. Outcomes were not different for participants in either arm. The HR for OS was 1.07 (95% CI 0.86 to 1.34, P = 0.68; Analysis 2.1). Median survival was similar in both groups, 5.2 months for CO‐101 and 6.0 months for gemcitabine (Table 2). The trial did not report PFS. The RR for response was 0.67 (95% CI 0.43 to 1.04, P = 0.08; Analysis 2.4). We could neither prove nor rule out differences in various types of grade 3/4 toxicity (Analysis 2.5; Analysis 2.6; Analysis 2.7).
2.4 ZD9331 versus gemcitabine
Smith 2003 compared ZD9331 versus gemcitabine in 55 people. There was no difference in survival for participants in either arm. The HR for OS was 0.86 (95% CI 0.42 to 1.76, P = 0.68; Analysis 2.1) and for PFS, it was 0.78 (95% CI 0.46 to 1.32, P = 0.36; Analysis 2.2). Median survival was 5.0 months and 3.6 months, respectively (Table 2). The RR for response was 0.42 (95% CI 0.04 to 4.33, P = 0.46, Analysis 2.4). We could neither prove nor rule out differences in various types of grade 3/4 toxicity (Analysis 2.5; Analysis 2.6; Analysis 2.7; Analysis 2.8; Analysis 2.9).
2.5 Fixed dose rate gemcitabine (FDR‐gem) versus standard infusional gemcitabine
Two studies assessed the effects of FDR‐gem in 644 people (Poplin 2009; Tempero 2003). OS was improved in the FDR‐gem group (HR 0.79, 95% CI 0.66 to 0.94, P = 0.009, I² = 0%; Analysis 2.1). In the two studies, median survival was 1.3 months and 3.0 months longer in the FDR‐gem group (Table 2). Only Poplin 2009 (N = 552) reported PFS, finding no significant difference between groups (HR 0.88, 95% CI 0.77 to 1.01, P = 0.06, Analysis 2.2). There were more responses seen in the FDR‐gem group (30 responses versus 19 responses), but this was not significant (RR 1.59, 95% CI 0.91 to 2.79, P = 0.10; Analysis 2.4). Analyses also showed more grade 3/4 toxicity in the FDR‐gem group: anaemia (62 events versus 35 events: RR 1.79, 95% CI 1.22 to 2.63, P = 0.003; Analysis 2.5), neutropenia (183 events versus 100 events: RR 1.85, 95% CI 1.53 to 2.23, P < 0.001; Analysis 2.6), thrombocytopenia (107 events versus 39 events: RR 2.77, 95% CI 1.99 to 3.86, P < 0.001; Analysis 2.7), and nausea (37 events versus 25 events: RR 1.52, 95% CI 0.94 to 2.46, P = 0.09; Analysis 2.8). Diarrhoea was the exception (5 events versus 12 events: RR 0.44, 95% CI 0.16 to 1.23, P = 0.12; Analysis 2.9).
2.6 Exatecan (DX‐8951f) versus gemcitabine
Cheverton 2004 demonstrated that exatecan had an inferior effect on OS compared with gemcitabine (HR 1.27, 95% CI 0.96 to 1.68, P = 0.093). Median survival in the two respective groups was 5 months versus 6.6 months; 6‐month survival rates were 44.1% versus 51.1%; and 12‐month survival rates, 17.9% versus 22.1%. There were insufficient data to include this study in the PFS analysis; however, median PFS was 2.8 months versus 4.4 months. Response rates were available in 276 people (1 response versus 10 responses: RR 0.10, 95% CI 0.01 to 0.78, P = 0.03; Analysis 2.4). Toxicity data were available in 330 people and showed that both agents performed similarly for grade 3/4 anaemia (10 events versus 10 events: RR 1.00, 95% CI 0.43 to 2.34, P = 1.00; Analysis 2.5), neutropenia (32 events versus 32 events: RR 1.00, 95% CI 0.64 to 1.55, P = 1.00; Analysis 2.6), thrombocytopenia (12 events versus 16 events: RR 0.75, 95% CI 0.37 to 1.54, P = 0.43; Analysis 2.7) and nausea (7 events versus 4 events: RR 1.75, 95% CI 0.52 to 5.86, P = 0.36; Analysis 2.8). QoL analysis showed that time to worsening of clinical benefit was longer in the gemcitabine arm, with 3.7 months to worsening of pain in the exatecan group versus 7.9 months in the gemcitabine group (P = 0.049). The gemcitabine group also showed a longer time to worsening KPS (3.4 months versus 4.6 months; P = 0.011) and to weight loss (2.3 months versus 3.8 months; P = 0.020). Global and pancreas‐specific QoL questionnaires failed to elicit significant differences between the two groups. (Table 2).
3 Gemcitabine combination studies
We identified six subgroups in this comparison, and we pooled results in the subgroups only and not overall.
3.1 Gemcitabine plus a platinum agent versus gemcitabine alone
The HR for OS based on six studies in 1140 participants showed no difference between the treatment groups, 0.94 (95% CI 0.81 to 1.08, P = 0.38; Analysis 3.1). There was some statistical heterogeneity (I² = 15%). Four studies in 1015 participants reported PFS and showed some improvement in the gemcitabine + platinum group, giving an HR of 0.80 (95% CI 0.68 to 0.95, P = 0.01; Analysis 3.2). There was high statistical heterogeneity (I² = 46%). The median survival times are listed in Table 3.
| Study | Gemcitabine combination details | Median survival:gemcitabine combination vs gemcitabine alone (months) | Quality of life |
| Platinum combinations | |||
| Gemcitabine + cisplatin | 7.5 vs 5.0 | Not addressed | |
| Gemcitabine + cisplatin | 7.2 vs 8.3 | The mean difference from baseline in global QoL (EORTC C30) was not significantly different between the 2 groups: 0.09 (gemcitabine/cisplatin) vs 6.20 (gemcitabine), P = 0.07 | |
| Gemcitabine + cisplatin | 7.5 vs 6.0 | No difference was detected in the 2 groups with either the Spitzer index or the pain intensity score | |
| Gemcitabine + cisplatin | 5.6 vs 4.6 | Clinical benefit (pain control, performance status, body weight gain) 29% vs 36% (P > 0.05); Quality adjusted life months 3.8 vs 5.6 (P < 0.001) | |
| Gemcitabine + oxaliplatin | 9.0 vs 7.1 | Not addressed | |
| Gemcitabine + cisplatin | 8.0 vs 6.7 | Q‐TWiST results did not differ significantly between the 2 arms (EORTC C30) | |
| Gemcitabine + cisplatin | 7.2 vs 9.1 | Not addressed | |
| Fluoropyrimidine combinations | |||
| Gemcitabine + 5FU (weekly) | 6.7 vs 5.4 | Not addressed | |
| Gemcitabine + capecitabine | 7.1 vs 6.2 | 89% of people completed QoL questionnaires (EORTC QLQ‐C30 + ESPAC). No differences seen at baseline between the 2 groups and no differences across treatment groups at 3 or 6 months | |
| Gemcitabine + daily 5FU | 7.5 vs 7.75 | No differences were seen between the 2 groups in mean disturbed days after cycle 1 or 2 or mean of days a person would like to cancel treatment in cycle 1 or 2 | |
| Gemcitabine + capecitabine | 8.4 vs 7.2 | CBR seen in 29% of people in combination arm and 20% of people in gemcitabine arm. Median duration of response 9.5 and 6.5 weeks, respectively (P < 0.02). No differences in QoL as measured by LASA | |
| Gemcitabine + capecitabine | 10.3 vs 7.5 | Not addressed | |
| Gemcitabine + UFT | Not stated | Not addressed | |
| Gemcitabine + S1 | 13.7 vs 8.0 | Not addressed | |
| Gemcitabine + 5FU (24 hour infusion) + FA | Not stated | Not addressed | |
| Gemcitabine + capecitabine | 9.5 vs 8.2 | The gemcitabine + capecitabine arm had an improvement in pain (35.5 vs 20%), KPS (41.9 vs 27%), but not weight (9.7 vs 17%) | |
| Gemcitabine + S1 | 10.1 vs 8.8 | The gemcitabine + S1 group showed an improvement in QALYs 0.525 vs 0.401, P < 0.001 | |
| Topoisomerase combinations | |||
| Gemcitabine + exatecan | 6.2 vs 6.7 | Not addressed | |
| Gemcitabine + irinotecan | 6.3 vs 6.5 | FACT‐Hep questionnaires were completed by 80% of people in irinotecan/gemcitabine group and 73% of the gemcitabine group during the first 30 weeks of the study. There were no differences between the 2 groups. | |
| Gemcitabine + irinotecan | 6.4 vs 6.5 | Not addressed | |
| Taxane combinations | |||
| Gemcitabine + nab‐paclitaxel | 8.5 vs 6.7 | Not addressed | |
| Other combination chemotherapy including gemcitabine | |||
| Gemcitabine + oxaliplatin + capecitabine (GEMOXEL) | 11.9 vs 7.1 | The global QoL score was higher in the combination chemotherapy group at 2 months (61 vs 56) and 4 months (72 vs 66) | |
| Cisplatin/epirubicin/gemcitabine/5FU (PEFG) | Not stated | The EORTC‐QLQ Pan 26 questionnaire was done but the sample size was insufficient to obtain adequate statistical power to reliably detect differences between groups for multiple comparisons. People in PEFG group 20% to 44% more likely to have improvement in emotional functioning, overall quality of life, cognitive measures, pain, fatigue, indigestion, dyspnoea, appetite loss and flatulence. However, people in gemcitabine group had better scores for sexual function and body image | |
| Other agents in combination with gemcitabine | |||
| Gemcitabine + Ukrain | 10.4 vs 5.2 | Not addressed | |
| Gemcitabine + huachansu | 5.2 vs 5.3 | No significant differences were seen between the treatment groups with either the FACT‐G or MDASI assessments | |
| Gemcitabine + pemetrexed | 6.2 vs 6.3 | People in the gemcitabine group had better financial difficulties score, better physical functioning score and better cognitive functioning score. People in the gemcitabine/pemetrexed group had better pain scores. Performance status improvements was seen in 11.4% of gemcitabine/pemetrexed group and 9.4% of gemcitabine group. Weight gain was seen in 10.2% of gemcitabine/pemetrexed group and 5.7% of gemcitabine group | |
| Gemcitabine + EPA | 8.2 vs 9.7 | Not addressed | |
5FU: fluorouracil; CBR: clinical benefit response; ESPAC: European Study Group for Pancreatic Cancer; EORTC: European Organisation for Research and Treatment of Cancer; FACT‐G: Functional Assessment of Cancer Therapy; FA: folinic acid; KPS: Karnofsky performance status; LASA: linear‐analog self‐assessment indicators; MDASI: MD Anderson Symptom Inventory; QALY: quality‐adjusted life year; QLQ‐C30: quality of life questionnaire for cancer patients; QoL: quality of life; Q‐TWiST: quality‐adjusted time without symptoms or toxicity.
All studies (N = 1186) reported response rates favouring the combined treatment arm (100 responses versus 67 responses: RR 1.48, 95% CI 1.11 to 1.98, P = 0.007, I² = 0%; Analysis 3.3). Data from all studies (N = 1156) contributed to meta‐analyses for grade 3/4 anaemia (62 events in the gemcitabine plus platinum group versus 45 events in the gemcitabine alone group: RR 1.41, 95% CI 0.87 to 2.31, P = 0.17; Analysis 3.4) and neutropenia (122 events versus 97 events: RR 1.34, 95% CI 0.90 to 1.97, P = 0.14; Analysis 3.5), with similar rates between groups. For other adverse events, data in 1110 participants from six studies showed more grade 3/4 AEs in the combination group: thrombocytopenia (78 events versus 35 events: RR 1.96, 95% CI 1.00 to 3.84, P = 0.05; Analysis 3.6) and nausea (52 events versus 22 events: RR 2.28, 95% CI 1.40 to 3.71, P = 0.001; Analysis 3.7), although for diarrhoea, we could not rule out the possibility that these results were due to chance (23 events versus 14 events: RR 1.48, 95% CI 0.62 to 3.53, P = 0.38; Analysis 3.8).
Four studies reported QoL data. Colucci 2010 measured QoL using the EORTC QLQ C30 questionnaires in multiple areas. Scores were from a scale of 0‐100. The mean difference (MD) between baseline scores and scores after 4 weeks of treatment were measured. The study did not find a significant MD in global QoL scores between those taking gemcitabine alone (MD 6.20) versus gemcitabine plus platinum (MD 0.09), P = 0.07. Heinemann 2006 found no difference between the treatment groups in either the Spitzer index or pain intensity score, nor did Viret 2004 find any difference in the EORTC‐QLQ C30 results between treatment groups. Li 2004 reported finding no difference in clinical benefit but better quality of life outcomes in the gemcitabine alone arm (3.8 months versus 5.6 months in QoL‐adjusted life months gained P < 0.001; Table 3).
In the one study that we could not include in the meta‐analysis (Li 2004), there were no differences between the control and treatment groups for OS (4.6 months versus 5.6 months) or PFS (2.8 months versus 2.8 months; Table 3).
The main source of bias identified in these studies was their non‐blinded study design. There was a high risk of attrition bias in Louvet 2005 and insufficient details in Viret 2004 and Wang 2002 reports to make a comprehensive assessment of risk of bias.
3.2 Gemcitabine plus fluoropyrimidine versus gemcitabine alone
Ten studies reported OS in 2718 participants. A benefit for adding fluoropyrimidine to gemcitabine was detected (HR 0.88, 95% CI 0.81 to 0.95, P = 0.001; Analysis 3.1), with no statistical heterogeneity (I² = 0%). Eight studies reported PFS in 2608 participants and abenefit for the combination arm was also shown (HR 0.79, 95% CI 0.72 to 0.87, P < 0.001). There was moderate statistical heterogeneity with an I² of 34% (Analysis 3.2). The median survival times ranged from 5.4 months to 8.8 months in the gemcitabine alone group and from 6.7 months to 13.7 months in the combination group (Table 3). Ueno 2013 was a multi‐armed study that compared gemcitabine alone versus S1 alone versus gemcitabine plus S1. The analysis in this review includes only the gemcitabine alone and gemcitabine plus S1 arms.
Nine studies reported response rates in 2176 participants. Responses were more common in the combination group (228 responses in the combination group versus 124 responses in the gemcitabine alone group), RR 1.78 (95% CI 1.29 to 2.47, P < 0.001; Analysis 3.3), with high statistical heterogeneity (I² = 52%). Eight studies reported grade 3/4 AEs in 2158 participants in the combination group versus the gemcitabine alone group, with the combination treatment group tending to experience more AEs: anaemia (97 events versus 89 events: RR 1.11, 95% CI 0.84 to 1.45, P = 0.47; Analysis 3.4), neutropenia (353 events versus 234 events: RR 1.53, 95% CI 1.34 to 1.74, P < 0.001; Analysis 3.5), thrombocytopenia (122 events versus 81 events: RR 1.48, 95% CI 1.00 to 2.18, P = 0.05; Analysis 3.6), nausea (61 events versus 47 events: RR 1.27, 95% CI 0.87 to 1.84, P = 0.22; Analysis 3.7), and diarrhoea (55 events versus 23 events: RR 2.16, 95% CI 1.34 to 3.47, P = 0.002; Analysis 3.8).
Five studies recorded QoL data. Cunningham 2009 used the Memorial pain assessment card, EORTC QLQ C30 and ESPAC QoL questionnaires. Di Costanzo 2005 recorded mean disturbed days and the mean days the person would like to cancel treatment. Herrmann 2007 used a linear‐analogue self‐assessment (LASA) indicators for clinical benefit response (CBR). Scheithauer 2003 recorded a combination of pain, KPS and weight, and Ueno 2013 recorded quality adjusted life years (QALYs). Cunningham 2009 did not find any significant differences in QoL between treatment groups. Likewise, Di Costanzo 2005 did not show any differences in QoL outcomes. Herrmann 2007 did not show a difference in either CBR or QoL (measured by LASA); however, in those people who did have a CBR, the duration was longer in the combination arm (9.5 weeks versus 6.5 weeks, P < 0.02). Scheithauer 2003 demonstrated an improvement in pain response and KPS but not weight gain in the combination arm, and Ueno 2013 showed a statistically significant improvement in QALYs in the combination group: 0.401 versus 0.525, P < 0.001 (Table 3).
The main source of bias identified in this comparison was due to the non‐blinded study design. The risk of selection bias was unclear in Berlin 2002; Herrmann 2007; Ohkawa 2004; Riess 2005 and Scheithauer 2003, but we did not consider that this significantly affected the results.
3.3 Gemcitabine plus topoisomerase inhibitor versus gemcitabine alone
Three studies reported OS data in 839 participants, giving an HR of 1.01 (95% CI 0.87 to 1.16, P = 0.92; Analysis 3.1), indicating no difference between groups. There was no heterogeneity (I² = 0%). Two studies reported similar PFS in 709 participants (HR 0.91, 95% CI 0.78 to 1.07, P = 0.26, I² = 0%; Analysis 3.2). The median survival times were very similar between the two groups (Table 3). All studies reported response rates, with data on 729 participants (49 responses in the combined treatment group versus 22 responses in the gemcitabine alone group: RR 1.50, (95% CI 0.92 to 2.46, P = 0.11, I² = 0%; Analysis 3.3). The combination arms were shown to be more toxic with data for grade 3/4 AEs in 797 participants: anaemia (41 events versus 37 events: RR 1.09, 95% CI 0.72 to 1.66, P = 0.68; Analysis 3.4), neutropenia (132 events versus 88 events: RR 1.54, 95% CI 1.04 to 2.30, P = 0.03; Analysis 3.5), thrombocytopenia (63 events versus 31 events: RR 2.28, 95% CI 0.97 to 5.36, P = 0.06; Analysis 3.6), nausea (36 events versus 23 events: RR 1.55, 95% CI 0.94 to 2.55, P = 0.09; Analysis 3.7) and diarrhoea (36 events versus 6 events: RR 3.47, 95% CI 0.74 to 16.33, P = 0.12; Analysis 3.8).
Rocha Lima 2004 was the only study to record QoL data (FACT‐Hep questionnaire) and reported no significant differences between the two groups (Table 3).
The main source of bias identified in this comparison was due to the non‐blinded study design, but we did not consider that this affected the results.
3.4 Gemcitabine plus taxane versus gemcitabine alone
Von Hoff 2013 was the only study in this group, and trialists analysed all 861 participants for OS, PFS and response rate. A benefit in survival outcomes was demonstrated in the combination arm. For OS, the HR was 0.72 (95% CI 0.62 to 0.84; P < 0.001; Analysis 3.1), and for PFS, HR was 0.69 (95% CI 0.58 to 0.82; P < 0.001; Analysis 3.2). The median survival time was 8.5 months in the combination group versus 6.7 months in the gemcitabine control (Table 3). There was a higher response rate in the combination arm (99 responses versus 30 responses: RR 3.29, 95% CI 2.24 to 4.84, P < 0.001; Analysis 3.3). Data on grade 3/4 AEs were available for 793 participants and overall, toxicity was more common in the combination arm: anaemia (53 events versus 48 events: RR 1.06, 95% CI 0.73 to 1.52, P = 0.76; Analysis 3.4), neutropenia (153 events versus 103 events: RR 1.42, 95% CI 1.16 to 1.75, P < 0.001; Analysis 3.5), thrombocytopenia (52 events versus 36 events: RR 1.38, 95% CI 0.93 to 2.07, P = 0.11; Analysis 3.6), neuropathy (70 events versus 3 events: RR 22.35, 95% CI 7.10 to 70.40, P < 0.001; Analysis 3.9) and fatigue (70 events versus 27 events: RR 2.48, 95% CI 1.63 to 3.79, P < 0.001; Analysis 3.10). The studies did not report on QoL.
Corrie 2017 was a unique study that we could not include in this analysis, addressing nab‐paclitaxel plus gemcitabine versus the same agents given in a sequential dosing schedule. Here the standard arm had similar results to the nab‐paclitaxel plus gemcitabine arm of Von Hoff 2013, with a median survival of 7.9 months, median PFS of 4.0 months and response rate of 33%.
Likewise, we could not include Lohr 2012 in the analysis as it was a multi‐armed study. It showed that overall survival for the gemcitabine alone arm was 6.8 months, compared to 8.1 months in combination with liposomal paclitaxel 11 mg/m², 8.7 months in combination with liposomal paclitaxel 22 mg/m² and 9.3 months in combination with liposomal paclitaxel 44 mg/m². When comparing each combination arm with gemcitabine alone the HRs all crossed the line of null effect: for concomitant doses of 11 mg/m²: HR 0.93 (95% CI 0.60 to 1.43); for 22 mg/m²: HR 0.69 (95% CI 0.44 to 1.07); and for 44 mg/m²: HR 0.66 (95% CI 0.43 to 1.03). PFS in the gemcitabine alone group was 2.7 months compared with each of the combination arms: 4.1 months, 4.6 months and 4.4 months (11 mg/m², 22 mg/m² and 44 mg/m², respectively). When comparing each experimental arm with gemcitabine alone for PFS, the HRs were 0.84 (95% CI 0.44 to 1.28), 0.58 (95% CI 0.38 to 0.90) and 0.74 (95% CI 0.49 to 1.13), respectively. The number of responses were similar in all groups (14%, 14%, 14% and 16%, respectively). Neutropenia and fatigue were the commonest AEs and occurred at similar rates across the four groups. The trials did not report QoL. Toxicity was more common in the combination arm with a dose dependent increase in thrombocytopenia, chills and pyrexia.
Although there were insufficient details to make an assessment of selection bias, overall we assessed the study as being at low risk of bias, the main source being due to the non‐blinded study design, which we considered to not affect the results.
3.5 Gemcitabine plus other combinations of chemotherapy versus gemcitabine alone
Two studies reported OS data on 166 participants which showed improved survival in the combination group (HR 0.55, 95% CI 0.39 to 0.79, P = 0.001; Analysis 3.1). There was some statistical heterogeneity (I² = 24%). Both studies reported PFS and again showed a benefit to the combination arm, with an HR of 0.43 (95% CI 0.30 to 0.62, P < 0.001, I² = 17%; Analysis 3.2). Median survival times were only available for Petrioli 2015, who reported that the combined treatment group survived for a median of 11.9 months versus 7.1 months in the gemcitabine alone group (Table 3). Only Petrioli 2015 reported response rates in 67 participants (12 responses versus 6 responses: RR 1.94, 95% CI 0.83 to 4.56, P = 0.13; Analysis 3.3). The same study reported grade 3/4 AEs. Although AEs were more common in the combination arm, the small number of events makes it difficult to assess the real difference between the arms: anaemia (6 events versus 3 events: RR 1.94, 95% CI 0.53 to 7.13, P = 0.32; Analysis 3.4), neutropenia (8 events versus 4 events: RR 1.94, 95% CI 0.65 to 5.83, P = 0.24; Analysis 3.5), thrombocytopenia (10 events versus 5 events: RR 1.94, 95% CI 0.74 to 5.07, P = 0.11; Analysis 3.6) and nausea (5 events versus 0 events: RR 10.69, 95% CI 0.61 to 185.91, P = 0.10; Analysis 3.7).
Both studies reported QoL data. Petrioli 2015 used the EORTC QLQ C30 and McGill Melzack questionnaires, and Reni 2005 used the EORTC‐QLQ Pan 26 questionnaire. Petrioli 2015 showed that global QoL was improved in the combined treatment group at two and four months. Reni 2005 stated that the sample size was insufficient to obtain statistical power to detect differences between the control and treatment groups. However, the treatment group had better average emotional functioning, overall QoL, cognitive measures, pain, fatigue, indigestion, dyspnoea, appetite loss and flatulence, while sexual function and body image were better in the control group (Table 3).
Petrioli 2015 did not publish enough data to make a full assessment of selection bias and had a high risk of performance and detection bias. Reni 2005 was a non‐blinded study but otherwise had a low risk of bias.
3.6 Gemcitabine plus other agent(s) versus gemcitabine alone
Four studies assessed OS in 767 participants, with no differences in survival detected (HR 0.79, 95% CI 0.56 to 1.10, P = 0.16; I² = 62%; Analysis 3.1). Only Meng 2012 reported PFS data in 76 people, with no differences seen, HR 1.05 (95% CI 0.68 to 1.62, P = 0.83; Analysis 3.2). Median survival times in the gemcitabine group ranged from 5.2 months to 9.7 months and in the combination group from 5.2 months to 10.4 months (Table 3). Three studies reported response rates in 691 participants (61 responses versus 22 responses: with RR 3.66, 95% CI 1.04 to 12.82, P = 0.04; Gansauge 2002; Meng 2012; Oettle 2005; Analysis 3.3). Three studies reported haematological toxicity data for grade 3/4 events in 688 participants revealing more anaemia in the combination arm (Meng 2012; Oettle 2005; Ueno 2013 – EPA study): anaemia (49 events versus 12 events: RR 3.58, 95% CI 1.93 to 6.62, P < 0.001; Analysis 3.4), neutropenia (140 events versus 45 events: RR 2.02, 95% CI 0.88 to 4.66, P = 0.10; Analysis 3.5), and thrombocytopenia (55 events versus 23 events: RR 1.41, 95% CI 0.45 to 4.39, P = 0.56; Analysis 3.6). Four studies reported on nausea in 748 participants (17 events versus 11 events: RR 1.25, 95% CI 0.48 to 3.26, P = 0.64; Analysis 3.7).
Two studies reported on QoL: Meng 2012 used the FACT‐G and MD Anderson Symptom Inventory questionnaires, and Oettle 2005 used the EORTC QLQ‐C30 questionnaire. Meng 2012 did not find a difference in either of the scales used (FACT‐G and MD Anderson Symptom Inventory questionnaire) at eight weeks. Oettle 2005 showed that people in the gemcitabine alone group had lower financial difficulties and better physical and cognitive functioning, but the combination arm had lower pain scores. There was no clear trend in QoL scores between the treatment groups, however (Table 3).
There was an unclear risk of selection bias in Gansauge 2002 and Meng 2012 due to insufficient details being published. Ueno 2013 – EPA study did not provide enough details to perform a comprehensive assessment.
4 Fluoropyrimidine combinations versus fluoropyrimidine alone
Four studies reported OS in 491 participants receiving either fluoropyrimidine combinations or fluoropyrimidine alone with no differences in survival detected (HR 0.84, 95% CI 0.61 to 1.15, P = 0.27; Analysis 4.1). There was high statistical heterogeneity with an I² of 66%. Ducreux 2004, which studied 5FU with or without oxaliplatin, showed a large benefit in the treatment group in contrast to the other three studies, which did not show much benefit with the combination arms. Only two studies reported PFS in 255 participants, and there were no differences (HR 0.52, 95% CI 0.19 to 1.38, P = 0.19; Analysis 4.2), again, with large statistical heterogeneity (I² = 89%). Median survival times ranged from 3.7 months to 6.5 months in the combination group and from 3.4 months to 5.25 months in the 5FU group (Table 4). All four studies reported response rates, but there were no differences between arms (32 responses versus 24 responses: RR 1.18, 95% CI 0.52 to 2.68, P = 0.10; I² = 52%; Analysis 4.3). Two studies (N = 255) reported rates of grade 3/4 anaemia, neutropenia, thrombocytopenia, nausea, and diarrhoea (Ducreux 2004; Maisey 2002). There were no significant differences between groups in: anaemia (8 events versus 11 events: RR 0.48, 95% CI 0.06 to 3.62, P = 0.16; Analysis 4.4); neutropenia (7 events versus 0 events: RR 5.70, 95% CI 0.73 to 44.46, P = 0.10; Analysis 4.5); thrombocytopenia (5 events versus 3 events: RR 1.40, 95% CI 0.34 to 5.80, P = 0.65; Analysis 4.6); nausea (7 events versus 5 events, RR 1.06, 95% CI 0.32 to 3.53, P = 0.93; Analysis 4.8); or diarrhoea (6 events versus 6 events: RR 0.92, 95% CI 0.31 to 2.78, P = 0.89; Analysis 4.9). Maisey 2002 reported similar rates of grade 3/4 fatigue in both arms (26 events versus 30 events: RR 0.91, 95% CI 0.58 to 1.43, P = 0.68; Analysis 4.7).
| Study | Fluoropyrimidine combination details | Median survival:fluoropyrimidine combination vs fluoropyrimidine alone (months) | Quality of life |
| 5FU + oxaliplatin | 3.7 vs 3.4 | Not addressed | |
| 5FU + BCNU | Not stated | Not addressed | |
| 5FU + MMC | 6.5 vs 5.1 | EORTC‐QLQ C30 showed that at 24 weeks, global QoL was superior in the combination arm compared to baseline (P = 0.035), and the pain score was also improved (P = 0.048). There was less dyspnoea at 12 weeks in the combination arm when compared to baseline (P = 0.033). | |
| 5FU + streptozocin | 4.5 vs 5.25 | Not addressed |
5FU: fluorouracil; BCNU: bis‐chloroethylnitrosourea (carmustine); EORTC QLQ‐C30: European Organisation for Research and Treatment of Cancer quality of life questionnaire for cancer patients; MMC: 5FU+doxorubicin + mitomycin C; QoL: quality of life.
One study recorded QoL data (Maisey 2002), using the EORTC‐QLQ C30 questionnaire, which did not demonstrate a difference between the two groups at baseline, 12 weeks or 24 weeks (Table 4).
The main source of bias was in the non‐blinded study design. We assessed both Ducreux 2004 and Kovach 1974 as being at high risk of attrition bias, and this may have affected the results.
5 Single studies addressing unique treatment comparisons
Ten studies addressed unique comparisons that could not be categorised under the above‐mentioned comparisons (Table 5).
| Study | Treatment arms/no. of participants | Survival outcomes | Response rates | Adverse events | Quality of life |
| Multi‐armed studies | |||||
| Capecitabine/oxaliplatin (n = 61) versus capecitabine/gemcitabine (n = 64) versus modified gemcitabine/oxaliplatin (n = 63) | OS: 8.1 vs 9.0 v 6.9 months PFS 4.2 vs 5.7 v 3.9 months | PR 13% vs 25% vs 13% SbD: 36% vs 39% vs 43% | Haematological AEs more common in the gemcitabine containing arms | Not studied | |
| 5FU (n = 50) versus 5FU/doxorubicin (n = 44) versus 5FU/doxorubicin/mitomycin C (n = 50) | Median survival of 22 weeks in all treatment groups | 30% vs 30% vs 7.7% | Haematological AEs more common in the 5FU and 5FU/doxorubicin arm, however the subgroup with PC were not reported separately. | Not studied | |
| 5FU (n = 64) versus 5FU/cyclophosphamide/methotrexate 'Mallinson Regimen' (n = 61) versus 5FU/doxorubicin/cisplatin 'FAP' (n = 59) | OS: 3.5 vs 4.5 vs 3.5 months respectively PFS: 2.5 vs 2.5 vs 2.5 months | 7% vs 21% vs 15% | More AEs reported in the combination arms compared with 5FU alone | Not studied | |
| Gemcitabine (fixed dose rate) (n = 64) versus infusional gemcitabine + cisplatin (n = 66) versus infusional gemcitabine + docetaxel (n = 65) versus infusional gemcitabine + irinotecan (n = 60) | OS: 6.4 vs 6.7 vs 6.4 vs 7.1 months, respectively. Time to progression: 3.3 vs 4.5 vs 4.1 vs 4.0 months | 14 vs 12.5 vs 12 vs 14% | Neutropenia and fatigue most common AE and same in all groups | Not studied | |
| Other studies | |||||
| Gemcitabine/oxaliplatin (n = 20) vs simplified gemcitabine/oxaliplatin (n = 37) | OS: 3.2 vs 7.6 months PFS: 2.5 vs 4.0 months | PR: 10% vs 27% SbD: 45% vs 43% | Peripheral neuropathy more common in the simplified GemOx arm | Not studied | |
| Mitomycin C/5FU (MF) (n = 73) vs Streptozocin/mitomycin C/5FU (SMF) (n = 72) | OS: 17 vs 18 weeks | PR: 8% v 34% | More gastrointestinal and renal toxicity in the SMF arm | Not studied | |
| Standard nab‐paclitaxel and gemcitabine (n = 75) vs sequential nab‐paclitaxel and gemcitabine (n = 71) | OS: 7.9 vs 10.1 months (HR 0.88) PFS: 4.0 vs 5.8 months (HR 0.66) | PR: 33% vs 50% SbD: 28% vs 42% | Neutropenia more common in the sequential arm | QoL score dropped by −12.1 points at 24 weeks in the standard arm vs −2.1 in the sequential arm | |
| Gemcitabine 3‐week schedule (n = 45) vs gemcitabine 4‐week schedule (n = 45) | OS: 250 vs 206 days PFS: 114 vs 112 days | 17.1% vs 14.2% | Thrombocytopenia more common in the 4‐week schedule | Not studied | |
| Streptozocin/mitomycin C/5FU (SMF) (n = 42) vs cisplatin/ara‐C/caffeine (CAC) (n = 40) | OS: 10 vs 5 months | 10% vs 6% | Nausea and vomiting more common in CAC arm. | Not studied | |
| 5FU constant infusion vs 5FU constant infusion/cisplatin versus 5FU chronomodulated infusion vs 5FU chronomodulated infusion/cisplatin (no cisplatin n = 55, with cisplatin n = 52) | OS: 5.4 vs 8.3 months (no cis vs cis) OS: 6.1 vs 6.7 months (continuous vs chronomodulated) PFS: 2.1 vs 3.2 months | Not reported | Cisplatin increased rates of haematological AEs. Chronomodulated regimen increased rates of mucositis | Not studied | |
| Gemcitabine + docetaxel (n = 49) vs cisplatin + docetaxel (n = 47) | OS: 7.0 vs 7.5 months PFS: 3.9 vs 2.8 months | 19.4% vs 23.5% | Febile neutropenia more common in the cisplatin/docetaxel arm | Not studied | |
| Streptozocin + 5FU (n = 40) vs streptozocin + cyclophosphamide (n = 48) | OS: 13 vs 9 weeks | CR: 3 vs 6 PR: 2 vs 0 SbD: 9 vs 9 | Haematological AEs more common in the cyclophosphamide arm | Not studied | |
| Capecitabine + cisplatin + gemcitabine + docetaxel (PDXG) (n = 53) vs capecitabine + cisplatin + gemcitabine + epirubicin (PEXG) (n = 52) | OS: 10.7 vs 11 months PFS: 7.4 vs 7.6 months | CR: 2 vs 4% PR: 58 vs 33% | Neutropenia more common in the PEXG arm | Not studied | |
| Epirubicin (n = 32) vs 5FU + epirubicin + mitomycin C (n = 30) | 1 year survival rates 15.4 vs 23.2% | 8% vs 11% | AEs were similar in both arms | Not studied | |
5FU: fluorouracil; AE: adverse event; CR: complete response; OS: overall survival; PC: pancreatic cancer; PR: partial response; SbD: stable disease.
Boeck 2008 showed that capecitabine plus gemcitabine had superior median survival (9.0 months) and response rate (25%) compared with 8.1 months/13% in the capecitabine/oxaliplatin group and 6.9 months/13% in the gemcitabine/oxaliplatin group. Haematological AEs were more common in the gemcitabine‐containing regimens.
Kulke 2009 showed a similar OS in all four treatment groups, ranging from 6.4 months to 7.1 months and response rates of 12% to 14%. AEs were similar across treatment arms, with neutropenia and fatigue being the most common.
Afchain 2009 found that a simplified gemcitabine/oxaliplatin regimen was superior to a standard gemcitabine/oxaliplatin regimen with an OS of 7.6 months versus 3.2 months and response rate of 27% versus 10%. Peripheral neuropathy was more common in the simplified arm, however.
Bukowski 1983 did not demonstrate a difference in OS for streptozocin/MMC/5FU (SMF) versus MMC/5FU (18 weeks versus 17 weeks); however, there was an increase in response rate of 34% versus 8%. There was more gastrointestinal and renal toxicity in the SMF arm.
Hirao 2011 showed a slight increase in OS for the three‐week schedule of gemcitabine versus the four‐week schedule (250 days versus 206 days), but there was a similar response rate (17.1% versus 14.2%). Thrombocytopenia was more common in the four‐week schedule.
Kelsen 1991 found that the SMF arm had a longer OS than the cisplatin/ara‐C/caffeine arm (10 months versus 5 months), but a similar response rate (10% versus 6%). Nausea and vomiting were more common in the caffeine‐containing arm.
Levi 2004 showed that adding cisplatin to 5FU increased OS (8.3 months versus 5.4 months), but there was no difference between the continuous versus the chronomodulated arms (6.1 months versus 6.7 months). Cisplatin increased the rates of haematological AEs, and the chronomodulated regimen increased rates of mucositis.
Lutz 2005 did not demonstrate any striking differences between gemcitabine/docetaxel and cisplatin/docetaxel (OS 7.0 months versus 7.5 months); however, febrile neutropenia was more common in the cisplatin containing arm.
Moertel 1977 showed a slightly increased OS in the streptozocin/5FU arm compared with streptozocin/cyclophosphamide (13 weeks versus 9 weeks), with the cyclophosphamide arm experiencing more haematological AEs.
Reni 2012 showed a similar OS between capecitabine/cisplatin/gemcitabine/docetaxel (PDXG) and capecitabine/cisplatin/gemcitabine/epirubicin (PEXG) (10.7 months versus 11 months); however, there was a higher partial response rate in the PDXG group (58% versus 33%). The PEXG arm had more neutropenia.
Topham 1991 found a slightly higher one‐year survival rate in the 5FU/epirubicin/MMC arm compared with epirubicin alone (23.2% versus 15.4%), and the AEs were similar in both arms.
Discussion
Summary of main results
1 Anti‐cancer therapy versus best supportive care
We could neither prove nor rule out a survival benefit for anti‐cancer therapy versus BSC alone (moderate‐quality evidence due to imprecision; summary of findings Table for the main comparison). This is in contrast to the previous version of this review, which found a benefit in the odds for death at both 6 months (OR 0.37, 95% CI 0.25 to 0.57, P < 0.001) and 12 months (OR 0.46, 95% CI 0.25 to 0.84, P = 0.01). Due to the new protocol used in this study, we excluded two studies that had featured in the previous review because they included people without histological confirmation (Mallinson 1980; Palmer 1994); this is the likely cause of these discrepant results. The differences in median survival were modest and ranged from 0.9 months in favour of BSC to 3.5 months in favour of anti‐cancer therapy (Table 1).
There is evidence for improved QoL with the use of anti‐cancer therapy in one study (Glimelius 1996), with Xinopoulos 2008 showing an early benefit that was not sustained after month 5.
Readers should interpret these results with caution, as the included studies span over 30 years, and Xinopoulos 2008 was the only study to use contemporary chemotherapy regimens. As it is unlikely that further studies will be conducted using BSC as the control arm, additional randomised data showing the effects of contemporary chemotherapy over BSC in the first‐line setting may never be generated.
2 Various types of chemotherapy versus gemcitabine
The one study addressing gemcitabine versus 5FU chemotherapy, Burris 1997, showed inferior outcomes for OS (HR 1.69; P = 0.004), PFS (HR 1.47; P = 0.005) and QoL with the 5FU arm. summary of findings Table 2 shows a rating of moderate‐quality evidence due to only one small study being available for analysis. These results demonstrate that using gemcitabine reduces the risk of death by 41% and progression by 32% compared with 5FU therapy. The absolute improvement in OS is modest at just over one month. Gemcitabine may result in more grade 3/4 AEs. There is an improvement in QoL (clinical benefit response).
The analysis of two studies comparing FOLFIRINOX versus gemcitabine demonstrated an improvement in OS (HR 0.51; P < 0.001), PFS (HR 0.46; P < 0.001) and response rate (RR 3.38; P < 0.001) but also significantly more neutropenia and thrombocytopenia (Conroy 2011; Singhal 2014). There was improved QoL. summary of findings Table 2 demonstrates the moderate quality of evidence rating based on inconsistency. These results suggest that FOLFIRINOX reduces the risk of death by 49%, reduces the risk of progression by 54% and triples the rate of response compared with gemcitabine. The absolute survival gains are still modest, with OS in the gemcitabine alone arm ranging from 6.8 months to 7.4 months and in the FOLFIRINOX arms between 10.8 months to 11.1 months.
The two studies that assessed the effects of giving gemcitabine at a fixed dose rate showed an improvement in OS (HR 0.79; P = 0.009) but also more haematological toxicity (Poplin 2009; Tempero 2003). Granted, the 'standard' gemcitabine arms differed between the two studies, but the study using a more intense control arm (gemcitabine 2200 mg/m² weekly) still found superiority in the FDR‐gem arm. summary of findings Table 2 details a high quality of evidence rating. This analysis suggests that using FDR‐gem reduces the risk of death by 21%; however, the absolute survival gains are again small, with OS in the standard infusional gemcitabine arm ranging from 4.9 months to 5.0 months and in the FDR‐gem arm from 6.2 months to 8.0 months.
The studies comparing exatecan, CO‐101 and ZD9331 to gemcitabine did not show a survival benefit (Cheverton 2004; Poplin 2013; Smith 2003). None of these studies showed a difference in toxicity and in exatecan, analyses showed QoL to be superior in the gemcitabine arm. We rated each comparison as having moderate‐quality evidence due to imprecision (summary of findings Table 2).
3 Gemcitabine combination studies
3.1 Gemcitabine plus a platinum agent versus gemcitabine alone
The analysis of seven studies has shown that the combination of gemcitabine with a platinum agent did not significantly improve OS (HR 0.94; P = 0.38) but may improve PFS (HR 0.80; P = 0.01) (Colucci 2002; Colucci 2010; Heinemann 2006; Louvet 2005; Viret 2004; Wang 2002). This equates to a reduction in the risk of progression of 20%. summary of findings Table 3 shows that the quality of evidence in this analysis was low, due to two studies being in abstract form and not publishing sufficient data to make a full assessment, along with imprecision. These results are in keeping with the findings of the previous review, which found a benefit in 6‐month mortality (OR 0.59, P = 0.001) but not 12‐month mortality. We were not able to include all the studies from the previous review (Li 2004 did not publish sufficient data); however, we included two additional studies (Colucci 2010; Viret 2004). The addition of platinum improved response rates but increased thrombocytopenia and nausea. There were no significant differences found in QoL between the control and treatment arms in the people tested. This suggests that while adding platinum increases side effects, this does not translate into a worse QoL. The median survival times were similar in the two groups (Table 3).
3.2 Gemcitabine plus fluoropyrimidine versus gemcitabine alone
The analysis of 10 studies shows that adding a fluoropyrimidine agent can improve OS (HR 0.88; P = 0.001), PFS (0.79; P < 0.001) and response rate (RR 1.78; P < 0.001), but at the cost of increased rates of neutropenia and diarrhoea (Berlin 2002; Cunningham 2009; Di Costanzo 2005; Herrmann 2007; Lee 2017; Ohkawa 2004; Ozaka 2012; Riess 2005; Scheithauer 2003; Ueno 2013). summary of findings Table 3 show that the quality of evidence is high. This shows that the addition of 5FU reduces the risk of death by 12%, reduces the risk of progression by 21% and nearly doubles the rate of response, but it also increases toxicity. Two studies did not report any differences in QoL with the addition of a fluoropyrimidine agent; however, two studies did report an improvement, with Scheithauer 2003 showing less pain and Ueno 2013 showing an improvement in QALYs. The previous version of this review did not find significant benefits for adding fluoropyrimidine to gemcitabine; however, that version analysed only 5 studies, compared to the 10 studied here. Because this analysis included both intravenous and oral fluoropyrimidine agents, these results must be interpreted with caution. Moreover, two studies used S1 (Ozaka 2012; Ueno 2013), and one study used UFT (Ohkawa 2004), agents that have not been well studied in non‐Asian populations. The absolute improvement in OS is small, ranging from 5.4 months to 8.8 months in the gemcitabine alone arm and 6.7 months to 13.7 months in the combination arm (Table 3).
3.3 Gemcitabine plus topoisomerase inhibitor versus gemcitabine alone
The analysis of three studies shows that the addition of a topoisomerase inhibitor to gemcitabine does not significantly improve OS (HR 1.01; P = 0.92) or PFS (HR 0.91; P = 0.26) (Abou‐Alfa 2006; Rocha Lima 2004; Stathopoulos 2006). Response rates were also not significantly improved (RR 1.50; P = 0.11); however, neutropenia did. Only one study measured QoL and failed to find any differences between the two groups. The median survival times were similar in the two groups (Table 3).
We assessed the quality of evidence as high (summary of findings Table 3).
3.4 Gemcitabine plus taxane versus gemcitabine alone
Our search yielded only one study that we could analyse in this category (Von Hoff 2013), and it found that adding nab‐paclitaxel to gemcitabine significantly improved OS (HR 0.72; P < 0.001), PFS (HR 0.69; P < 0.001) and response rates (RR 3.29; P < 0.001). summary of findings Table 3 show that the quality of evidence is high; however, there is only one study. This demonstrates that the addition of nab‐paclitaxel to gemcitabine reduces the risk of death by 28%, reduces the risk of progression by 31% and more than triples the rate of response. There is an increased risk of neutropenia, neuropathy and fatigue, and QoL was not measured. Although there is only one study in this analysis, there was also another study, Corrie 2017, which we could not include; it used gemcitabine plus nab‐paclitaxel as the control group and published similar OS, PFS and response data.
3.5 Gemcitabine plus other combinations of chemotherapy versus gemcitabine alone
The two studies analysed showed that combining gemcitabine with multiple other agents improves OS (HR 0.55; P = 0.001) and PFS (HR 0.43; P < 0.001) (Petrioli 2015; Reni 2005). Only one study reported response rates, which were not different between groups. Likewise, one study reported similar incidence of AEs. QoL was improved in both studies. summary of findings Table 3 shows the low rating for quality of evidence due to one study not publishing enough data to make a full assessment and because of inconsistency. Given that only one study reported response rates and grade 3/4 AEs, the numbers of events in these analyses are small, and the conclusions that we can draw here are limited. This analysis suggests that the use of combination therapies containing gemcitabine may reduce the risk of death by 45% and reduce the risk of progression by 57%; however, we cannot make any assessment regarding the rates of side effects. There may be an improvement in QoL. Just one study reported median survival times, showing OS in the gemcitabine arm to be 7.1 months compared with 11.9 months in the combination arm (Table 3).
Multi‐drug combinations including gemcitabine may be effective in improving survival outcomes, and given the positive results of the Conroy 2011 study, which uses FOLFIRINOX, the findings add weight to the argument that intensive chemotherapy has a place in the treatment of PC.
3.6 Gemcitabine plus other agent(s) versus gemcitabine alone
This group contains studies that did not fall into any of the other pooled analyses. The four studies analysed here are heterogenous in terms of the agents used (Gansauge 2002; Meng 2012; Oettle 2005; Ueno 2013 – EPA study). The analysis shows that OS is not significantly different in the combination arm. Three studies show improved response rates but also increased anaemia. There was high statistical heterogeneity seen in both survival analyses, which is likely to be accounted for by the varied agents used. QoL was not significantly different in the two studies that reported this outcome. Median survival times were longer in the Gansauge 2002 study but otherwise very similar (Table 3).
These data need to be interpreted with caution, as the studies used a wide range of agents. The results for Ukrain in Gansauge 2002 are highly provocative and may warrant further study in larger numbers, supported by a meta‐analysis across different cancer types (Ernst 2005). We assessed the quality of evidence as low due to imprecision and inconsistency (summary of findings Table 3).
4 Fluoropyrimidine combinations versus fluoropyrimidine alone
This analysis showed that pooling data from studies that added an agent to 5FU did not result in a significant benefit in OS (HR 0.84; P = 0.27) or PFS (0.52; P = 0.19) compared to 5FU alone (Ducreux 2004; Kovach 1974; Maisey 2002; Moertel 1979). However, in these two analyses, there was high statistical heterogeneity (I² = 66% and 89%, respectively), likely due to the range of agents tested. Three studies used fairly outdated chemotherapies (BCNU, MMC and streptozocin), whereas one study used oxaliplatin (Ducreux 2004). This study accounts for most of the heterogeneity seen, as it found a statistically significant benefit in both OS and PFS in contrast to the other studies. Response rates were not significantly improved (RR 1.18; P = 0.69), again with high statistical heterogeneity that was mainly due to the Kovach 1974 study, testing BCNU and reporting higher responses in the 5FU alone group. Grade 3/4 AEs were not significantly different between the two groups. Only Maisey 2002 assessed QoL, demonstrating an improvement in dyspnoea.
The conclusions that we can draw from this analysis are limited. It seems that from the results of the Ducreux 2004 study, oxaliplatin plus 5FU is an active combination compared with 5FU alone and does not measurably increase side effects.
The quality of evidence was assessed as low due to imprecision and statistical heterogeneity (summary of findings Table 4).
Overall completeness and applicability of evidence
To our knowledge, this review contains a complete review of all the available evidence up until the censor date. We have made every attempt to conduct the analysis in a clinically relevant way in order to fulfil the objective of assisting patients and clinicians in decision‐making.
Quality of the evidence
Two review authors independently assessed the risk of bias of the individual studies using the GRADE criteria, and we tabulate this information in Figure 2, Figure 3 and the 'Summary of findings' tables. Only four subgroup comparisons were of high quality, whereas the remainder of the comparisons provided moderate‐ or low‐quality evidence. This was mainly due to inconsistency and small sample sizes. Given PC is a rare condition which is commonly seen in the elderly, recruiting to clinical studies is incredibly difficult. In addition, recent large scale sequencing studies have revealed the marked genetic heterogeneity in PC, which is likely to contribute to the inconsistent effects seen between studies (Bailey 2016). This should guide future studies and encourage stratified study design.
Potential biases in the review process
In order to reduce the potential biases in the review process, two separate review authors independently evaluated studies and extracted data, resolving disputes with adjudication by a third review author. We did not identify any other potential biases.
Agreements and disagreements with other studies or reviews
Unlike the previous version of this review (Yip 2009), we were unable to replicate the benefit seen for anti‐cancer therapy versus best supportive care alone. As discussed in the main text, this was mainly due to the fact we were unable to include all the previously analysed studies due to lack of available time‐to‐event data.
We have added to the scope and results of the previous review by widening the inclusion criteria and have been able to provide wider recommendations.

1 Study flow diagram.
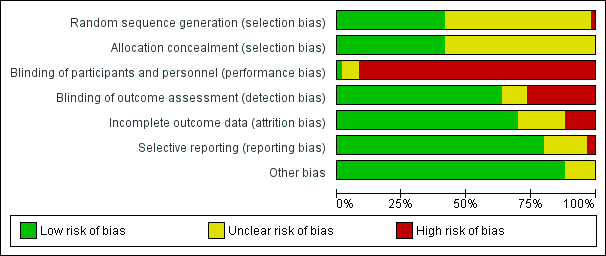
Risk of bias graph: review authors' judgements about each risk of bias item presented as percentages across all included studies.

Risk of bias summary: review authors' judgements about each risk of bias item for each included study.
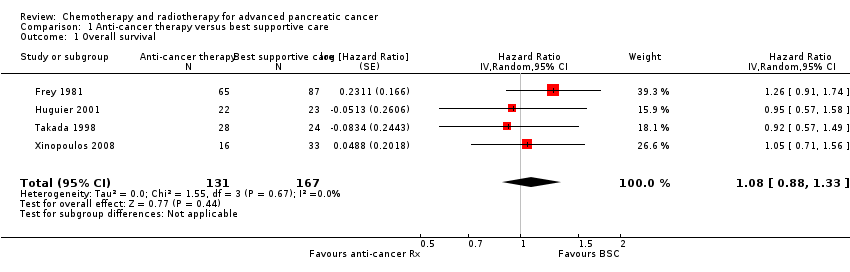
Comparison 1 Anti‐cancer therapy versus best supportive care, Outcome 1 Overall survival.

Comparison 2 Various types of chemotherapy versus gemcitabine, Outcome 1 Overall survival.

Comparison 2 Various types of chemotherapy versus gemcitabine, Outcome 2 Progression‐free survival.
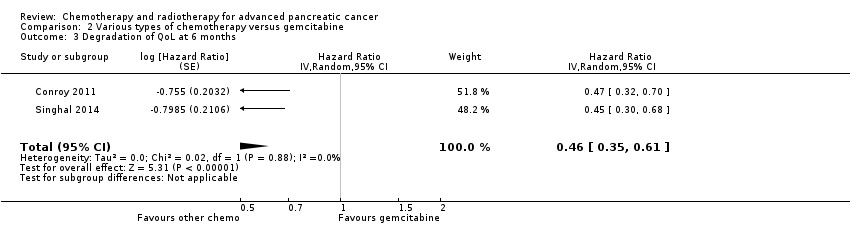
Comparison 2 Various types of chemotherapy versus gemcitabine, Outcome 3 Degradation of QoL at 6 months.
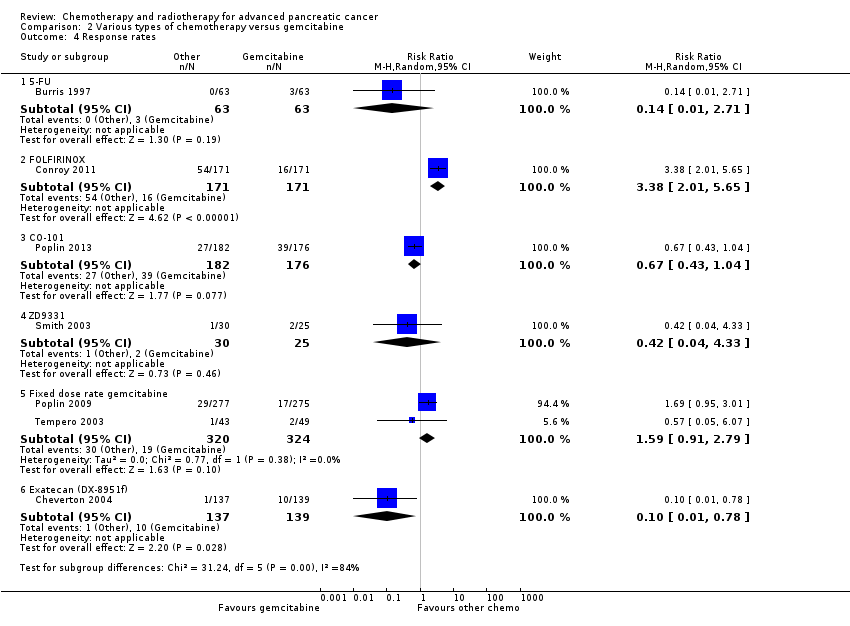
Comparison 2 Various types of chemotherapy versus gemcitabine, Outcome 4 Response rates.

Comparison 2 Various types of chemotherapy versus gemcitabine, Outcome 5 Grade 3/4 anaemia.

Comparison 2 Various types of chemotherapy versus gemcitabine, Outcome 6 Grade 3/4 neutropenia.

Comparison 2 Various types of chemotherapy versus gemcitabine, Outcome 7 Grade 3/4 thrombocytopenia.

Comparison 2 Various types of chemotherapy versus gemcitabine, Outcome 8 Grade 3/4 nausea.
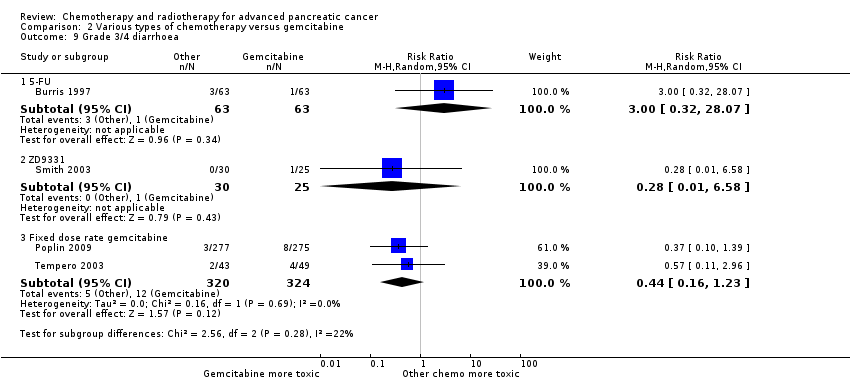
Comparison 2 Various types of chemotherapy versus gemcitabine, Outcome 9 Grade 3/4 diarrhoea.
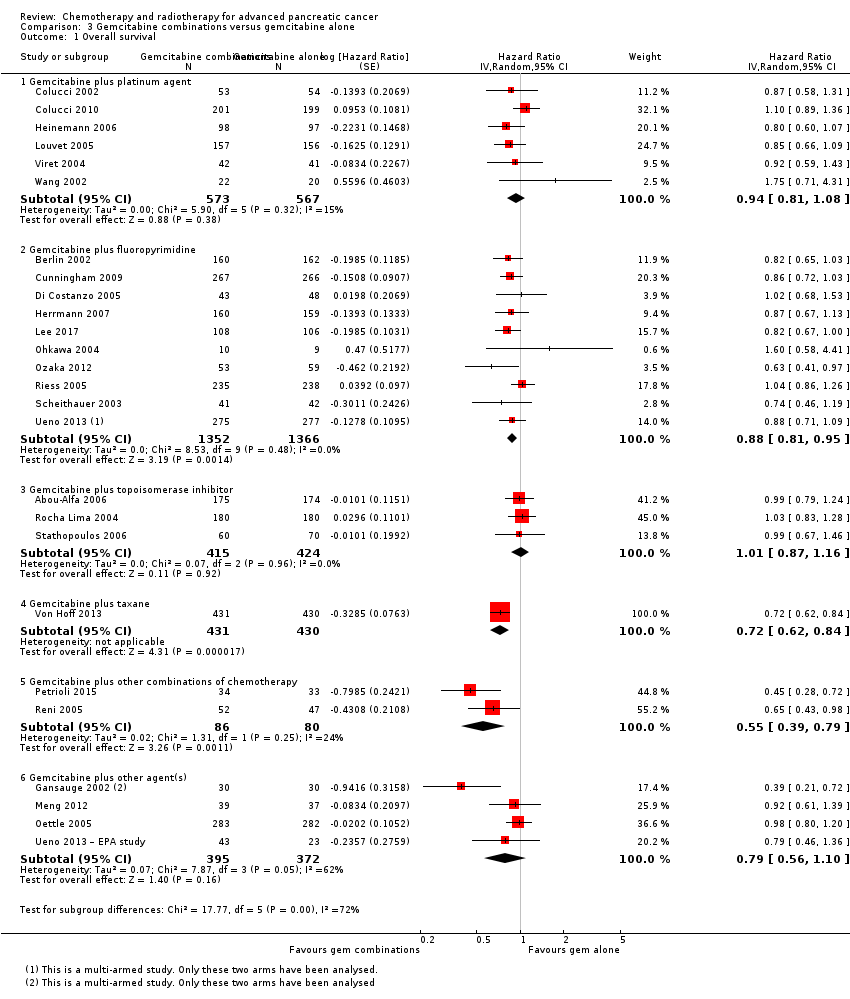
Comparison 3 Gemcitabine combinations versus gemcitabine alone, Outcome 1 Overall survival.
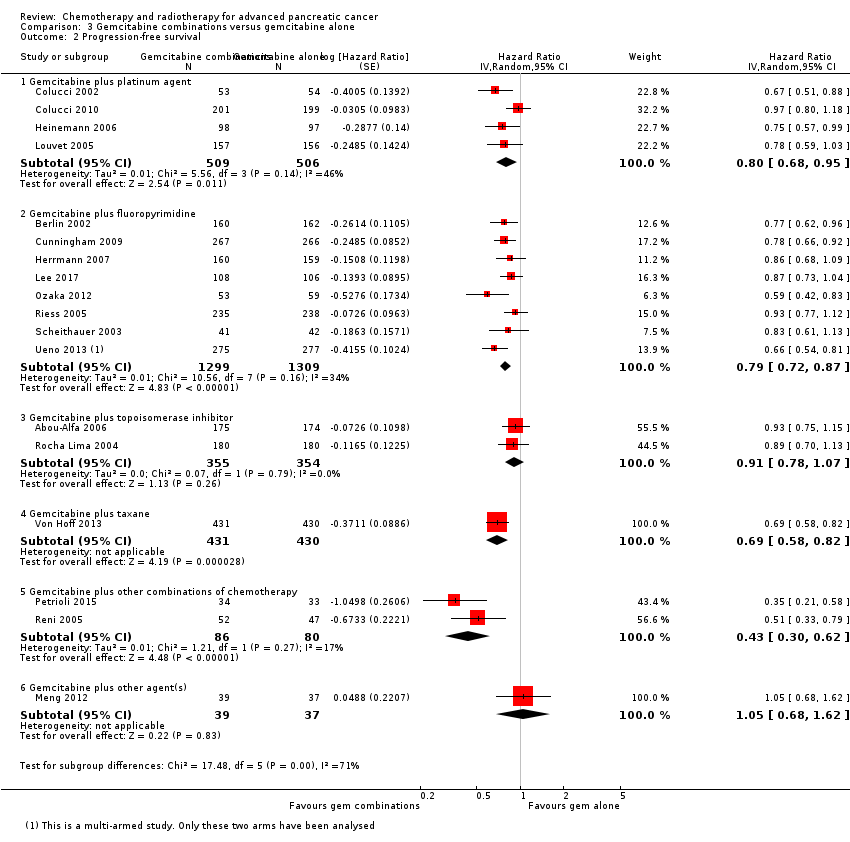
Comparison 3 Gemcitabine combinations versus gemcitabine alone, Outcome 2 Progression‐free survival.

Comparison 3 Gemcitabine combinations versus gemcitabine alone, Outcome 3 Response rates.

Comparison 3 Gemcitabine combinations versus gemcitabine alone, Outcome 4 Grade 3/4 anaemia.
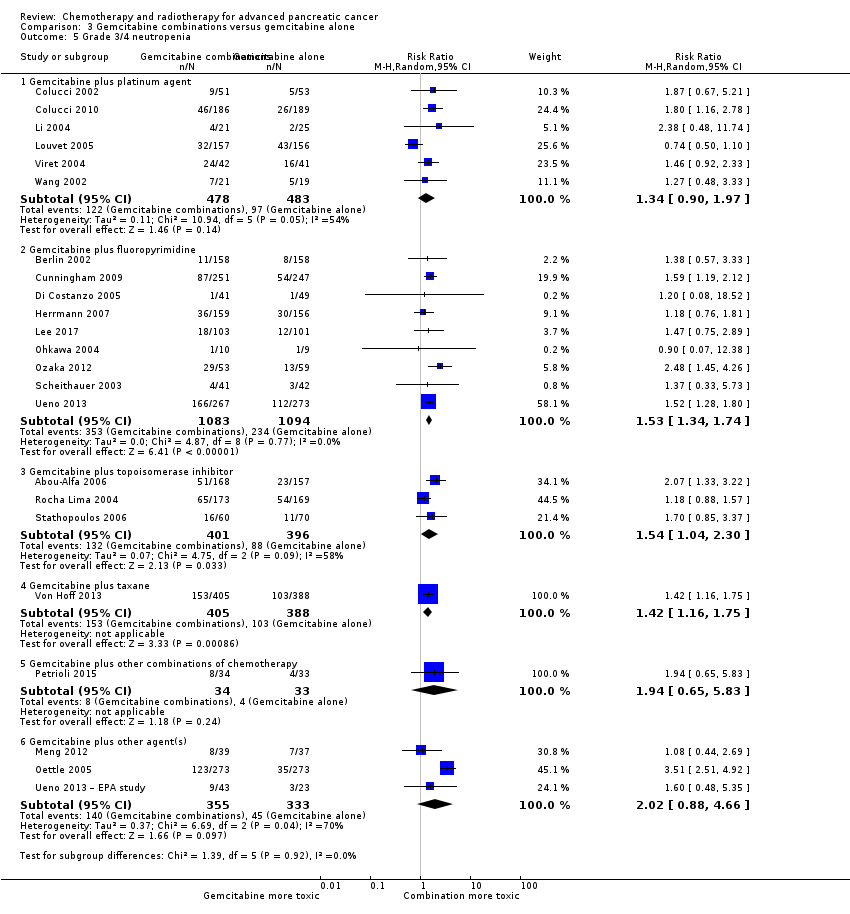
Comparison 3 Gemcitabine combinations versus gemcitabine alone, Outcome 5 Grade 3/4 neutropenia.

Comparison 3 Gemcitabine combinations versus gemcitabine alone, Outcome 6 Grade 3/4 thrombocytopenia.

Comparison 3 Gemcitabine combinations versus gemcitabine alone, Outcome 7 Grade 3/4 nausea.
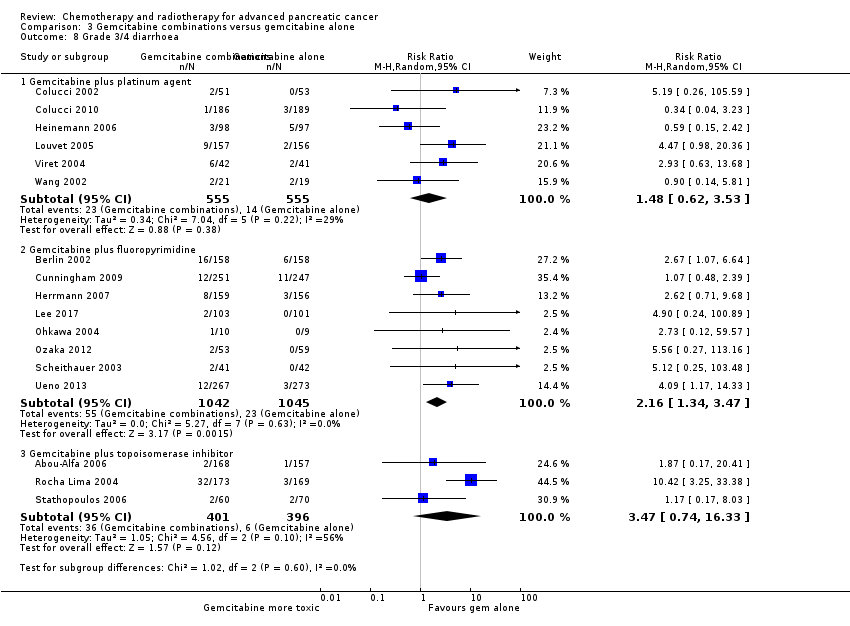
Comparison 3 Gemcitabine combinations versus gemcitabine alone, Outcome 8 Grade 3/4 diarrhoea.

Comparison 3 Gemcitabine combinations versus gemcitabine alone, Outcome 9 Grade 3/4 neuropathy.
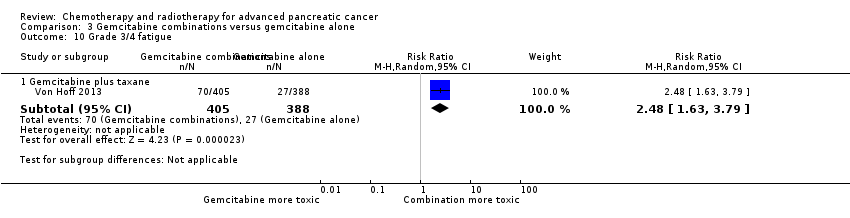
Comparison 3 Gemcitabine combinations versus gemcitabine alone, Outcome 10 Grade 3/4 fatigue.
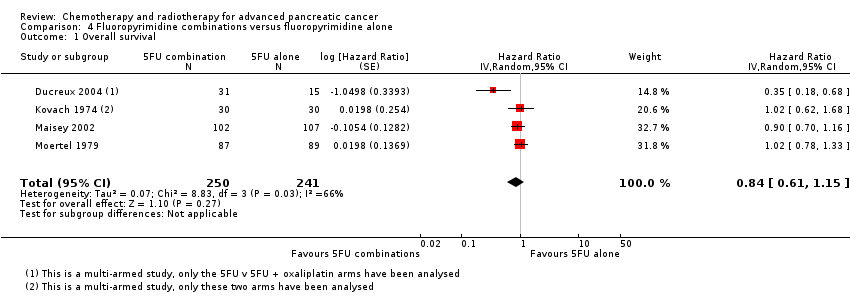
Comparison 4 Fluoropyrimidine combinations versus fluoropyrimidine alone, Outcome 1 Overall survival.
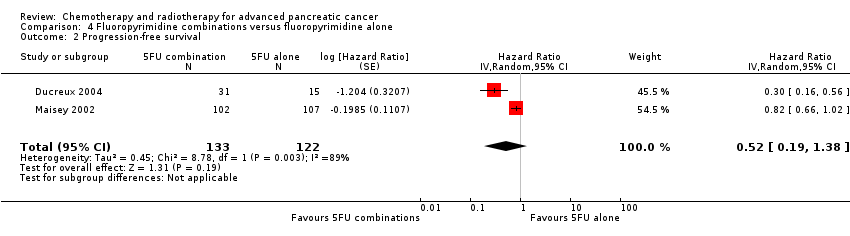
Comparison 4 Fluoropyrimidine combinations versus fluoropyrimidine alone, Outcome 2 Progression‐free survival.

Comparison 4 Fluoropyrimidine combinations versus fluoropyrimidine alone, Outcome 3 Response rates.
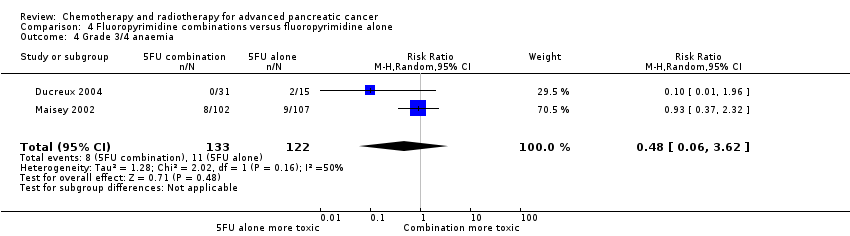
Comparison 4 Fluoropyrimidine combinations versus fluoropyrimidine alone, Outcome 4 Grade 3/4 anaemia.
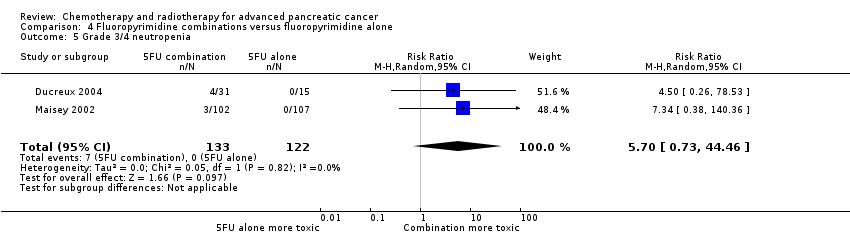
Comparison 4 Fluoropyrimidine combinations versus fluoropyrimidine alone, Outcome 5 Grade 3/4 neutropenia.

Comparison 4 Fluoropyrimidine combinations versus fluoropyrimidine alone, Outcome 6 Grade 3/4 thrombocytopenia.
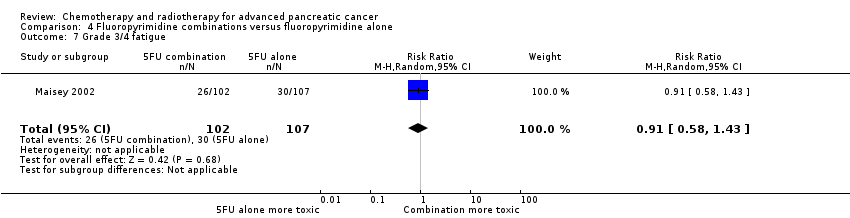
Comparison 4 Fluoropyrimidine combinations versus fluoropyrimidine alone, Outcome 7 Grade 3/4 fatigue.
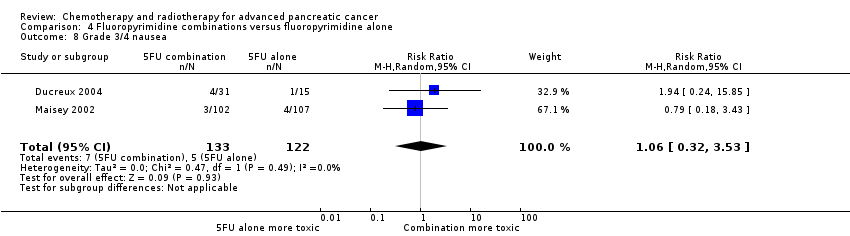
Comparison 4 Fluoropyrimidine combinations versus fluoropyrimidine alone, Outcome 8 Grade 3/4 nausea.

Comparison 4 Fluoropyrimidine combinations versus fluoropyrimidine alone, Outcome 9 Grade 3/4 diarrhoea.
| Anti‐cancer therapy versus best supportive care for advanced pancreatic cancer | |||||||
| Person or population: advanced pancreatic cancer | |||||||
| Outcomes | Anticipated risk of death* (95% CI) | Relative effect | № of participants | Quality of the evidence | Comments | Toxicity and QoL | |
| Risk with best supportive care | Risk with anti‐cancer therapy | ||||||
| Overall survival | Study population | HR 1.08 | 298 | ⊕⊕⊕⊝ | — | The analysis showed that toxicity data were inconsistently reported. Most studies reporting this outcome noted that gastrointestinal adverse events were the most frequent, occurring in between 15% to 31%. 1 study noted haematological toxicity was present in 81.5% of people. 2 out of the 3 studies that analysed QoL demonstrated a benefit with anti‐cancer therapy. 1 study showed no difference between the 2 groups. | |
| 707 per 1000 | 734 per 1000 | ||||||
| *The risk in the intervention group (and its 95% confidence interval) is based on the assumed risk in the comparison group and the relative effect of the intervention (and its 95% CI). | |||||||
| GRADE Working Group grades of evidence | |||||||
| aConfidence interval include both benefit and harm; optimal information size not met. | |||||||
| Various types of chemotherapy versus gemcitabine for advanced pancreatic cancer | |||||||
| Person or population: advanced pancreatic cancer | |||||||
| Outcomes | Anticipated risk of death* (95% CI) | Relative effect | № of participants | Quality of the evidence | Comments | Toxicity and QoL | |
| Risk with gemcitabine | Risk with various types of chemotherapy | ||||||
| Overall survival ‐ 5FU | Study population | HR 1.69 | 126 | ⊕⊕⊕⊝ | Only 1 study | More toxicity was seen in the gemcitabine arm. Clinical benefit was improved in the gemcitabine arm | |
| 825 per 1000 | 948 per 1000 | ||||||
| Overall survival ‐ FOLFIRINOX | Study population | HR 0.51 | 652 | ⊕⊕⊕⊝ | — | More toxicity was seen in the FOLFIRINOX arm. Longer time to degradation of QoL in FOLFIRINOX arm | |
| 794 per 1000 | 554 per 1000 | ||||||
| Overall survival ‐ Fixed dose rate gemcitabine | Study population | HR 0.79 | 644 | ⊕⊕⊕⊕ | — | More toxicity in the fixed‐dose rate arm. QoL was not tested | |
| 880 per 1000 | 812 per 1000 | ||||||
| Overall survival ‐ CO‐101 | Study population | HR 1.07 | 367 | ⊕⊕⊕⊝ | Only 1 study | Toxicity was similar in both arms, QoL was not tested | |
| 854 per 1000 | 872 per 1000 | ||||||
| Overall survival ‐ ZD9331 | Study population | HR 0.86 | 55 | ⊕⊕⊕⊝ | Only 1 study | Toxicity was similar in both arms, QoL was not tested | |
| 560 per 1000 | 506 per 1000 | ||||||
| Overall survival ‐ Exatecan | Study population | HR 1.27 | 339 | ⊕⊕⊕⊝ | Only 1 study | Toxicity was similar in both arms, QoL was superior in the gemcitabine arm | |
| 776 per 1000 | 851 per 1000 | ||||||
| *The risk in the intervention group (and its 95% confidence interval) is based on the assumed risk in the comparison group and the relative effect of the intervention (and its 95% CI). | |||||||
| GRADE Working Group grades of evidence | |||||||
| aSmall sample size; optimal information size not met. | |||||||
| Gemcitabine combinations versus gemcitabine alone for advanced pancreatic cancer | |||||||
| Person or population: advanced pancreatic cancer | |||||||
| Outcomes | Anticipated risk of death* (95% CI) | Relative effect | № of participants | Quality of the evidence | Comments | Toxicity and QoL | |
| Risk with gemcitabine alone | Risk with gemcitabine combinations | ||||||
| Overall survival ‐ Gemcitabine plus platinum agent | Study population | HR 0.94 | 1140 | ⊕⊕⊝⊝ | — | More toxicity in the combination arm with no differences shown in QoL | |
| 705 per 1000 | 683 per 1000 | ||||||
| Overall survival ‐ Gemcitabine plus fluoropyrimidine | Study population | HR 0.89 | 2718 | ⊕⊕⊕⊕ | — | More toxicity in the combination arm. 2 studies showed no difference in QoL, 2 studies showed an improved QoL in the combination arm | |
| 690 per 1000 | 648 per 1000 | ||||||
| Overall survival ‐ Gemcitabine plus topoisomerase inhibitor | Study population | HR 1.01 | 839 | ⊕⊕⊕⊕ | — | More toxicity in the combination arm. In 1 study, QoL was not different between the 2 arms | |
| 800 per 1000 | 803 per 1000 | ||||||
| Overall survival ‐ Gemcitabine plus taxane | Study population | HR 0.72 | 861 | ⊕⊕⊕⊕ | 1 study only | More toxicity in the combination arm. QoL not measured | |
| 779 per 1000 | 663 per 1000 | ||||||
| Overall survival ‐ Gemcitabine plus other combinations of chemotherapy | Study population | HR 0.55 | 166 | ⊕⊕⊝⊝ | — | Toxicity measured in 1 study and was not different. QoL was shown to be improved in the combination arms in both studies | |
| 850 per 1000 | 648 per 1000 | ||||||
| Overall survival ‐ Gemcitabine plus other agent(s) | Study population | HR 0.79 | 767 | ⊕⊕⊝⊝ | There was an increase in anaemia in the combination arm. 2 studies measured QoL and it was similar in both treatment arms | ||
| 825 per 1000 | 748 per 1000 | ||||||
| *The risk in the intervention group (and its 95% confidence interval) is based on the assumed risk in the comparison group and the relative effect of the intervention (and its 95% CI). | |||||||
| GRADE Working Group grades of evidence | |||||||
| aTwo studies were in abstract form and could not have full assessment completed. | |||||||
| Fluoropyrimidine combinations versus fluoropyrimidine alone for advanced pancreatic cancer | ||||||
| Person or population: advanced pancreatic cancer | ||||||
| Outcomes | Anticipated risk of death* (95% CI) | Relative effect | № of participants | Quality of the evidence | Toxicity and QoL | |
| Risk with fluoropyrimidine alone | Risk with fluoropyrimidine combinations | |||||
| Overall survival | Study population | HR 0.84 | 491 | ⊕⊕⊝⊝ | Toxicity was not different between the 2 treatment arms. QoL was measured in 1 study and showed an improvement in the combination arm | |
| 838 per 1000 | 783 per 1000 | |||||
| *The risk in the intervention group (and its 95% confidence interval) is based on the assumed risk in the comparison group and the relative effect of the intervention (and its 95% CI). | ||||||
| GRADE Working Group grades of evidence | ||||||
| aHigh statistical heterogeneity. | ||||||
| Study | Anti‐cancer therapy details | Median survival:anti‐cancer therapy vs best supportive care (months) | Quality of life |
| 5FU + CCNU | 5 vs 4 | No difference in Karnofsky performance status (KPS) score | |
| 5FU + CCNU | 3.0 vs 3.9 | Not addressed | |
| 5FU + LV | 6.0 vs 2.5 | EORTC QLQ‐C30 results favoured the anti‐cancer therapy (NB: high rate of dropouts in the later time points) | |
| 5FU + LV + cisplatin | 8.6 vs 7.0 | Not addressed | |
| 5FU + doxorubicin + MMC | 4.9 vs 5.0 | Not addressed | |
| Gemcitabine | 5.25 vs 5.5 | Superior QoL (EORTC QLQ‐C30) in the gemcitabine group during the 1st month (P = 0.028), no difference from the 2nd to the 4th month; in the 5th and 6th month superior QoL in the BSC group (P = 0.010 and < 0.001) | |
| 5FU: 5‐Fluorouracil; CCNU: chloroethylcyclohexylnitrosurea; EORTC QLQ‐C30: European Organisation for Research and Treatment of Cancer quality of life questionnaire for cancer patients; LV: leucovorin; MMC: 5FU+doxorubicin + mitomycin C | |||
| Study | Type of other chemotherapy | Median survival:other chemotherapy vs gemcitabine (months) | Quality of life |
| 5FU | 4.4 vs 5.7 | Improved clinical benefit 4.8% vs 23.8%. Median time to benefit 7 vs 3 weeks. Duration of benefit 18 vs 13 weeks | |
| FOLFIRINOX | 11.1 vs 6.8 | QLQ‐C30: decrease in Global Health Status and QoL scale at 3 months 17% vs 31%; at 6 months 31% vs 66% Median time to definitive deterioration: not reached vs 5.7 months | |
| FOLFIRINOX | 10.8 vs 7.4 | Definitive degradation of QoL at six months: 29% vs 59% | |
| CO‐101 | 5.2 vs 6.0 | Not addressed | |
| ZD‐9331 | 5.0 vs 3.6 | Not addressed | |
| Fixed dose rate gemcitabine 1500 mg/m² over 150 min | 6.2 vs 4.9 | Not addressed | |
| Fixed dose rate gemcitabine 1500 mg/m² at 10 mg/m²/min | 8.0 vs 5.0 | Not addressed | |
| Exatecan (DX‐8951f) | 5.0 vs 6.6 | Time to worsening of clinical benefit was longer in the gemcitabine group. Pain (3.7 vs 7.9 months; P = 0.0493), KPS (3.4 vs 4.6 months; P = 0.0111) and weight (2.3 vs 3.8 months; P = 0.0203). QoL measured with QLQ‐C3 and QLQ‐PAN26 were similar in the 2 groups | |
| 5FU: 5‐Fluorouracil; FOLFIRINOX: 5‐fluorouracil + irinotecan + oxaliplatin; QoL: quality of life; QLQ‐C30 and QLQ‐PAN26: general and pancreatic cancer specific QoL questionnaire. | |||
| Study | Gemcitabine combination details | Median survival:gemcitabine combination vs gemcitabine alone (months) | Quality of life |
| Platinum combinations | |||
| Gemcitabine + cisplatin | 7.5 vs 5.0 | Not addressed | |
| Gemcitabine + cisplatin | 7.2 vs 8.3 | The mean difference from baseline in global QoL (EORTC C30) was not significantly different between the 2 groups: 0.09 (gemcitabine/cisplatin) vs 6.20 (gemcitabine), P = 0.07 | |
| Gemcitabine + cisplatin | 7.5 vs 6.0 | No difference was detected in the 2 groups with either the Spitzer index or the pain intensity score | |
| Gemcitabine + cisplatin | 5.6 vs 4.6 | Clinical benefit (pain control, performance status, body weight gain) 29% vs 36% (P > 0.05); Quality adjusted life months 3.8 vs 5.6 (P < 0.001) | |
| Gemcitabine + oxaliplatin | 9.0 vs 7.1 | Not addressed | |
| Gemcitabine + cisplatin | 8.0 vs 6.7 | Q‐TWiST results did not differ significantly between the 2 arms (EORTC C30) | |
| Gemcitabine + cisplatin | 7.2 vs 9.1 | Not addressed | |
| Fluoropyrimidine combinations | |||
| Gemcitabine + 5FU (weekly) | 6.7 vs 5.4 | Not addressed | |
| Gemcitabine + capecitabine | 7.1 vs 6.2 | 89% of people completed QoL questionnaires (EORTC QLQ‐C30 + ESPAC). No differences seen at baseline between the 2 groups and no differences across treatment groups at 3 or 6 months | |
| Gemcitabine + daily 5FU | 7.5 vs 7.75 | No differences were seen between the 2 groups in mean disturbed days after cycle 1 or 2 or mean of days a person would like to cancel treatment in cycle 1 or 2 | |
| Gemcitabine + capecitabine | 8.4 vs 7.2 | CBR seen in 29% of people in combination arm and 20% of people in gemcitabine arm. Median duration of response 9.5 and 6.5 weeks, respectively (P < 0.02). No differences in QoL as measured by LASA | |
| Gemcitabine + capecitabine | 10.3 vs 7.5 | Not addressed | |
| Gemcitabine + UFT | Not stated | Not addressed | |
| Gemcitabine + S1 | 13.7 vs 8.0 | Not addressed | |
| Gemcitabine + 5FU (24 hour infusion) + FA | Not stated | Not addressed | |
| Gemcitabine + capecitabine | 9.5 vs 8.2 | The gemcitabine + capecitabine arm had an improvement in pain (35.5 vs 20%), KPS (41.9 vs 27%), but not weight (9.7 vs 17%) | |
| Gemcitabine + S1 | 10.1 vs 8.8 | The gemcitabine + S1 group showed an improvement in QALYs 0.525 vs 0.401, P < 0.001 | |
| Topoisomerase combinations | |||
| Gemcitabine + exatecan | 6.2 vs 6.7 | Not addressed | |
| Gemcitabine + irinotecan | 6.3 vs 6.5 | FACT‐Hep questionnaires were completed by 80% of people in irinotecan/gemcitabine group and 73% of the gemcitabine group during the first 30 weeks of the study. There were no differences between the 2 groups. | |
| Gemcitabine + irinotecan | 6.4 vs 6.5 | Not addressed | |
| Taxane combinations | |||
| Gemcitabine + nab‐paclitaxel | 8.5 vs 6.7 | Not addressed | |
| Other combination chemotherapy including gemcitabine | |||
| Gemcitabine + oxaliplatin + capecitabine (GEMOXEL) | 11.9 vs 7.1 | The global QoL score was higher in the combination chemotherapy group at 2 months (61 vs 56) and 4 months (72 vs 66) | |
| Cisplatin/epirubicin/gemcitabine/5FU (PEFG) | Not stated | The EORTC‐QLQ Pan 26 questionnaire was done but the sample size was insufficient to obtain adequate statistical power to reliably detect differences between groups for multiple comparisons. People in PEFG group 20% to 44% more likely to have improvement in emotional functioning, overall quality of life, cognitive measures, pain, fatigue, indigestion, dyspnoea, appetite loss and flatulence. However, people in gemcitabine group had better scores for sexual function and body image | |
| Other agents in combination with gemcitabine | |||
| Gemcitabine + Ukrain | 10.4 vs 5.2 | Not addressed | |
| Gemcitabine + huachansu | 5.2 vs 5.3 | No significant differences were seen between the treatment groups with either the FACT‐G or MDASI assessments | |
| Gemcitabine + pemetrexed | 6.2 vs 6.3 | People in the gemcitabine group had better financial difficulties score, better physical functioning score and better cognitive functioning score. People in the gemcitabine/pemetrexed group had better pain scores. Performance status improvements was seen in 11.4% of gemcitabine/pemetrexed group and 9.4% of gemcitabine group. Weight gain was seen in 10.2% of gemcitabine/pemetrexed group and 5.7% of gemcitabine group | |
| Gemcitabine + EPA | 8.2 vs 9.7 | Not addressed | |
| 5FU: fluorouracil; CBR: clinical benefit response; ESPAC: European Study Group for Pancreatic Cancer; EORTC: European Organisation for Research and Treatment of Cancer; FACT‐G: Functional Assessment of Cancer Therapy; FA: folinic acid; KPS: Karnofsky performance status; LASA: linear‐analog self‐assessment indicators; MDASI: MD Anderson Symptom Inventory; QALY: quality‐adjusted life year; QLQ‐C30: quality of life questionnaire for cancer patients; QoL: quality of life; Q‐TWiST: quality‐adjusted time without symptoms or toxicity. | |||
| Study | Fluoropyrimidine combination details | Median survival:fluoropyrimidine combination vs fluoropyrimidine alone (months) | Quality of life |
| 5FU + oxaliplatin | 3.7 vs 3.4 | Not addressed | |
| 5FU + BCNU | Not stated | Not addressed | |
| 5FU + MMC | 6.5 vs 5.1 | EORTC‐QLQ C30 showed that at 24 weeks, global QoL was superior in the combination arm compared to baseline (P = 0.035), and the pain score was also improved (P = 0.048). There was less dyspnoea at 12 weeks in the combination arm when compared to baseline (P = 0.033). | |
| 5FU + streptozocin | 4.5 vs 5.25 | Not addressed | |
| 5FU: fluorouracil; BCNU: bis‐chloroethylnitrosourea (carmustine); EORTC QLQ‐C30: European Organisation for Research and Treatment of Cancer quality of life questionnaire for cancer patients; MMC: 5FU+doxorubicin + mitomycin C; QoL: quality of life. | |||
| Study | Treatment arms/no. of participants | Survival outcomes | Response rates | Adverse events | Quality of life |
| Multi‐armed studies | |||||
| Capecitabine/oxaliplatin (n = 61) versus capecitabine/gemcitabine (n = 64) versus modified gemcitabine/oxaliplatin (n = 63) | OS: 8.1 vs 9.0 v 6.9 months PFS 4.2 vs 5.7 v 3.9 months | PR 13% vs 25% vs 13% SbD: 36% vs 39% vs 43% | Haematological AEs more common in the gemcitabine containing arms | Not studied | |
| 5FU (n = 50) versus 5FU/doxorubicin (n = 44) versus 5FU/doxorubicin/mitomycin C (n = 50) | Median survival of 22 weeks in all treatment groups | 30% vs 30% vs 7.7% | Haematological AEs more common in the 5FU and 5FU/doxorubicin arm, however the subgroup with PC were not reported separately. | Not studied | |
| 5FU (n = 64) versus 5FU/cyclophosphamide/methotrexate 'Mallinson Regimen' (n = 61) versus 5FU/doxorubicin/cisplatin 'FAP' (n = 59) | OS: 3.5 vs 4.5 vs 3.5 months respectively PFS: 2.5 vs 2.5 vs 2.5 months | 7% vs 21% vs 15% | More AEs reported in the combination arms compared with 5FU alone | Not studied | |
| Gemcitabine (fixed dose rate) (n = 64) versus infusional gemcitabine + cisplatin (n = 66) versus infusional gemcitabine + docetaxel (n = 65) versus infusional gemcitabine + irinotecan (n = 60) | OS: 6.4 vs 6.7 vs 6.4 vs 7.1 months, respectively. Time to progression: 3.3 vs 4.5 vs 4.1 vs 4.0 months | 14 vs 12.5 vs 12 vs 14% | Neutropenia and fatigue most common AE and same in all groups | Not studied | |
| Other studies | |||||
| Gemcitabine/oxaliplatin (n = 20) vs simplified gemcitabine/oxaliplatin (n = 37) | OS: 3.2 vs 7.6 months PFS: 2.5 vs 4.0 months | PR: 10% vs 27% SbD: 45% vs 43% | Peripheral neuropathy more common in the simplified GemOx arm | Not studied | |
| Mitomycin C/5FU (MF) (n = 73) vs Streptozocin/mitomycin C/5FU (SMF) (n = 72) | OS: 17 vs 18 weeks | PR: 8% v 34% | More gastrointestinal and renal toxicity in the SMF arm | Not studied | |
| Standard nab‐paclitaxel and gemcitabine (n = 75) vs sequential nab‐paclitaxel and gemcitabine (n = 71) | OS: 7.9 vs 10.1 months (HR 0.88) PFS: 4.0 vs 5.8 months (HR 0.66) | PR: 33% vs 50% SbD: 28% vs 42% | Neutropenia more common in the sequential arm | QoL score dropped by −12.1 points at 24 weeks in the standard arm vs −2.1 in the sequential arm | |
| Gemcitabine 3‐week schedule (n = 45) vs gemcitabine 4‐week schedule (n = 45) | OS: 250 vs 206 days PFS: 114 vs 112 days | 17.1% vs 14.2% | Thrombocytopenia more common in the 4‐week schedule | Not studied | |
| Streptozocin/mitomycin C/5FU (SMF) (n = 42) vs cisplatin/ara‐C/caffeine (CAC) (n = 40) | OS: 10 vs 5 months | 10% vs 6% | Nausea and vomiting more common in CAC arm. | Not studied | |
| 5FU constant infusion vs 5FU constant infusion/cisplatin versus 5FU chronomodulated infusion vs 5FU chronomodulated infusion/cisplatin (no cisplatin n = 55, with cisplatin n = 52) | OS: 5.4 vs 8.3 months (no cis vs cis) OS: 6.1 vs 6.7 months (continuous vs chronomodulated) PFS: 2.1 vs 3.2 months | Not reported | Cisplatin increased rates of haematological AEs. Chronomodulated regimen increased rates of mucositis | Not studied | |
| Gemcitabine + docetaxel (n = 49) vs cisplatin + docetaxel (n = 47) | OS: 7.0 vs 7.5 months PFS: 3.9 vs 2.8 months | 19.4% vs 23.5% | Febile neutropenia more common in the cisplatin/docetaxel arm | Not studied | |
| Streptozocin + 5FU (n = 40) vs streptozocin + cyclophosphamide (n = 48) | OS: 13 vs 9 weeks | CR: 3 vs 6 PR: 2 vs 0 SbD: 9 vs 9 | Haematological AEs more common in the cyclophosphamide arm | Not studied | |
| Capecitabine + cisplatin + gemcitabine + docetaxel (PDXG) (n = 53) vs capecitabine + cisplatin + gemcitabine + epirubicin (PEXG) (n = 52) | OS: 10.7 vs 11 months PFS: 7.4 vs 7.6 months | CR: 2 vs 4% PR: 58 vs 33% | Neutropenia more common in the PEXG arm | Not studied | |
| Epirubicin (n = 32) vs 5FU + epirubicin + mitomycin C (n = 30) | 1 year survival rates 15.4 vs 23.2% | 8% vs 11% | AEs were similar in both arms | Not studied | |
| 5FU: fluorouracil; AE: adverse event; CR: complete response; OS: overall survival; PC: pancreatic cancer; PR: partial response; SbD: stable disease. | |||||
| Outcome or subgroup title | No. of studies | No. of participants | Statistical method | Effect size |
| 1 Overall survival Show forest plot | 4 | 298 | Hazard Ratio (Random, 95% CI) | 1.08 [0.88, 1.33] |
| Outcome or subgroup title | No. of studies | No. of participants | Statistical method | Effect size |
| 1 Overall survival Show forest plot | 8 | Hazard Ratio (Random, 95% CI) | Subtotals only | |
| 1.1 5‐FU | 1 | 126 | Hazard Ratio (Random, 95% CI) | 1.69 [1.26, 2.27] |
| 1.2 FOLFIRINOX | 2 | 652 | Hazard Ratio (Random, 95% CI) | 0.51 [0.43, 0.60] |
| 1.3 CO‐101 | 1 | 367 | Hazard Ratio (Random, 95% CI) | 1.07 [0.86, 1.34] |
| 1.4 ZD9331 | 1 | 55 | Hazard Ratio (Random, 95% CI) | 0.86 [0.42, 1.76] |
| 1.5 Fixed dose rate gemcitabine | 2 | 644 | Hazard Ratio (Random, 95% CI) | 0.79 [0.66, 0.94] |
| 1.6 Exatecan | 1 | 339 | Hazard Ratio (Random, 95% CI) | 1.27 [0.96, 1.68] |
| 2 Progression‐free survival Show forest plot | 5 | Hazard Ratio (Random, 95% CI) | Subtotals only | |
| 2.1 5‐FU | 1 | 126 | Hazard Ratio (Random, 95% CI) | 1.47 [1.12, 1.92] |
| 2.2 FOLFIRINOX | 2 | 652 | Hazard Ratio (Random, 95% CI) | 0.46 [0.38, 0.57] |
| 2.3 ZD9331 | 1 | 55 | Hazard Ratio (Random, 95% CI) | 0.78 [0.46, 1.32] |
| 2.4 Fixed dose rate gemcitabine | 1 | 552 | Hazard Ratio (Random, 95% CI) | 0.88 [0.77, 1.01] |
| 3 Degradation of QoL at 6 months Show forest plot | 2 | Hazard Ratio (Random, 95% CI) | 0.46 [0.35, 0.61] | |
| 4 Response rates Show forest plot | 7 | Risk Ratio (M‐H, Random, 95% CI) | Subtotals only | |
| 4.1 5‐FU | 1 | 126 | Risk Ratio (M‐H, Random, 95% CI) | 0.14 [0.01, 2.71] |
| 4.2 FOLFIRINOX | 1 | 342 | Risk Ratio (M‐H, Random, 95% CI) | 3.38 [2.01, 5.65] |
| 4.3 CO‐101 | 1 | 358 | Risk Ratio (M‐H, Random, 95% CI) | 0.67 [0.43, 1.04] |
| 4.4 ZD9331 | 1 | 55 | Risk Ratio (M‐H, Random, 95% CI) | 0.42 [0.04, 4.33] |
| 4.5 Fixed dose rate gemcitabine | 2 | 644 | Risk Ratio (M‐H, Random, 95% CI) | 1.59 [0.91, 2.79] |
| 4.6 Exatecan (DX‐8951f) | 1 | 276 | Risk Ratio (M‐H, Random, 95% CI) | 0.10 [0.01, 0.78] |
| 5 Grade 3/4 anaemia Show forest plot | 7 | Risk Ratio (M‐H, Random, 95% CI) | Subtotals only | |
| 5.1 5‐FU | 1 | 126 | Risk Ratio (M‐H, Random, 95% CI) | 0.08 [0.00, 1.34] |
| 5.2 FOLFIRINOX | 1 | 342 | Risk Ratio (M‐H, Random, 95% CI) | 1.3 [0.59, 2.88] |
| 5.3 CO‐101 | 1 | 360 | Risk Ratio (M‐H, Random, 95% CI) | 1.01 [0.59, 1.73] |
| 5.4 ZD9331 | 1 | 55 | Risk Ratio (M‐H, Random, 95% CI) | 0.28 [0.01, 6.58] |
| 5.5 Fixed dose rate gemcitabine | 2 | 644 | Risk Ratio (M‐H, Random, 95% CI) | 1.79 [1.22, 2.63] |
| 5.6 Exatecan | 1 | 330 | Risk Ratio (M‐H, Random, 95% CI) | 1.0 [0.43, 2.34] |
| 6 Grade 3/4 neutropenia Show forest plot | 7 | Risk Ratio (M‐H, Random, 95% CI) | Subtotals only | |
| 6.1 5‐FU | 1 | 126 | Risk Ratio (M‐H, Random, 95% CI) | 0.19 [0.06, 0.61] |
| 6.2 FOLFIRINOX | 1 | 342 | Risk Ratio (M‐H, Random, 95% CI) | 2.14 [1.52, 3.01] |
| 6.3 CO‐101 | 1 | 360 | Risk Ratio (M‐H, Random, 95% CI) | 1.31 [0.83, 2.07] |
| 6.4 ZD9331 | 1 | 55 | Risk Ratio (M‐H, Random, 95% CI) | 4.17 [0.52, 33.37] |
| 6.5 Fixed dose rate gemcitabine | 2 | 644 | Risk Ratio (M‐H, Random, 95% CI) | 1.85 [1.53, 2.23] |
| 6.6 Exatecan | 1 | 330 | Risk Ratio (M‐H, Random, 95% CI) | 1.0 [0.64, 1.55] |
| 7 Grade 3/4 thrombocytopenia Show forest plot | 7 | Risk Ratio (M‐H, Random, 95% CI) | Subtotals only | |
| 7.1 5‐FU | 1 | 126 | Risk Ratio (M‐H, Random, 95% CI) | 0.17 [0.02, 1.34] |
| 7.2 FOLFIRINOX | 1 | 342 | Risk Ratio (M‐H, Random, 95% CI) | 2.5 [0.99, 6.29] |
| 7.3 CO‐101 | 1 | 360 | Risk Ratio (M‐H, Random, 95% CI) | 1.10 [0.51, 2.34] |
| 7.4 ZD9331 | 1 | 55 | Risk Ratio (M‐H, Random, 95% CI) | 3.33 [0.40, 27.94] |
| 7.5 Fixed dose rate gemcitabine | 2 | 644 | Risk Ratio (M‐H, Random, 95% CI) | 2.77 [1.99, 3.86] |
| 7.6 Exatecan | 1 | 330 | Risk Ratio (M‐H, Random, 95% CI) | 0.75 [0.37, 1.54] |
| 8 Grade 3/4 nausea Show forest plot | 5 | Risk Ratio (M‐H, Random, 95% CI) | Subtotals only | |
| 8.1 5‐FU | 1 | 126 | Risk Ratio (M‐H, Random, 95% CI) | 0.38 [0.10, 1.35] |
| 8.2 ZD9331 | 1 | 55 | Risk Ratio (M‐H, Random, 95% CI) | 2.52 [0.11, 59.18] |
| 8.3 Fixed dose rate gemcitabine | 2 | 644 | Risk Ratio (M‐H, Random, 95% CI) | 1.52 [0.94, 2.46] |
| 8.4 Exatecan | 1 | 330 | Risk Ratio (M‐H, Random, 95% CI) | 1.75 [0.52, 5.86] |
| 9 Grade 3/4 diarrhoea Show forest plot | 4 | Risk Ratio (M‐H, Random, 95% CI) | Subtotals only | |
| 9.1 5‐FU | 1 | 126 | Risk Ratio (M‐H, Random, 95% CI) | 3.0 [0.32, 28.07] |
| 9.2 ZD9331 | 1 | 55 | Risk Ratio (M‐H, Random, 95% CI) | 0.28 [0.01, 6.58] |
| 9.3 Fixed dose rate gemcitabine | 2 | 644 | Risk Ratio (M‐H, Random, 95% CI) | 0.44 [0.16, 1.23] |
| Outcome or subgroup title | No. of studies | No. of participants | Statistical method | Effect size |
| 1 Overall survival Show forest plot | 26 | Hazard Ratio (Random, 95% CI) | Subtotals only | |
| 1.1 Gemcitabine plus platinum agent | 6 | 1140 | Hazard Ratio (Random, 95% CI) | 0.94 [0.81, 1.08] |
| 1.2 Gemcitabine plus fluoropyrimidine | 10 | 2718 | Hazard Ratio (Random, 95% CI) | 0.88 [0.81, 0.95] |
| 1.3 Gemcitabine plus topoisomerase inhibitor | 3 | 839 | Hazard Ratio (Random, 95% CI) | 1.01 [0.87, 1.16] |
| 1.4 Gemcitabine plus taxane | 1 | 861 | Hazard Ratio (Random, 95% CI) | 0.72 [0.62, 0.84] |
| 1.5 Gemcitabine plus other combinations of chemotherapy | 2 | 166 | Hazard Ratio (Random, 95% CI) | 0.55 [0.39, 0.79] |
| 1.6 Gemcitabine plus other agent(s) | 4 | 767 | Hazard Ratio (Random, 95% CI) | 0.79 [0.56, 1.10] |
| 2 Progression‐free survival Show forest plot | 18 | Hazard Ratio (Random, 95% CI) | Subtotals only | |
| 2.1 Gemcitabine plus platinum agent | 4 | 1015 | Hazard Ratio (Random, 95% CI) | 0.80 [0.68, 0.95] |
| 2.2 Gemcitabine plus fluoropyrimidine | 8 | 2608 | Hazard Ratio (Random, 95% CI) | 0.79 [0.72, 0.87] |
| 2.3 Gemcitabine plus topoisomerase inhibitor | 2 | 709 | Hazard Ratio (Random, 95% CI) | 0.91 [0.78, 1.07] |
| 2.4 Gemcitabine plus taxane | 1 | 861 | Hazard Ratio (Random, 95% CI) | 0.69 [0.58, 0.82] |
| 2.5 Gemcitabine plus other combinations of chemotherapy | 2 | 166 | Hazard Ratio (Random, 95% CI) | 0.43 [0.30, 0.62] |
| 2.6 Gemcitabine plus other agent(s) | 1 | 76 | Hazard Ratio (Random, 95% CI) | 1.05 [0.68, 1.62] |
| 3 Response rates Show forest plot | 24 | Risk Ratio (M‐H, Random, 95% CI) | Subtotals only | |
| 3.1 Gemcitabine plus platinum agent | 7 | 1186 | Risk Ratio (M‐H, Random, 95% CI) | 1.48 [1.11, 1.98] |
| 3.2 Gemcitabine plus fluoropyrimidine | 9 | 2176 | Risk Ratio (M‐H, Random, 95% CI) | 1.78 [1.29, 2.47] |
| 3.3 Gemcitabine plus topoisomerase inhibitor | 3 | 729 | Risk Ratio (M‐H, Random, 95% CI) | 1.50 [0.92, 2.46] |
| 3.4 Gemcitabine plus taxane | 1 | 861 | Risk Ratio (M‐H, Random, 95% CI) | 3.29 [2.24, 4.84] |
| 3.5 Gemcitabane plus other combinations of chemotherapy | 1 | 67 | Risk Ratio (M‐H, Random, 95% CI) | 1.94 [0.83, 4.56] |
| 3.6 Gemcitabine plus other agent(s) | 3 | 691 | Risk Ratio (M‐H, Random, 95% CI) | 3.66 [1.04, 12.82] |
| 4 Grade 3/4 anaemia Show forest plot | 23 | Risk Ratio (M‐H, Random, 95% CI) | Subtotals only | |
| 4.1 Gemcitabine plus platinum agent | 7 | 1156 | Risk Ratio (M‐H, Random, 95% CI) | 1.41 [0.87, 2.31] |
| 4.2 Gemcitabine plus fluoropyrimidine | 8 | 2158 | Risk Ratio (M‐H, Random, 95% CI) | 1.11 [0.84, 1.45] |
| 4.3 Gemcitabine plus topoisomerase inhibitor | 3 | 797 | Risk Ratio (M‐H, Random, 95% CI) | 1.09 [0.72, 1.66] |
| 4.4 Gemcitabine plus taxane | 1 | 793 | Risk Ratio (M‐H, Random, 95% CI) | 1.06 [0.73, 1.52] |
| 4.5 Gemcitabine plus other combinations of chemotherapy | 1 | 67 | Risk Ratio (M‐H, Random, 95% CI) | 1.94 [0.53, 7.13] |
| 4.6 Gemcitabine plus other agent(s) | 3 | 688 | Risk Ratio (M‐H, Random, 95% CI) | 3.58 [1.93, 6.62] |
| 5 Grade 3/4 neutropenia Show forest plot | 23 | Risk Ratio (M‐H, Random, 95% CI) | Subtotals only | |
| 5.1 Gemcitabine plus platinum agent | 6 | 961 | Risk Ratio (M‐H, Random, 95% CI) | 1.34 [0.90, 1.97] |
| 5.2 Gemcitabine plus fluoropyrimidine | 9 | 2177 | Risk Ratio (M‐H, Random, 95% CI) | 1.53 [1.34, 1.74] |
| 5.3 Gemcitabine plus topoisomerase inhibitor | 3 | 797 | Risk Ratio (M‐H, Random, 95% CI) | 1.54 [1.04, 2.30] |
| 5.4 Gemcitabine plus taxane | 1 | 793 | Risk Ratio (M‐H, Random, 95% CI) | 1.42 [1.16, 1.75] |
| 5.5 Gemcitabine plus other combinations of chemotherapy | 1 | 67 | Risk Ratio (M‐H, Random, 95% CI) | 1.94 [0.65, 5.83] |
| 5.6 Gemcitabine plus other agent(s) | 3 | 688 | Risk Ratio (M‐H, Random, 95% CI) | 2.02 [0.88, 4.66] |
| 6 Grade 3/4 thrombocytopenia Show forest plot | 23 | Risk Ratio (M‐H, Random, 95% CI) | Subtotals only | |
| 6.1 Gemcitabine plus platinum agent | 6 | 1110 | Risk Ratio (M‐H, Random, 95% CI) | 1.96 [1.00, 3.84] |
| 6.2 Gemcitabine plus fluoropyrimidine | 9 | 2177 | Risk Ratio (M‐H, Random, 95% CI) | 1.48 [1.00, 2.18] |
| 6.3 Gemcitabine plus topoisomerase inhibitor | 3 | 797 | Risk Ratio (M‐H, Random, 95% CI) | 2.28 [0.97, 5.36] |
| 6.4 Gemcitabine plus taxane | 1 | 793 | Risk Ratio (M‐H, Random, 95% CI) | 1.38 [0.93, 2.07] |
| 6.5 Gemcitabine plus other combinations of chemotherapy | 1 | 67 | Risk Ratio (M‐H, Random, 95% CI) | 1.94 [0.74, 5.07] |
| 6.6 Gemcitabine plus other agent(s) | 3 | 688 | Risk Ratio (M‐H, Random, 95% CI) | 1.41 [0.45, 4.39] |
| 7 Grade 3/4 nausea Show forest plot | 21 | Risk Ratio (M‐H, Random, 95% CI) | Subtotals only | |
| 7.1 Gemcitabine plus platinum agent | 6 | 1110 | Risk Ratio (M‐H, Random, 95% CI) | 2.28 [1.40, 3.71] |
| 7.2 Gemcitabine plus fluoropyrimidine | 7 | 2075 | Risk Ratio (M‐H, Random, 95% CI) | 1.27 [0.87, 1.84] |
| 7.3 Gemcitabine plus topoisomerase inhibitor | 3 | 797 | Risk Ratio (M‐H, Random, 95% CI) | 1.55 [0.94, 2.55] |
| 7.4 Gemcitabine plus other combinations of chemotherapy | 1 | 67 | Risk Ratio (M‐H, Random, 95% CI) | 10.69 [0.61, 185.91] |
| 7.5 Gemcitabine plus other agent(s) | 4 | 748 | Risk Ratio (M‐H, Random, 95% CI) | 1.25 [0.48, 3.26] |
| 8 Grade 3/4 diarrhoea Show forest plot | 17 | Risk Ratio (M‐H, Random, 95% CI) | Subtotals only | |
| 8.1 Gemcitabine plus platinum agent | 6 | 1110 | Risk Ratio (M‐H, Random, 95% CI) | 1.48 [0.62, 3.53] |
| 8.2 Gemcitabine plus fluoropyrimidine | 8 | 2087 | Risk Ratio (M‐H, Random, 95% CI) | 2.16 [1.34, 3.47] |
| 8.3 Gemcitabine plus topoisomerase inhibitor | 3 | 797 | Risk Ratio (M‐H, Random, 95% CI) | 3.47 [0.74, 16.33] |
| 9 Grade 3/4 neuropathy Show forest plot | 1 | Risk Ratio (M‐H, Random, 95% CI) | Subtotals only | |
| 9.1 Gemcitabine plus taxane | 1 | 793 | Risk Ratio (M‐H, Random, 95% CI) | 22.35 [7.10, 70.40] |
| 10 Grade 3/4 fatigue Show forest plot | 1 | Risk Ratio (M‐H, Random, 95% CI) | Subtotals only | |
| 10.1 Gemcitabine plus taxane | 1 | 793 | Risk Ratio (M‐H, Random, 95% CI) | 2.48 [1.63, 3.79] |
| Outcome or subgroup title | No. of studies | No. of participants | Statistical method | Effect size |
| 1 Overall survival Show forest plot | 4 | 491 | Hazard Ratio (Random, 95% CI) | 0.84 [0.61, 1.15] |
| 2 Progression‐free survival Show forest plot | 2 | 255 | Hazard Ratio (Random, 95% CI) | 0.52 [0.19, 1.38] |
| 3 Response rates Show forest plot | 4 | 410 | Risk Ratio (M‐H, Random, 95% CI) | 1.18 [0.52, 2.68] |
| 4 Grade 3/4 anaemia Show forest plot | 2 | 255 | Risk Ratio (M‐H, Random, 95% CI) | 0.48 [0.06, 3.62] |
| 5 Grade 3/4 neutropenia Show forest plot | 2 | 255 | Risk Ratio (M‐H, Random, 95% CI) | 5.70 [0.73, 44.46] |
| 6 Grade 3/4 thrombocytopenia Show forest plot | 2 | 255 | Risk Ratio (M‐H, Random, 95% CI) | 1.40 [0.34, 5.80] |
| 7 Grade 3/4 fatigue Show forest plot | 1 | 209 | Risk Ratio (M‐H, Random, 95% CI) | 0.91 [0.58, 1.43] |
| 8 Grade 3/4 nausea Show forest plot | 2 | 255 | Risk Ratio (M‐H, Random, 95% CI) | 1.06 [0.32, 3.53] |
| 9 Grade 3/4 diarrhoea Show forest plot | 2 | 255 | Risk Ratio (M‐H, Random, 95% CI) | 0.92 [0.31, 2.78] |