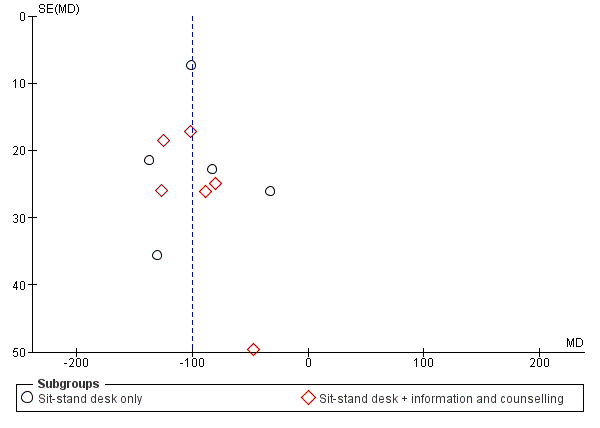
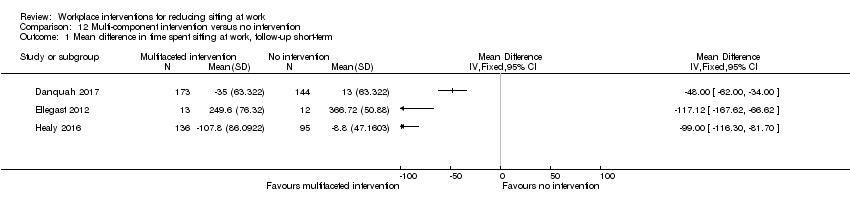
| 1 Mean difference in time spent sitting at work follow‐up short‐term Show forest plot | 10 | 323 | Mean Difference (Random, 95% CI) | ‐100.16 [‐115.83, ‐84.48] |
|
| 1.1 Sit‐stand desk only | 5 | 145 | Mean Difference (Random, 95% CI) | ‐96.72 [‐126.05, ‐67.39] |
| 1.2 Sit‐stand desk + information and counselling | 6 | 178 | Mean Difference (Random, 95% CI) | ‐104.38 [‐122.81, ‐85.96] |
| 2 Mean difference in time spent sitting at work, follow‐up short‐term ‐ sensitivity analysis Show forest plot | 10 | 323 | Mean Difference (Random, 95% CI) | ‐100.16 [‐115.83, ‐84.48] |
|
| 2.1 Randomised control trials | 4 | 132 | Mean Difference (Random, 95% CI) | ‐105.19 [‐128.13, ‐82.24] |
| 2.2 Cross‐over RCT | 2 | 70 | Mean Difference (Random, 95% CI) | ‐99.11 [‐112.82, ‐85.41] |
| 2.3 Control before after studies | 4 | 121 | Mean Difference (Random, 95% CI) | ‐92.80 [‐133.13, ‐52.47] |
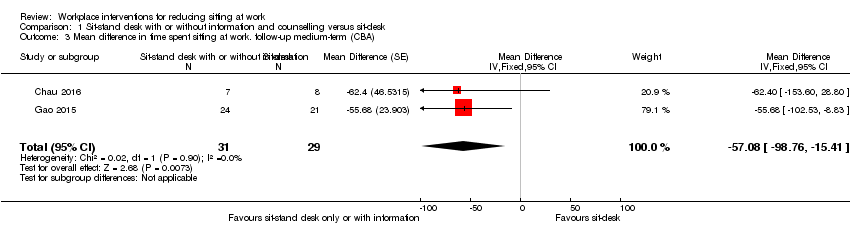
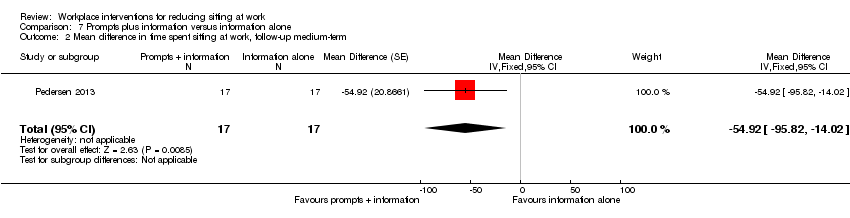
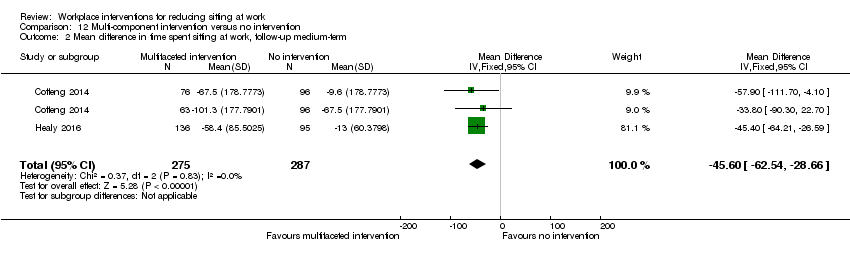
| 3 Mean difference in time spent sitting at work. follow‐up medium‐term (CBA) Show forest plot | 2 | 60 | Mean Difference (Fixed, 95% CI) | ‐57.08 [‐98.76, ‐15.41] |
|
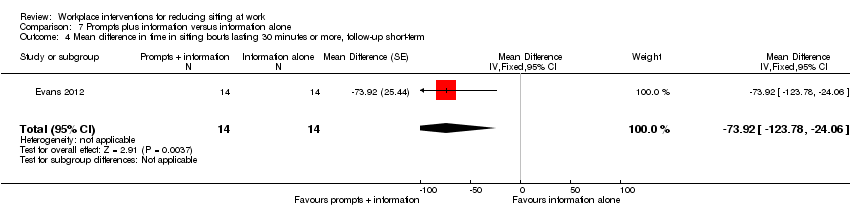
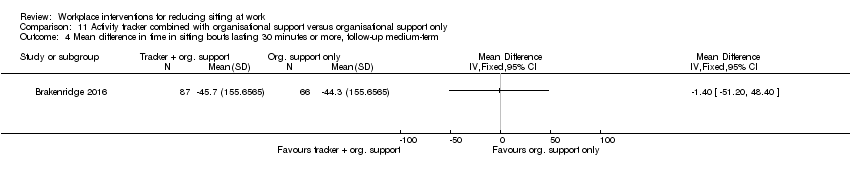
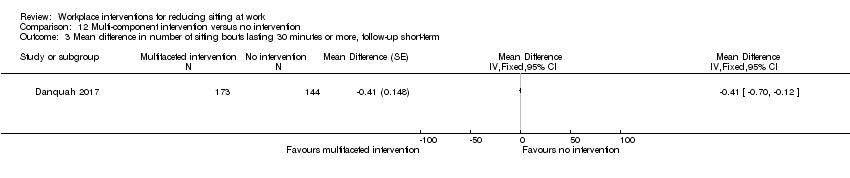
| 4 Mean difference in time in sitting bouts lasting 30 minutes or more, follow‐up short‐term (CBA) Show forest plot | 2 | 74 | Mean Difference (Fixed, 95% CI) | ‐52.57 [‐78.79, ‐26.35] |
|
| 4.1 Sit‐stand desk only | 1 | 20 | Mean Difference (Fixed, 95% CI) | ‐13.00 [‐70.80, 40.80] |
| 4.2 Sit‐stand desk + information and counselling | 2 | 54 | Mean Difference (Fixed, 95% CI) | ‐63.22 [‐92.92, ‐33.51] |
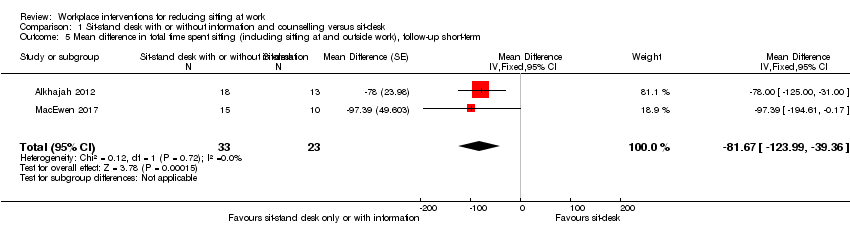
| 5 Mean difference in total time spent sitting (including sitting at and outside work), follow‐up short‐term Show forest plot | 2 | 56 | Mean Difference (Fixed, 95% CI) | ‐81.67 [‐123.99, ‐39.36] |
|
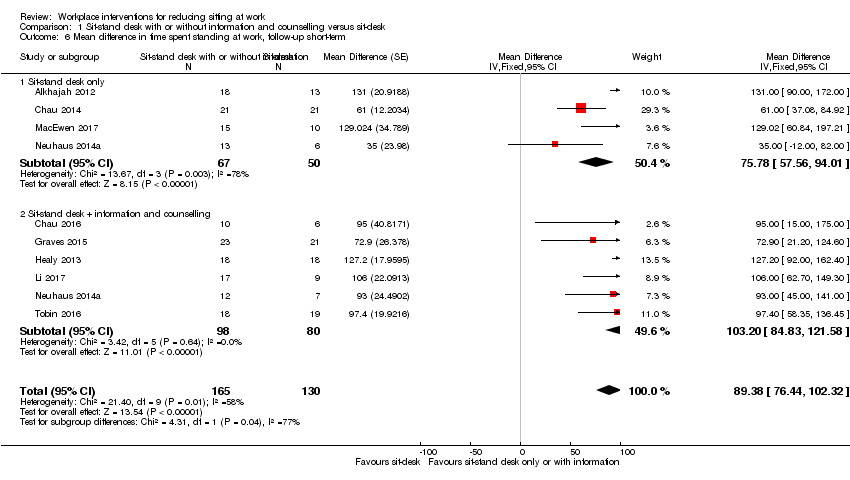
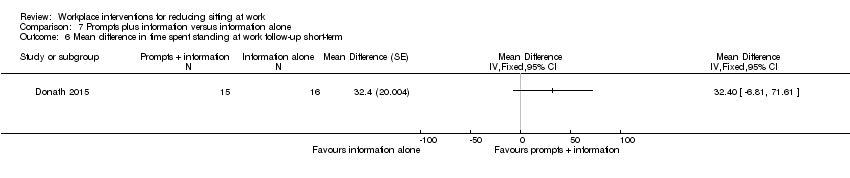
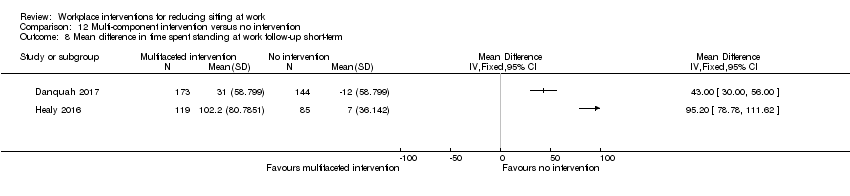
| 6 Mean difference in time spent standing at work, follow‐up short‐term Show forest plot | 9 | 295 | Mean Difference (Fixed, 95% CI) | 89.38 [76.44, 102.32] |
|
| 6.1 Sit‐stand desk only | 4 | 117 | Mean Difference (Fixed, 95% CI) | 75.78 [57.56, 94.01] |
| 6.2 Sit‐stand desk + information and counselling | 6 | 178 | Mean Difference (Fixed, 95% CI) | 103.20 [84.83, 121.58] |
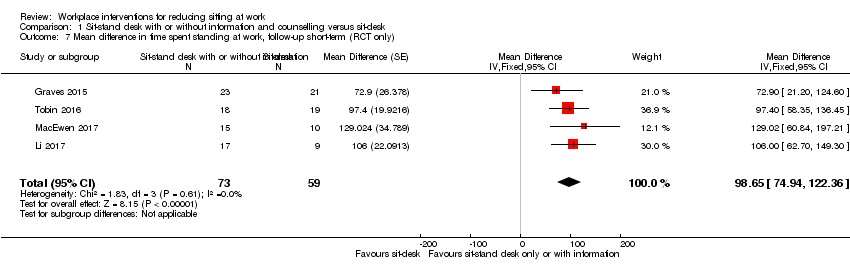
| 7 Mean difference in time spent standing at work, follow‐up short‐term (RCT only) Show forest plot | 4 | 132 | Mean Difference (Fixed, 95% CI) | 98.65 [74.94, 122.36] |
|
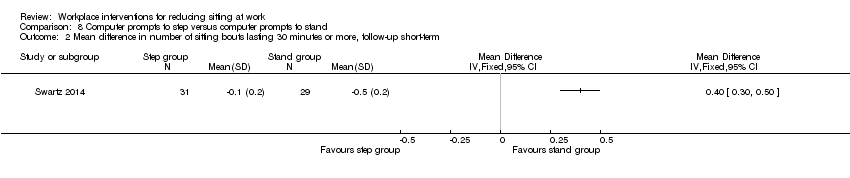
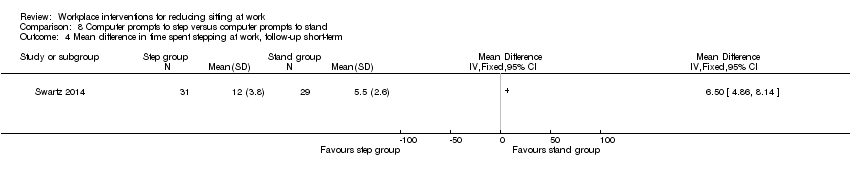
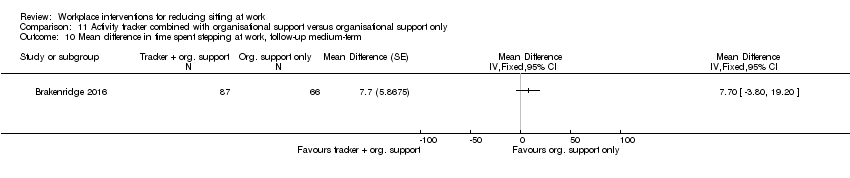
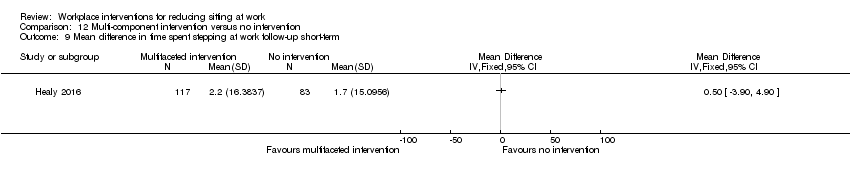
| 8 Mean difference in time spent stepping at work follow‐up short‐term Show forest plot | 8 | 270 | Mean Difference (Random, 95% CI) | ‐0.52 [‐3.88, 2.85] |
|
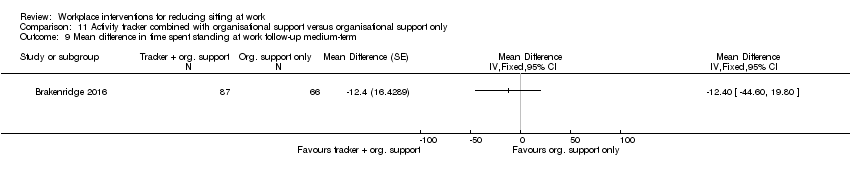
| 9 Mean difference in time spent standng at work, follow‐up medium‐term (CBA) Show forest plot | 2 | 60 | Mean Difference (IV, Fixed, 95% CI) | 53.36 [16.59, 90.14] |
|
| 10 Work performance (1‐10 scale), follow‐up short‐term (CBA) Show forest plot | 3 | 109 | Mean Difference (Fixed, 95% CI) | 0.35 [‐0.10, 0.79] |
|
| 10.1 Sit‐stand desk only | 2 | 52 | Mean Difference (Fixed, 95% CI) | 0.82 [0.00, 1.63] |
| 10.2 Sit‐stand desk + information and counselling | 2 | 57 | Mean Difference (Fixed, 95% CI) | 0.15 [‐0.38, 0.68] |
| 11 Proportion with ≥ 1 sick days in the last three months (CBA) Show forest plot | 1 | | Risk Ratio (M‐H, Fixed, 95% CI) | Totals not selected |
|
| 12 Proportion with ≥ 1 sick days in the last month (CBA) Show forest plot | 2 | 78 | Risk Ratio (M‐H, Fixed, 95% CI) | 0.77 [0.49, 1.21] |
|
| 12.1 Sit‐stand desk only | 1 | 20 | Risk Ratio (M‐H, Fixed, 95% CI) | 0.94 [0.42, 2.13] |
| 12.2 Sit‐stand desk + information and counselling | 2 | 58 | Risk Ratio (M‐H, Fixed, 95% CI) | 0.72 [0.41, 1.24] |
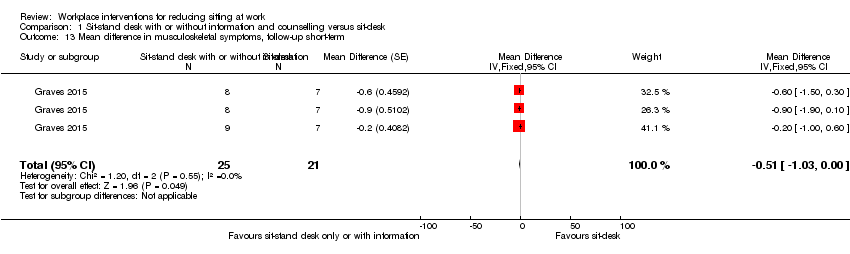
| 13 Mean difference in musculoskeletal symptoms, follow‐up short‐term Show forest plot | 1 | 46 | Mean Difference (Fixed, 95% CI) | ‐0.51 [‐1.03, ‐0.00] |
|
| 14 Mean difference in musculoskeletal symptoms, follow‐up Medium‐term Show forest plot | 1 | 45 | Mean Difference (Fixed, 95% CI) | ‐0.54 [‐0.89, ‐0.19] |
|