Técnicas de una incisión versus dos incisiones para la reconstrucción del ligamento cruzado anterior guiada por artroscopia en adultos
Información
- DOI:
- https://doi.org/10.1002/14651858.CD010875.pub2Copiar DOI

- Base de datos:
-
- Cochrane Database of Systematic Reviews
- Versión publicada:
-
- 15 diciembre 2017see what's new
- Tipo:
-
- Intervention
- Etapa:
-
- Review
- Grupo Editorial Cochrane:
-
Grupo Cochrane de Lesiones óseas, articulares y musculares
- Copyright:
-
- Copyright © 2017 The Cochrane Collaboration. Published by John Wiley & Sons, Ltd.
Cifras del artículo
Altmetric:
Citado por:
Autores
Contributions of authors
Fernando Cury Rezende, Vinícius de Moraes, and Carlos Franciozi conceived and drafted the protocol and review. Vinícius de Moraes and João Carlos Belloti provided input on methodological issues. All authors revised and approved the final version of the review.
Fernando Cury Rezende is the guarantor of this review.
Sources of support
Internal sources
-
Escola Paulista de Medicina ‐ Universidade Federal de São Paulo, Brazil.
External sources
-
No sources of support supplied
Declarations of interest
Fernando C Rezende: none known
Vinícius Y Moraes: none known
Carlos ES Franciozi: none known
Pedro Debieux: none known
Marcus V Luzo: none known
João Carlos Belloti: none known
Acknowledgements
We would like to thank Helen Handoll, Zipporah Iheozor‐ejiofor, and Guanghua Lei for feedback on drafts of the review, and Lindsey Elstub and Joanne Elliott for editorial support.
We also thank Helen Handoll, Guanghua Lei, and Ana Luiza Cabrera Martimbianco for feedback on drafts of the protocol, and Joanne Elliott, Lindsey Elstub, and Laura MacDonald for editorial assistance on the protocol.
This project was supported by the National Institute for Health Research (NIHR) via Cochrane Infrastructure funding to the Cochrane Bone, Joint and Muscle Trauma Group. The views and opinions expressed therein are those of the authors and do not necessarily reflect those of the Systematic Reviews Programme, NIHR, National Health Service (NHS), or the Department of Health.
Version history
| Published | Title | Stage | Authors | Version |
| 2017 Dec 15 | One‐incision versus two‐incision techniques for arthroscopically assisted anterior cruciate ligament reconstruction in adults | Review | Fernando C Rezende, Vinícius Y Moraes, Carlos ES Franciozi, Pedro Debieux, Marcus V Luzo, João Carlos Belloti | |
| 2013 Dec 17 | One‐incision versus two‐incision techniques for arthroscopically‐assisted anterior cruciate ligament reconstruction in adults | Protocol | Fernando C Rezende, Vinícius Y Moraes, Carlos ES Franciozi, Pedro Debieux, Marcus V Luzo, João Carlos Belloti | |
Differences between protocol and review
Types of interventions
We clarified that the same grafts, fixation devices, and other techniques needed to be used for both intervention groups to ensure that the comparison was strictly one‐incision versus two‐incision techniques.
Types of outcome measures
In our protocol, we omitted to include composite clinical (clinician‐rated) scores, specifically the objective part of the International Knee Documentation Committee (IKDC). The IKDC results are categorised as normal (level A), nearly normal (level B), abnormal (level C), and severely abnormal (level D). In our analyses, as recommended by Irrgang 2001, we opted to pool the first two groups (A and B) to compare data of participants with normal or nearly normal results with participants of the other two groups (C and D), allowing meta‐analyses of dichotomous outcomes.
In the protocol, we set the threshold for distinguishing between intermediate‐ and long‐term follow‐up at three years. In the review we changed this to two years, which was consistent with follow‐up times of the contributing trials and a related Cochrane Review (Mohtadi 2011). Additionally, based on data availability, we presented long‐term data separately for two to five years and six years and above.
Furthermore, we made a post hoc decision to report outcome of longer duration if an outcome was reported at different time points classed under the same follow‐up period (short, intermediate, or long term). Thus if data for two different time points belonging to the same period were available, we reported the longer‐duration data.
'Risk of bias' assessment
We decided against performing separate analyses of subjective and objective outcomes of the following 'Risk of bias' domains: blinding of participants and personnel, blinding of outcome assessment, and incomplete outcome data, because we considered that the judgements for the two categories of outcome would be comparable.
'Summary of findings' table
We adjusted the list of outcomes stipulated for inclusion in the 'Summary of findings' table to make clear the time frames selected for subjective assessment of function, quality of life, and activity level outcomes. We added objective functional knee assessments (IKDC) at intermediate‐term follow‐up.
Keywords
MeSH
Medical Subject Headings (MeSH) Keywords
Medical Subject Headings Check Words
Adult; Humans;
PICO

Study flow diagram.

Risk of bias summary: review authors' judgements about each risk of bias item for each included study.
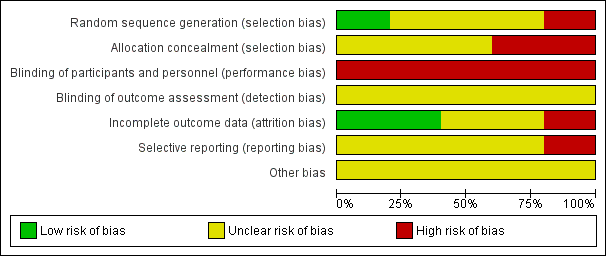
Risk of bias graph: review authors' judgements about each risk of bias item presented as percentages across all included studies.
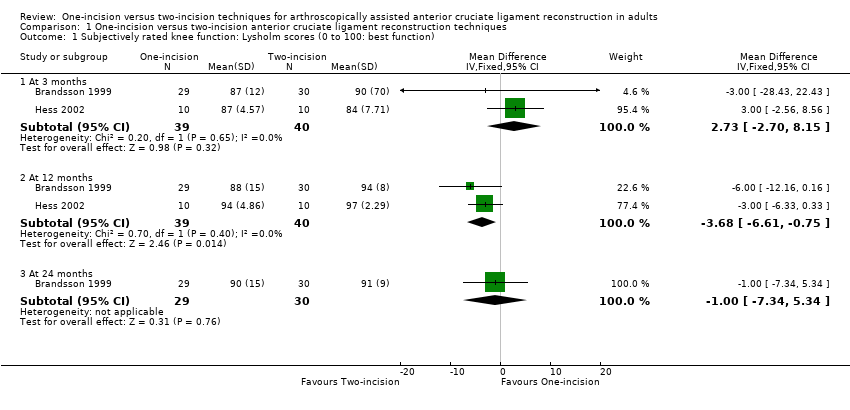
Comparison 1 One‐incision versus two‐incision anterior cruciate ligament reconstruction techniques, Outcome 1 Subjectively rated knee function: Lysholm scores (0 to 100: best function).
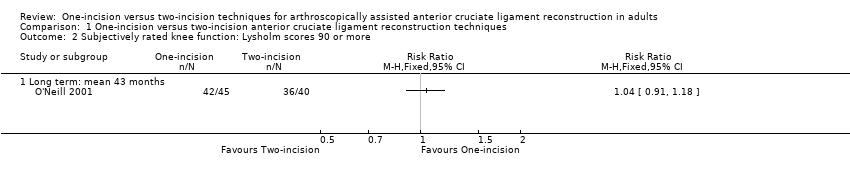
Comparison 1 One‐incision versus two‐incision anterior cruciate ligament reconstruction techniques, Outcome 2 Subjectively rated knee function: Lysholm scores 90 or more.

Comparison 1 One‐incision versus two‐incision anterior cruciate ligament reconstruction techniques, Outcome 3 Adverse events.
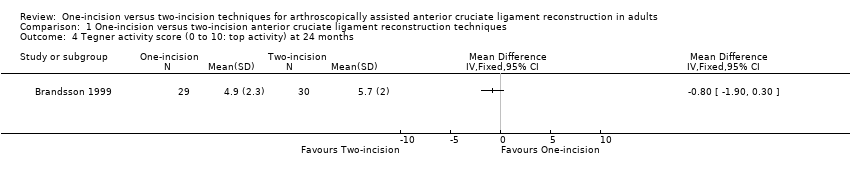
Comparison 1 One‐incision versus two‐incision anterior cruciate ligament reconstruction techniques, Outcome 4 Tegner activity score (0 to 10: top activity) at 24 months.
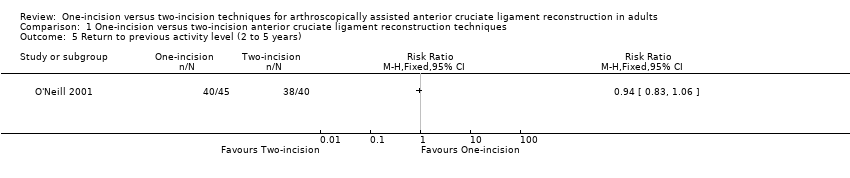
Comparison 1 One‐incision versus two‐incision anterior cruciate ligament reconstruction techniques, Outcome 5 Return to previous activity level (2 to 5 years).

Comparison 1 One‐incision versus two‐incision anterior cruciate ligament reconstruction techniques, Outcome 6 IKDC objective assessment: normal or nearly normal.

Comparison 1 One‐incision versus two‐incision anterior cruciate ligament reconstruction techniques, Outcome 7 Objective function tests: one‐leg hop quotient (% of other leg) (24 months).

Comparison 1 One‐incision versus two‐incision anterior cruciate ligament reconstruction techniques, Outcome 8 Objective function tests: one‐leg hop > 90% contralateral (2 to 5 years).
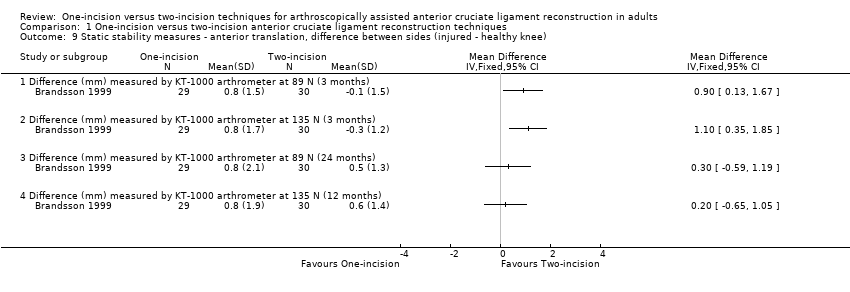
Comparison 1 One‐incision versus two‐incision anterior cruciate ligament reconstruction techniques, Outcome 9 Static stability measures ‐ anterior translation, difference between sides (injured ‐ healthy knee).

Comparison 1 One‐incision versus two‐incision anterior cruciate ligament reconstruction techniques, Outcome 10 Static stability measures ‐ anterior translation side‐to‐side difference < 3 mm.

Comparison 1 One‐incision versus two‐incision anterior cruciate ligament reconstruction techniques, Outcome 11 Static stability measures ‐ various.

Comparison 1 One‐incision versus two‐incision anterior cruciate ligament reconstruction techniques, Outcome 12 Patellofemoral pain score (0 to 20: best outcome).

Comparison 1 One‐incision versus two‐incision anterior cruciate ligament reconstruction techniques, Outcome 13 Pain (early and late postoperative pain).

Comparison 1 One‐incision versus two‐incision anterior cruciate ligament reconstruction techniques, Outcome 14 Knee range of motion (degrees).
| Study | Variable (degrees) | One‐incision n = 15 | Two‐incision n = 12 | Mean difference |
| Reat 1997 | Extension | ‐4° | ‐2° | ‐2° |
| Reat 1997 | Flexion | 135° | 134° | 1° |
| Reat 1997 | Range of motion | 139° | 136° | 3° |
Comparison 1 One‐incision versus two‐incision anterior cruciate ligament reconstruction techniques, Outcome 15 Range of motion at mean 15 months follow‐up (range 5 to 28 months).
| Study | Muscle and conditions | One‐incision n = 10 | Two‐incision n = 10 | MD | Reported P |
| 3 months | |||||
| Hess 2002 | Extensor, 60 deg/sec, concentric | 65.8 | 52.3 | 13.5 | 0.05 |
| Hess 2002 | Extensor, 180 deg/sec, concentric | 80.3 | 57.7 | 22.6 | 0.01 |
| Hess 2002 | Extensor, 60 deg/sec, eccentric | 67.1 | 51 | 16.1 | > 0.05 |
| Hess 2002 | Extensor, 180 deg/sec, eccentric | 68.8 | 51.7 | 17.1 | > 0.05 |
| Hess 2002 | Flexor, 60 deg/sec, concentric | 110.4 | 82.7 | 27.7 | 0.02 |
| Hess 2002 | Flexor, 180 deg/sec, concentric | 118.3 | 91.5 | 26.8 | > 0.05 |
| Hess 2002 | Flexor, 60 deg/sec, eccentric | 82.3 | 67.7 | 14.6 | > 0.05 |
| Hess 2002 | Flexor, 180 deg/sec, eccentric | 92.2 | 75.7 | 16.5 | > 0.05 |
| 6 months | |||||
| Hess 2002 | Extensor, 60 deg/sec, concentric | 79.3 | 61.1 | 18.2 | 0.03 |
| Hess 2002 | Extensor, 180 deg/sec, concentric | 82.2 | 78.3 | 3.9 | > 0.05 |
| Hess 2002 | Extensor, 60 deg/sec, eccentric | 92.5 | 55 | 37.5 | 0.02 |
| Hess 2002 | Extensor, 180 deg/sec, eccentric | 77.9 | 65 | 12.9 | 0.05 |
| Hess 2002 | Flexor, 60 deg/sec, concentric | 108.1 | 91.5 | 16.6 | 0.03 |
| Hess 2002 | Flexor, 180 deg/sec, concentric | 100.6 | 99.9 | 0.7 | > 0.05 |
| Hess 2002 | Flexor, 60 deg/sec, eccentric | 94.5 | 79.8 | 14.7 | > 0.05 |
| Hess 2002 | Flexor, 180 deg/sec, eccentric | 107.8 | 87.9 | 19.9 | > 0.05 |
Comparison 1 One‐incision versus two‐incision anterior cruciate ligament reconstruction techniques, Outcome 16 Peak torque forces (% contralateral side) at 3 and 6 months.

Comparison 1 One‐incision versus two‐incision anterior cruciate ligament reconstruction techniques, Outcome 17 Muscle strength (peak torque forces) at 12 months.
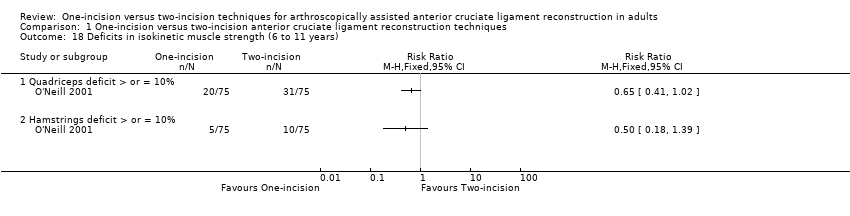
Comparison 1 One‐incision versus two‐incision anterior cruciate ligament reconstruction techniques, Outcome 18 Deficits in isokinetic muscle strength (6 to 11 years).
| One‐incision compared to two‐incision techniques for arthroscopically assisted anterior cruciate ligament (ACL) reconstruction in adults | ||||||
| Patient or population: adults undergoing arthroscopically assisted ACL reconstruction1 Intervention: one‐incision technique | ||||||
| Outcomes | Illustrative comparative risks* (95% CI) | Relative effect | No. of participants | Quality of the evidence | Comments | |
| Assumed risk | Corresponding risk | |||||
| Two‐incision technique (control) | One‐incision technique (intervention) | |||||
| Subjective function (short term)2: Lysholm knee score (0 to 100: higher scores = better function) | The mean Lysholm score in the two‐incision groups ranged from 84 to 90. | The mean Lysholm score in the one‐incision groups was 2.73 higher (2.70 lower to 8.15 higher). | ‐ | 79 | ⊕⊝⊝⊝ | The 95% CI are unlikely to include a clinically important difference.4 |
| Subjective function (intermediate term)2: Lysholm knee score (0 to 100: higher scores = better function) | The mean Lysholm score in the two‐incision groups ranged from 94 to 97. | The mean Lysholm score in the one‐incision groups was 3.68 lower (0.75 to 6.61 lower). | ‐ | 79 | ⊕⊝⊝⊝ | The 95% CI are unlikely to include a clinically important difference.4 A similar lack of differences was found in 2 studies at 24 months (very low‐quality evidence).5 |
| Subjective function (long term)2: Lysholm knee score (0 to 100: higher scores = better function) Follow‐up: mean 43 months; range 2 to 5 years | 900 per 10006 | 936 per 1000 | RR 1.04 | 85 | ⊕⊝⊝⊝ | ‐ |
| Quality of life(intermediate term)2 | See comment | See comment | ‐ | ‐ | See comment | No quality of life measures were reported. |
| Adverse events (overall) | See comment | See comment | ‐ | ‐ | See comment | 4 studies reported on specific complications but not overall numbers. There was very low‐quality evidence of little between‐group differences.8 |
| Activity level (intermediate term) Tegner activity score (0 to 10: highest sport activity) | The mean Tegner activity score in the two‐incision group was 5.7. | The mean Tegner activity score in the one‐incision group was 0.8 lower (1.9 lower to 0.3 higher) | ‐ | 59 | ⊕⊝⊝⊝ | ‐ |
| Objective functional knee assessments using IKDC10 (intermediate term)(normal or nearly normal assessment) | 698 per 100011 | 705 per 1000 | RR 1.01 (0.85 to 1.21) | 167 | ⊕⊝⊝⊝ | ‐ |
| *The risk in the intervention group (and its 95% confidence interval) is based on the assumed risk in the comparison group and the relative effect of the intervention (and its 95% CI). | ||||||
| GRADE Working Group grades of evidence | ||||||
| 1All grafts used in the five included trials were patellar tendons. The participants were mainly in their 20s. | ||||||
| Outcome or subgroup title | No. of studies | No. of participants | Statistical method | Effect size |
| 1 Subjectively rated knee function: Lysholm scores (0 to 100: best function) Show forest plot | 2 | Mean Difference (IV, Fixed, 95% CI) | Subtotals only | |
| 1.1 At 3 months | 2 | 79 | Mean Difference (IV, Fixed, 95% CI) | 2.73 [‐2.70, 8.15] |
| 1.2 At 12 months | 2 | 79 | Mean Difference (IV, Fixed, 95% CI) | ‐3.68 [‐6.61, ‐0.75] |
| 1.3 At 24 months | 1 | 59 | Mean Difference (IV, Fixed, 95% CI) | ‐1.0 [‐7.34, 5.34] |
| 2 Subjectively rated knee function: Lysholm scores 90 or more Show forest plot | 1 | Risk Ratio (M‐H, Fixed, 95% CI) | Totals not selected | |
| 2.1 Long term: mean 43 months | 1 | Risk Ratio (M‐H, Fixed, 95% CI) | 0.0 [0.0, 0.0] | |
| 3 Adverse events Show forest plot | 4 | Risk Ratio (M‐H, Fixed, 95% CI) | Subtotals only | |
| 3.1 Infection | 2 | 89 | Risk Ratio (M‐H, Fixed, 95% CI) | 1.03 [0.07, 15.77] |
| 3.2 Nerve palsy | 1 | 59 | Risk Ratio (M‐H, Fixed, 95% CI) | 0.34 [0.01, 8.13] |
| 3.3 Haemarthrosis requiring joint aspiration | 1 | 59 | Risk Ratio (M‐H, Fixed, 95% CI) | 0.34 [0.04, 3.13] |
| 3.4 Deep vein thrombosis | 1 | 30 | Risk Ratio (M‐H, Fixed, 95% CI) | 3.0 [0.13, 68.26] |
| 3.5 Knee stiffness (loss of terminal extension) (2 to 5 years) | 2 | 144 | Risk Ratio (M‐H, Fixed, 95% CI) | 1.77 [0.40, 7.79] |
| 3.6 Knee stiffness (loss of terminal flexion) (2 to 5 years) | 2 | 144 | Risk Ratio (M‐H, Fixed, 95% CI) | 0.50 [0.14, 1.72] |
| 3.7 Recurrent instability (giving way) | 1 | 27 | Risk Ratio (M‐H, Fixed, 95% CI) | 2.44 [0.11, 54.97] |
| 3.8 Knee swelling at final follow‐up | 1 | 27 | Risk Ratio (M‐H, Fixed, 95% CI) | 1.12 [0.47, 2.65] |
| 3.9 Reoperations | 3 | 205 | Risk Ratio (M‐H, Fixed, 95% CI) | 0.89 [0.37, 2.14] |
| 3.10 Graft failure (6 to 11 years) | 1 | 150 | Risk Ratio (M‐H, Fixed, 95% CI) | 1.25 [0.35, 4.47] |
| 4 Tegner activity score (0 to 10: top activity) at 24 months Show forest plot | 1 | Mean Difference (IV, Fixed, 95% CI) | Totals not selected | |
| 5 Return to previous activity level (2 to 5 years) Show forest plot | 1 | Risk Ratio (M‐H, Fixed, 95% CI) | Totals not selected | |
| 6 IKDC objective assessment: normal or nearly normal Show forest plot | 5 | Risk Ratio (M‐H, Fixed, 95% CI) | Subtotals only | |
| 6.1 At 3 to 6 months | 2 | 43 | Risk Ratio (M‐H, Fixed, 95% CI) | 0.59 [0.33, 1.03] |
| 6.2 At 12 to 28 months | 4 | 167 | Risk Ratio (M‐H, Fixed, 95% CI) | 1.01 [0.85, 1.21] |
| 6.3 At 6 to 11 years | 1 | 150 | Risk Ratio (M‐H, Fixed, 95% CI) | 0.99 [0.91, 1.07] |
| 7 Objective function tests: one‐leg hop quotient (% of other leg) (24 months) Show forest plot | 1 | Mean Difference (IV, Fixed, 95% CI) | Totals not selected | |
| 8 Objective function tests: one‐leg hop > 90% contralateral (2 to 5 years) Show forest plot | 1 | Risk Ratio (M‐H, Fixed, 95% CI) | Totals not selected | |
| 9 Static stability measures ‐ anterior translation, difference between sides (injured ‐ healthy knee) Show forest plot | 1 | Mean Difference (IV, Fixed, 95% CI) | Totals not selected | |
| 9.1 Difference (mm) measured by KT‐1000 arthrometer at 89 N (3 months) | 1 | Mean Difference (IV, Fixed, 95% CI) | 0.0 [0.0, 0.0] | |
| 9.2 Difference (mm) measured by KT‐1000 arthrometer at 135 N (3 months) | 1 | Mean Difference (IV, Fixed, 95% CI) | 0.0 [0.0, 0.0] | |
| 9.3 Difference (mm) measured by KT‐1000 arthrometer at 89 N (24 months) | 1 | Mean Difference (IV, Fixed, 95% CI) | 0.0 [0.0, 0.0] | |
| 9.4 Difference (mm) measured by KT‐1000 arthrometer at 135 N (12 months) | 1 | Mean Difference (IV, Fixed, 95% CI) | 0.0 [0.0, 0.0] | |
| 10 Static stability measures ‐ anterior translation side‐to‐side difference < 3 mm Show forest plot | 4 | 297 | Risk Ratio (M‐H, Fixed, 95% CI) | 0.96 [0.85, 1.09] |
| 10.1 Measured by KT‐1000 arthrometer (12 to 24 months) | 2 | 86 | Risk Ratio (M‐H, Fixed, 95% CI) | 0.95 [0.78, 1.15] |
| 10.2 Measured by KT‐2000 arthrometer (2 to 5 years) | 2 | 211 | Risk Ratio (M‐H, Fixed, 95% CI) | 0.97 [0.83, 1.14] |
| 11 Static stability measures ‐ various Show forest plot | 2 | Risk Ratio (M‐H, Fixed, 95% CI) | Totals not selected | |
| 11.1 Pivot‐Shift (normal or nearly normal) (3 months) | 1 | Risk Ratio (M‐H, Fixed, 95% CI) | 0.0 [0.0, 0.0] | |
| 11.2 Lachman (normal or nearly normal) (3 months) | 1 | Risk Ratio (M‐H, Fixed, 95% CI) | 0.0 [0.0, 0.0] | |
| 11.3 Pivot‐Shift (normal or nearly normal) (12 months) | 1 | Risk Ratio (M‐H, Fixed, 95% CI) | 0.0 [0.0, 0.0] | |
| 11.4 Lachman (normal or nearly normal) (12 months) | 1 | Risk Ratio (M‐H, Fixed, 95% CI) | 0.0 [0.0, 0.0] | |
| 11.5 Lachman (normal or nearly normal) (2 to 5 years) | 1 | Risk Ratio (M‐H, Fixed, 95% CI) | 0.0 [0.0, 0.0] | |
| 12 Patellofemoral pain score (0 to 20: best outcome) Show forest plot | 1 | Mean Difference (IV, Fixed, 95% CI) | Totals not selected | |
| 12.1 Patellofemoral pain score (3 months) | 1 | Mean Difference (IV, Fixed, 95% CI) | 0.0 [0.0, 0.0] | |
| 12.2 Patellofemoral pain score (12 months) | 1 | Mean Difference (IV, Fixed, 95% CI) | 0.0 [0.0, 0.0] | |
| 12.3 Patellofemoral pain score (24 months) | 1 | Mean Difference (IV, Fixed, 95% CI) | 0.0 [0.0, 0.0] | |
| 13 Pain (early and late postoperative pain) Show forest plot | 1 | Risk Ratio (M‐H, Fixed, 95% CI) | Totals not selected | |
| 13.1 Pain (6 weeks) | 1 | Risk Ratio (M‐H, Fixed, 95% CI) | 0.0 [0.0, 0.0] | |
| 13.2 Late pain (mean 15 months) | 1 | Risk Ratio (M‐H, Fixed, 95% CI) | 0.0 [0.0, 0.0] | |
| 14 Knee range of motion (degrees) Show forest plot | 1 | Mean Difference (IV, Fixed, 95% CI) | Totals not selected | |
| 14.1 Flexion (3 months) | 1 | Mean Difference (IV, Fixed, 95% CI) | 0.0 [0.0, 0.0] | |
| 14.2 Flexion (6 months) | 1 | Mean Difference (IV, Fixed, 95% CI) | 0.0 [0.0, 0.0] | |
| 14.3 Flexion (12 months) | 1 | Mean Difference (IV, Fixed, 95% CI) | 0.0 [0.0, 0.0] | |
| 14.4 Extension (3 months) | 1 | Mean Difference (IV, Fixed, 95% CI) | 0.0 [0.0, 0.0] | |
| 14.5 Extension (6 months) | 1 | Mean Difference (IV, Fixed, 95% CI) | 0.0 [0.0, 0.0] | |
| 14.6 Extension (12 months) | 1 | Mean Difference (IV, Fixed, 95% CI) | 0.0 [0.0, 0.0] | |
| 15 Range of motion at mean 15 months follow‐up (range 5 to 28 months) Show forest plot | Other data | No numeric data | ||
| 16 Peak torque forces (% contralateral side) at 3 and 6 months Show forest plot | Other data | No numeric data | ||
| 16.1 3 months | Other data | No numeric data | ||
| 16.2 6 months | Other data | No numeric data | ||
| 17 Muscle strength (peak torque forces) at 12 months Show forest plot | 1 | Mean Difference (IV, Fixed, 95% CI) | Totals not selected | |
| 17.1 Extensors (60º) under concentric isokinetic movement | 1 | Mean Difference (IV, Fixed, 95% CI) | 0.0 [0.0, 0.0] | |
| 17.2 Extensors (180º) under concentric isokinetic movement | 1 | Mean Difference (IV, Fixed, 95% CI) | 0.0 [0.0, 0.0] | |
| 17.3 Extensors (60º) under eccentric isokinetic movement | 1 | Mean Difference (IV, Fixed, 95% CI) | 0.0 [0.0, 0.0] | |
| 17.4 Extensors (180º) under eccentric isokinetic movement | 1 | Mean Difference (IV, Fixed, 95% CI) | 0.0 [0.0, 0.0] | |
| 17.5 Flexors (60º) under concentric isokinetic movement | 1 | Mean Difference (IV, Fixed, 95% CI) | 0.0 [0.0, 0.0] | |
| 17.6 Flexors (180º) under concentric isokinetic movement | 1 | Mean Difference (IV, Fixed, 95% CI) | 0.0 [0.0, 0.0] | |
| 17.7 Flexors (60º) under eccentric isokinetic movement | 1 | Mean Difference (IV, Fixed, 95% CI) | 0.0 [0.0, 0.0] | |
| 17.8 Flexors (180º) under eccentric isokinetic movement | 1 | Mean Difference (IV, Fixed, 95% CI) | 0.0 [0.0, 0.0] | |
| 18 Deficits in isokinetic muscle strength (6 to 11 years) Show forest plot | 1 | Risk Ratio (M‐H, Fixed, 95% CI) | Totals not selected | |
| 18.1 Quadriceps deficit > or = 10% | 1 | Risk Ratio (M‐H, Fixed, 95% CI) | 0.0 [0.0, 0.0] | |
| 18.2 Hamstrings deficit > or = 10% | 1 | Risk Ratio (M‐H, Fixed, 95% CI) | 0.0 [0.0, 0.0] | |