Técnicas de una incisión versus dos incisiones para la reconstrucción del ligamento cruzado anterior guiada por artroscopia en adultos
Resumen
Antecedentes
Los desgarros del ligamento cruzado anterior (LCA) son lesiones graves de la rodilla que con frecuencia se tratan de forma quirúrgica mediante la reconstrucción guiada por artroscopia con injertos del tendón rotuliano o de los tendones isquiotibiales. Se examinó la evidencia sobre la elección de la técnica de reconstrucción del LCA guiada por artroscopia en cuanto a si debe incluir una incisión (túnel femoral perforado desde dentro de la articulación de la rodilla bajo visualización artroscópica) o dos incisiones (túnel femoral perforado desde fuera hasta dentro de la articulación de la rodilla).
Objetivos
Evaluar los efectos (beneficiosos y perjudiciales) de las técnicas de una incisión versus de dos incisiones para la reconstrucción del LCA guiada por artroscopia en adultos.
Métodos de búsqueda
Se hicieron búsquedas en el registro especializado del Grupo Cochrane de Lesiones Óseas, Articulares y Musculares (Cochrane Bone, Joint and Muscle Trauma Group Specialised Register), Registro Cochrane Central de Ensayos Controlados (Cochrane Central Register of Controlled Trials) (CENTRAL), MEDLINE, Embase, Latin American and Caribbean Health Sciences (LILACS), en la World Health Organization International Clinical Trials Registry Platform, ClinicalTrials.gov, en listas de referencias y en resúmenes de congresos. La fecha de la búsqueda fue el 16 de agosto de 2017.
Criterios de selección
Ensayos clínicos controlados aleatorizados y cuasialeatorizados que evaluaran las técnicas de una incisión versus de dos incisiones para la reconstrucción del LCA guiada por artroscopia en adultos.
Obtención y análisis de los datos
Dos autores de la revisión, de forma independiente, buscaron y seleccionaron los estudios, y extrajeron los datos y evaluaron el riesgo de sesgo de los estudios elegibles. Se realizó un agrupamiento limitado de los datos mediante el modelo de efectos fijos.
Resultados principales
Se incluyeron cinco ensayos (cuatro aleatorizados y uno cuasialeatorizado) que evaluaron un total de 320 participantes veinteañeros. Todos los participantes fueron sometidos a la reconstrucción del LCA con injertos del tendón rotuliano. Los cinco ensayos incluidos estuvieron en riesgo alto de sesgo, en particular de sesgo de realización. Basado en estas limitaciones y la insuficiencia de datos disponibles que dio lugar a la imprecisión de los cálculos del efecto, la calidad de la evidencia se consideró muy baja para todos los resultados. Lo anterior significa que no existe seguridad en cuanto a los resultados de la revisión.
Se encontró evidencia de muy baja calidad de que no hay diferencias clínicamente importantes entre las dos técnicas en la función de la rodilla autoinformada, medida con la puntuación de la rodilla de Lysholm (escala 0 a 100: mejor resultado), a corto plazo (3 meses) (la diferencia de medias (DM) 2,73 favorece la técnica de una incisión, intervalo de confianza (IC) del 95%: ‐2,70 a 8,15; 79 participantes, 2 estudios), a medio plazo (12 meses) (la DM ‐3,68 favorece la técnica de dos incisiones, IC del 95%: ‐6,61 a ‐0,75; 79 participantes, 2 estudios) y el seguimiento a largo plazo. Los datos disponibles para el seguimiento a largo plazo (2 a 5 años) se expresaron en términos del número de participantes con puntuaciones excelentes de Lysholm (90 puntos o más); no se encontraron diferencias entre los dos grupos (42/45 versus 36/40; riesgo relativo (RR) 1,04, IC del 95%: 0,91 a 1,18; 1 estudio). No hubo datos sobre las medidas de la calidad de vida ni sobre los números generales de participantes que sufrieron un evento adverso. Se encontró evidencia de muy baja calidad de diferencias pequeñas entre los grupos en los eventos adversos individuales como la infección, la rigidez de la rodilla, la nueva cirugía y el fracaso del injerto.
Se encontró evidencia de muy baja calidad de un estudio (59 participantes) de poca diferencia entre los dos grupos en los niveles de actividad medidos con las puntuaciones de Tegner (escala de 0 a 10: mayor actividad deportiva) a los dos años (DM ‐0,80 favorece la técnica de dos incisiones, IC del 95%: ‐1,90 a 0,30). Hubo evidencia de muy baja calidad de cuatro estudios de diferencias mínimas entre los grupos en el número de participantes con una función normal o casi normal de la rodilla medida de forma objetiva (clasificación de la evaluación objetiva del International Knee Documentation Committee) al momento del seguimiento intermedio (media 12 a 28 meses): 56/78 versus 63/89; RR 1,01; IC del 95%: 0,85 a 1,21; 167 participantes).
Conclusiones de los autores
Las evidencia de muy baja calidad y a menudo ausente significa que no se sabe con certeza si las técnicas de reconstrucción del LCA con una incisión, asistidas por artroscopia, dan mejores, peores o equivalentes resultados en comparación con las técnicas de dos incisiones en cuanto a la función subjetiva a corto, medio o largo plazo, la calidad de vida, los resultados adversos, los niveles de actividad y la función de la rodilla calificada objetivamente. Sólo hubo evidencia disponible para la reconstrucción del LCA con banda simple mediante el uso de injertos del tendón rotuliano.
Al considerar las prioridades para los ensayos aleatorizados de alta calidad sobre las técnicas para la reconstrucción del LCA, es importante observar la insuficiencia de evidencia disponible para informar esta comparación clave.
PICOs
Resumen en términos sencillos
Técnicas quirúrgicas de una incisión versus dos incisiones para la reconstrucción del ligamento cruzado anterior en adultos
Antecedentes
El ligamento cruzado anterior (LCA) es una banda de tejido fuerte dentro de la rodilla que ayuda a estabilizar la rodilla durante el movimiento. La ruptura del LCA es una lesión común durante algunas actividades deportivas, como el fútbol y el esquí. Las lesiones del ligamento cruzado anterior suelen tratarse de forma quirúrgica. Dicho procedimiento por lo general incluye la reconstrucción del LCA mínimamente invasiva (artroscópica), en la que el LCA desgarrado es reemplazado por una porción de tendón (injerto). Por lo general, el injerto se extrae de otro lugar cercano a la rodilla afectada del paciente. En la reconstrucción del LCA, se perforan túneles óseos en la rodilla en la tibia (hueso de la espinilla) y el fémur (hueso del muslo) para colocar el injerto de LCA en casi la misma posición que el LCA desgarrado.
Esta revisión comparó dos técnicas de reconstrucción del LCA: una incisión versus dos incisiones. La técnica de dos incisiones es más habitual e incluye la perforación del túnel femoral (desde el fémur) desde el exterior al interior de la articulación de la rodilla con una incisión realizada en el aspecto exterior del muslo para alcanzar el hueso. En la técnica de una incisión, no hay una (segunda) incisión en el muslo. En cambio el injerto se fija al fémur desde el interior hacia fuera de la articulación mediante guía artroscópica.
Resultados de la búsqueda
Se efectuaron búsquedas en las bases de datos de la bibliografía médica hasta agosto de 2017 para obtener estudios aleatorizados que compararan las técnicas de una incisión versus dos incisiones para la reconstrucción artroscópica del LCA. Se incluyeron cinco ensayos con 320 pacientes sometidos a la reconstrucción del LCA con injertos del tendón rotuliano. La mayoría de los participantes en el estudio tenían unos 20 años.
Resultados clave
No se encontró ninguna diferencia entre las dos técnicas en el autoinforme de la función de la rodilla alrededor de los tres meses, 12 meses, o entre los dos y cinco años. No hubo datos sobre la calidad de vida ni sobre el número global de participantes que sufrieron un evento adverso. Sin embargo, se encontró evidencia de diferencias pequeñas entre los grupos en los eventos adversos individuales como la infección, la rigidez de la rodilla y el fracaso del injerto. Hubo evidencia de poca diferencia entre los dos grupos en los niveles finales de actividad o el número de participantes con una función normal o casi normal de la rodilla evaluado por los médicos a un año o más después de la intervención quirúrgica.
Calidad de la evidencia
Los cinco estudios presentaban deficiencias que podrían afectar seriamente la confiabilidad de los resultados. Se consideró que la evidencia era de muy baja calidad, lo que significa que estos resultados no son muy confiables.
Conclusiones
La falta de evidencia fiable significa que no existe seguridad sobre si las técnicas de una incisión para la reconstrucción del LCA guiada por artroscopia son mejores (o peores) que las técnicas de dos incisiones. La investigación adicional ayudaría a responder esta pregunta aunque puede no ser una prioridad actual.
Authors' conclusions
Summary of findings
| One‐incision compared to two‐incision techniques for arthroscopically assisted anterior cruciate ligament (ACL) reconstruction in adults | ||||||
| Patient or population: adults undergoing arthroscopically assisted ACL reconstruction1 Intervention: one‐incision technique | ||||||
| Outcomes | Illustrative comparative risks* (95% CI) | Relative effect | No. of participants | Quality of the evidence | Comments | |
| Assumed risk | Corresponding risk | |||||
| Two‐incision technique (control) | One‐incision technique (intervention) | |||||
| Subjective function (short term)2: Lysholm knee score (0 to 100: higher scores = better function) | The mean Lysholm score in the two‐incision groups ranged from 84 to 90. | The mean Lysholm score in the one‐incision groups was 2.73 higher (2.70 lower to 8.15 higher). | ‐ | 79 | ⊕⊝⊝⊝ | The 95% CI are unlikely to include a clinically important difference.4 |
| Subjective function (intermediate term)2: Lysholm knee score (0 to 100: higher scores = better function) | The mean Lysholm score in the two‐incision groups ranged from 94 to 97. | The mean Lysholm score in the one‐incision groups was 3.68 lower (0.75 to 6.61 lower). | ‐ | 79 | ⊕⊝⊝⊝ | The 95% CI are unlikely to include a clinically important difference.4 A similar lack of differences was found in 2 studies at 24 months (very low‐quality evidence).5 |
| Subjective function (long term)2: Lysholm knee score (0 to 100: higher scores = better function) Follow‐up: mean 43 months; range 2 to 5 years | 900 per 10006 | 936 per 1000 | RR 1.04 | 85 | ⊕⊝⊝⊝ | ‐ |
| Quality of life(intermediate term)2 | See comment | See comment | ‐ | ‐ | See comment | No quality of life measures were reported. |
| Adverse events (overall) | See comment | See comment | ‐ | ‐ | See comment | 4 studies reported on specific complications but not overall numbers. There was very low‐quality evidence of little between‐group differences.8 |
| Activity level (intermediate term) Tegner activity score (0 to 10: highest sport activity) | The mean Tegner activity score in the two‐incision group was 5.7. | The mean Tegner activity score in the one‐incision group was 0.8 lower (1.9 lower to 0.3 higher) | ‐ | 59 | ⊕⊝⊝⊝ | ‐ |
| Objective functional knee assessments using IKDC10 (intermediate term)(normal or nearly normal assessment) | 698 per 100011 | 705 per 1000 | RR 1.01 (0.85 to 1.21) | 167 | ⊕⊝⊝⊝ | ‐ |
| *The risk in the intervention group (and its 95% confidence interval) is based on the assumed risk in the comparison group and the relative effect of the intervention (and its 95% CI). | ||||||
| GRADE Working Group grades of evidence | ||||||
| 1All grafts used in the five included trials were patellar tendons. The participants were mainly in their 20s. | ||||||
Background
Description of the condition
The anterior cruciate ligament (ACL) is a tough band of tissue located in the centre of the knee joint that connects the tibia (shin bone) with the femur (thigh bone). It acts mainly to stabilise the knee against forward movement of the tibia relative to the femur. It also helps resist rotatory motion of the knee. The ACL courses from its posterior (back) attachment in the lateral (outer relative to the midline) femoral condyle (one of two rounded prominences of the femur that articulate with the tibia) towards the tibial attachment in its anterior (front) and slightly medial (inner relative to the midline) aspect (Girgis 1975).
Rupture of the ACL is a common injury in young adults involved in physical activities, especially sports such as football, rugby, and skiing. As participation in sports and recreational activities increases, the incidence of these injuries tends to increase. Anterior cruciate ligament injury may be the result of sudden deceleration, hyperextension, or a cutting action (Griffin 2000). The resultant instability of the knee prevents the resumption of a person's former level of activities. Moreover, recurrent episodes of knee instability may cause further injuries, such as meniscal tears, which might lead to early onset of knee osteoarthritis.
Current surgical treatment of ACL rupture comprises ACL reconstruction under arthroscopic guidance (Jackson 1987). Over 100,000 ACL reconstructions are conducted each year in the United States alone (Lyman 2009). In ACL reconstruction, the torn ligament is replaced by a piece of tendon (graft), which is either an autograft that is harvested from the patient him or herself or an allograft obtained from a cadaver.
Description of the intervention
Arthroscopically assisted ACL reconstruction is typically performed through two standard portals (small stab incisions through which a camera (arthroscope) and instruments are introduced). The general aim is to place the graft as near as possible to that of the native ligament. The structures within the knee joint are visualised through the arthroscope, and surgery is performed with small instruments. Bone tunnels are drilled into the tibia and the femur to place the ACL graft in almost the same position as the torn ACL. After introduction and positioning of the graft, the ends are fixed into place at or near the original attachment sites of the torn ACL with the use of various devices. These devices can be grouped according to their underlying mechanisms of fixation: compression (interference screw), expansion (a cross pin system (Rigidfix)), or suspension (button) (Zeng 2013). We illustrate here the procedures used in reconstruction with interference screws, which are threaded conical devices made of either metal or bioabsorbable material.
The choice of ACL reconstruction technique is not straightforward. One issue concerns the method of drilling the tunnel into the femur. Traditionally, the femoral tunnel is drilled from outside to inside the knee joint, and an incision is made in the outward aspect of the thigh to reach the bone (two‐incision technique) (Bach 1989). In this procedure, the graft is fixed to the femur from outside to inside the joint with an interference screw by direct visualisation of the tunnel through the thigh incision.
The one‐incision arthroscopic technique consists of drilling the femoral tunnel from inside the knee joint under arthroscopic visualisation, thereby sparing the thigh incision and quadriceps (anterior muscles of the thigh) dissection (Hardin 1992; Howell 1999). The graft is fixed to the femur from inside to outside the joint through arthroscopic guidance and then fixed with an interference screw. The only incision thus needed is the one for drilling the tunnel into the tibia, which is done (as in the two‐incision technique) through an anterior incision below the knee.
How the intervention might work
Anterior cruciate ligament reconstruction aims to restore knee stability. An additional goal of strong graft fixation is to facilitate early postsurgical rehabilitation during the so‐called 'weak link' time, when the process of tendon‐bone healing is incomplete.
Because there is no dissection of the tissues on the outward‐facing part of the knee, it has been suggested that the one‐incision technique should facilitate rehabilitation more successfully than the two‐incision technique (Hess 2002; Paulos 1994). However, the one‐incision technique is technically more challenging since the fixation of the graft to bone is done from inside the joint under arthroscopic control (Fanelli 1994). As the ultimate success of the ACL reconstruction procedure depends on secure and well‐placed fixation of the graft to the bone, compromises in graft fixation might be more relevant than avoiding a second incision. In the choice between the two techniques, there is thus a balance to be achieved between the potential for speedier recovery in the one‐incision technique and the potential for more reliable graft fixation in the technically less challenging two‐incision technique (Arciero 1996; Gill 2002).
Why it is important to do this review
Anterior cruciate ligament reconstruction is a common surgical procedure that involves many choices in terms of the type of graft, fixation devices, and surgical technique. Some treatment decisions have already been addressed in other Cochrane Reviews; these include the type of autograft (Mohtadi 2011), use of computer‐assisted reconstruction (Meuffels 2011), and double‐ versus single‐bundle reconstruction (Tiamklang 2012). However, research on ACL reconstruction is far from exhausted, and many other key treatment decisions have not yet reached consensus, nor have they been systematically reviewed. This includes the use of one‐incision versus two‐incision techniques, the subject of this review.
Objectives
To assess the effects (benefits and harms) of one‐incision versus two‐incision techniques for arthroscopically assisted anterior cruciate ligament (ACL) reconstruction in adults.
Methods
Criteria for considering studies for this review
Types of studies
We included randomised and quasi‐randomised (a method of allocating participants to a treatment that is not strictly random, e.g. by medical record number or date of birth) controlled clinical trials evaluating one‐incision versus two‐incision techniques for arthroscopically assisted ACL reconstruction in adults.
Types of participants
Adults (skeletally mature individuals) with ACL rupture who have undergone primary ACL reconstruction, irrespective of the presence of associated soft tissue knee injuries. We included trials irrespective of the type of graft used.
We excluded trials in which participants were treated surgically using open (that is through open arthrotomy reconstruction) rather than arthroscopic methods. We also excluded trials focusing on the treatment of people with previous ACL reconstruction requiring revision surgery.
Types of interventions
One‐incision versus two‐incision arthroscopically assisted reconstruction of ACL injuries. For a study to be included, the same grafts, fixation devices, and other techniques needed to be used in both intervention groups under comparison.
Types of outcome measures
Primary outcomes
-
Functional assessments based on subjectively assessed, preferably validated questionnaires of knee function, e.g. the International Knee Documentation Committee (IKDC) subjective part for knee ligament injuries and the Lysholm score (Irrgang 2001; Lysholm 1982).
-
Quality of life assessments based on subjective and preferably validated questionnaires, e.g. the ACL Quality of Life outcome measure (Mohtadi 1998), the Knee Injury and Osteoarthritis Outcome Score (KOOS) for the knee in general (Roos 1998), and the Medical Outcomes Study 36‐item short‐form health survey (SF‐36) for general measures (Ware 1992).
-
Adverse events including treatment failure (implant breakage, screw migration, graft loss, residual instability, infection, knee stiffness).
Secondary outcomes
-
Activity level measured by instruments (e.g. Tegner activity level scale) (Tegner 1985).
-
Return to previous activity level.
-
Clinical composite scores (e.g. clinician‐rated IKDC objective part categories) (Irrgang 2001).
-
Objective function tests (e.g. one‐leg hop test, vertical jump test).
-
Static stability measures (e.g. Lachman, Pivot‐Shift, Anterior Drawer tests, KT‐arthrometer side‐to‐side difference).
-
Pain measured by scales (such as a visual analogue scale) (Revill 1976).
-
Knee range of motion.
-
Muscle strength (Cybex isokinetic muscle strength testing or equivalent).
-
Thigh circumference.
-
Lateral and posteroanterior knee radiographs (femoral tunnel position ‐ anatomic or isometric).
Timing of outcome measurement
Where data were presented at different follow‐up times, we presented data separately for the short term (within six months of ACL reconstruction), intermediate term (six months up to two years of ACL reconstruction), and long term (greater than two years of ACL reconstruction). Additionally, based on data availability, we presented long‐term data separately for two to five years and six years and above.
Search methods for identification of studies
Electronic searches
We searched the Cochrane Bone, Joint and Muscle Trauma Group Specialised Register (to 16 August 2017), the Cochrane Central Register of Controlled Trials (CENTRAL) (2017; Issue 8), MEDLINE (including Epub Ahead of Print, In‐Process & Other Non‐Indexed Citations, MEDLINE Daily and Versions) (Ovid online) (1946 to 16 August 2017), Embase (Ovid online) (1974 to 16 August 2017), and Latin American and Caribbean Health Sciences (LILACS) (Virtual Health Library, IAHx platform) (1982 to 16 August 2017). We also searched the World Health Organization International Clinical Trials Registry Platform (WHO ICTRP) (apps.who.int/trialsearch) and ClinicalTrials.gov (clinicaltrials.gov/) (16 August 2017) for ongoing and recently completed studies. We did not apply any restrictions based on language or publication status.
In MEDLINE, a subject‐specific strategy was combined with the sensitivity‐maximising version of the Cochrane Highly Sensitive Search Strategy for identifying randomised trials (Lefebvre 2011). The search strategies for CENTRAL, MEDLINE, Embase, and LILACS are shown in Appendix 1.
Searching other resources
We checked the reference lists from relevant articles. We searched the conference abstracts of the following annual meetings from 2013: International Society of Arthroscopy, Knee Surgery and Orthopaedic Sports Medicine (ISAKOS) (isakos.com/) (to March 2015), American Orthopaedic Society for Sports Medicine (AOSSM) (www.sportsmed.org/) (to March 2015), and American Academy of Orthopaedic Surgeons (AAOS) (aaos.org/) (to March 2015). We contacted the authors of trials identified by searching conference proceedings for any unpublished trial reports and results.
Data collection and analysis
We described the intended methodology for data collection and analysis in our published protocol (Rezende 2013), which was based on the Cochrane Handbook for Systematic Reviews of Interventions (Higgins 2011).
Selection of studies
Two review authors (FR and VM) independently searched abstracts and titles for potentially eligible studies. After we obtained the full‐text reports of these studies, the same two review authors independently performed study selection. Any disagreements were discussed. When consensus was not achieved, a third review author (JB) was consulted.
Data extraction and management
Two review authors (FR and PD) independently extracted the trial characteristics and results data from eligible studies using a piloted data collection form. We attempted to contact trial authors in order to obtain missing data or for clarification. Disagreements were resolved by discussion, with a third review author (JB) consulted when necessary.
Assessment of risk of bias in included studies
Two review authors (FR and CF) assessed the risk of bias of the included studies using Cochrane's 'Risk of bias' tool (Higgins 2011). This consists of seven domains: sequence generation, allocation concealment, blinding of participants and personnel, blinding of outcome assessment, incomplete outcome data, selective outcome reporting, and other bias (e.g. bias from major differences in baseline characteristics, performance bias due to disparity in the experience of the surgeons performing the procedures, and the influence of funding sources as a potential cause of bias). We assessed each domain as being 'low risk', 'high risk', or ' unclear risk'. We decided against considering objective and subjective outcomes separately for the two blinding domains and incomplete outcome data, as specified in our protocol; see Differences between protocol and review. Disagreements were resolved by discussion, with a third review author (JB) consulted when necessary.
Measures of treatment effect
We calculated risk ratios (RRs) and 95% confidence intervals (95% CIs) for dichotomous outcomes, and mean differences and 95% CIs for continuous outcomes. We would have used standardised mean differences rather than mean differences had we needed to pool data from continuous outcome measures based on different scoring schemes (e.g. functional outcomes such as the IKDC, ACL Quality of Life, and Lysholm scores). We would have collected results based on change scores only if final values were not available.
Unit of analysis issues
Clinical trials included in this review followed the 'standard model', in which participants with unilateral ACL rupture are randomised to either a one‐ or a two‐incision technique. Bilateral ACL ruptures are rare, but had these been included in trials and no adjustments made, we planned to present the data for knees rather than for individual participants if the disparity between the units of analysis and randomisation was small. We have taken steps to avoid unit of analysis issues relating to presentation of data at multiple time points and the presentation of outcomes, such as overall complications, that could have occurred more than once in individual participants by performing separate analyses for different follow‐up times.
Dealing with missing data
We attempted to contact trial investigators to request missing information and data, such as the number of events or participants, means and standard deviations. Where possible, we performed intention‐to‐treat analyses. In the absence of standard deviations (SDs), we would have calculated these from other statistics such as standard errors, 95% CIs, and exact P values had these been available. As previously stipulated, we did not impute missing means or SDs.
Where data continued to be unavailable, we assessed whether or not these data were missing at random. When data were thought to be missing at random, or considered to be irrelevant, we ignored them and worked only with the available and relevant data. If data were assumed to not be missing at random, we would have conducted sensitivity analyses to explore the potential effects of these missing data on the results.
Assessment of heterogeneity
We appraised the heterogeneity of intervention effects of studies visually by observing the overlapping of results in the analyses. We would have interpreted the lack of overlapping as indicative of possible heterogeneity. Using Review Manager 5 software (RevMan 2014), we calculated I2 values, which we interpreted as follows: insignificant heterogeneity (between 0% to 40%), moderate heterogeneity (30% to 60%), substantial heterogeneity (50% to 90%), and considerable (very substantial) heterogeneity (75% to 100%) (Deeks 2011).
Assessment of reporting biases
Had we included more than 10 studies in the meta‐analysis, we would have assessed reporting bias by generating a funnel plot. This would have been evaluated through observing the symmetry of the distribution of intervention effects in the plot: the more symmetrical, the higher the chance of absence of reporting bias. In addition, in order to diminish the publication bias effect on asymmetry, we would have added pre‐established contour lines containing boundaries of statistical significance (Peters 2008). We would have been cautious in our interpretation of the funnel plots and considered different possible causes for funnel plot asymmetry before attributing any asymmetry to reporting bias.
Data synthesis
When considered appropriate, we pooled results of comparable groups of trials using the fixed‐effect model calculated via Review Manager 5 software (RevMan 2014). The choice of the model to report in the review was guided by careful consideration of the extent of any heterogeneity and whether it could be explained, in addition to other factors such as the number and size of the included studies. We would have considered using a random‐effects model, especially when there was unexplained heterogeneity. We used 95% CIs throughout. We also considered not pooling data where there was considerable heterogeneity (I2 greater than 75%) that could not be explained by the diversity of methodological or clinical features among the trials. Where we considered pooling data to be inappropriate, we have presented trial data in the analyses or tables for illustrative purposes and reported these in the text.
Subgroup analysis and investigation of heterogeneity
Insufficient data precluded our intended subgroup analyses to assess the effects of the following.
-
Concomitant meniscal injuries: isolated ACL injuries versus ACL injury with associated meniscal tears
-
Delay between ACL injury and reconstruction surgery (acute versus chronic lesions)
-
Different methods of making femoral tunnels: inside‐out versus outside‐in, inside‐out versus transportal, and outside‐in versus transportal
Should it be possible to conduct these subgroup analyses in updates of this review, we will investigate whether the results of subgroups are significantly different by inspecting the overlap of CIs and by performing the test for subgroup differences available in Review Manager 5 (Deeks 2011).
Sensitivity analysis
Had sufficient trials been available, we would have performed sensitivity analyses to examine various aspects of the trial and review methodology, including the effects of missing data, the selection of a statistical model (fixed‐effect versus random‐effects) for pooling, and the effects of excluding trials at high or unclear risk of bias, such as selection bias arising from lack of allocation concealment, trials with unit of analysis problems related to the inclusion of participants with bilateral ACL injuries, and trials with short‐term follow‐up after ACL reconstruction.
Assessing the quality of the evidence and 'Summary of findings' table
We used the GRADE approach to assess the quality of the body of evidence for each primary outcome and one of our secondary outcomes, thus subjective assessment of function (in the short, intermediate, and long term), quality of life (preferably intermediate term), adverse events including treatment failure, activity level (intermediate or long term), and objective functional knee assessment using the IKDC (intermediate term) (Schünemann 2011). We preferred intermediate‐ and long‐term outcomes because these would have been more representative of final outcome after the rehabilitation period. The quality rating 'high' is reserved for a body of evidence based on randomised controlled trials. We downgraded the quality rating to 'moderate', 'low', or 'very low' depending on the presence and extent of five factors: study limitations, inconsistency of effect, imprecision, indirectness, or publication bias. We presented the main results together with the quality assessments in a 'Summary of findings' table (Schünemann 2011).
Results
Description of studies
Results of the search
Appendix 1 shows the results from searches of CENTRAL, MEDLINE, Embase, LILACS, the WHO ICTRP, and ClinicalTrials.gov up to August 2017.
We screened a total of 1261 records from the following databases: Cochrane Bone, Joint and Muscle Trauma Group Specialised Register (25 records), CENTRAL (113), MEDLINE (181), Embase (254), LILACS (29), the WHO ICTRP (448 records), and ClinicalTrials.gov (211). We did not identify potentially eligible studies from other sources.
The search identified a total of 28 articles for potential inclusion, for which full reports were obtained. Upon study selection, we included five studies (six reports) (Brandsson 1999; Hess 2002; O'Neill 2001 (two reports); Reat 1997; Santori 1996), and excluded 18 studies (22 reports) (Aglietti 1995; Aglietti 2007; Barrett 1996; Benea 2014; Garfinkel 1994 (two reports); Gerich 1997 (three reports); Howell 1999; Hussein 2012; Iorio 2012; Jonsson 1994; Kim 2012; Kim 2013 (two reports); Lubowitz 2013; Merchant 2001; Monaco 2017; Panni 2001; Yanasse 2016; Zhang 2012). We found no ongoing studies and no further studies await classification.
A flow diagram summarising the study selection process is shown in Figure 1.
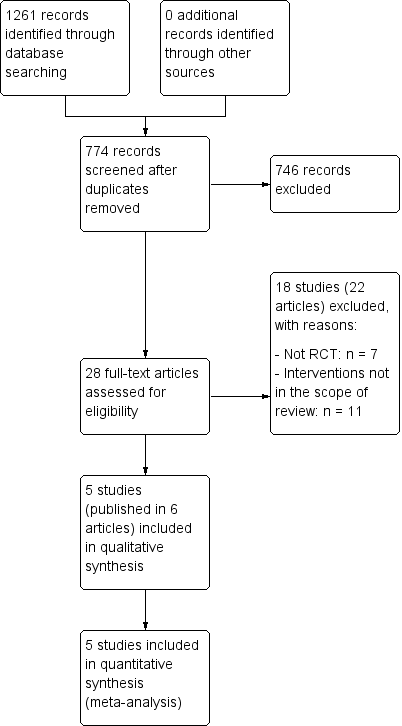
Study flow diagram.
Included studies
For further details, please see the Characteristics of included studies.
Design
All five studies were single‐centre studies. Of these, four were randomised controlled trials (Brandsson 1999; Hess 2002; Reat 1997; Santori 1996), and O'Neill 2001 was a quasi‐randomised controlled trial. O'Neill 2001 had three groups, of which two were relevant to this review. O'Neill 2001 was reported in two articles: O'Neill 1996 was an interim report of participants recruited between August 1989 and August 1992, and O'Neill 2001 was a follow‐up report that included additional participants recruited up to October 1994.
Sample sizes
The number of participants included in the studies was as follows: Brandsson 1999 (59 participants), Hess 2002 (20 participants), O'Neill 2001 (150 participants relevant to this review by the end of their study), Reat 1997 (30 participants), and Santori 1996 (61 participants).
Setting
The five studies were conducted in four countries: Germany (Hess 2002), Italy (Santori 1996), Sweden (Brandsson 1999), and the United States (O'Neill 2001; Reat 1997). All five studies were conducted in university hospital settings.
Participants
The five included studies evaluated a total of 320 participants. Most participants were young adults, with mean ages in study population ranging from 25.6 to 29.4 years. O'Neill 2001 recorded the youngest and oldest participants, at 14 and 56 years respectively. People with acute or chronic ACL injury were included, with 34 (40% of 85 participants in the interim report of O'Neill 2001) being operated on within three weeks of their injury in O'Neill 2001, and the longest recorded delay between injury and surgery of 364 months in Reat 1997. Hess 2002 limited the time from injury to surgery to a maximum of six months and also included only isolated ACL injuries (Hess 2002). Meniscal and chondral lesions were included as associated injuries in the other four trials. None of the participants had bilateral ACL involvement.
Interventions
Four of the five trials were comparisons between two groups, one of which had the two‐incision (outside‐in) technique and the other the one‐incision (transtibial) technique. Although O'Neill 2001 had three groups, we excluded one of the two‐incision groups because it differed from the other two groups in the use of a different graft (hamstrings tendon rather than patellar tendon and graft fixation with staples rather than interference screw). The type of tendon graft harvested was from patellar tendon in all trial participants included in the review. The type of graft fixation was interference screw in both femur and tibia in three trials (Brandsson 1999; Hess 2002; Santori 1996), and interference screw or sutures tied over a post screw in the other two trials (O'Neill 2001; Reat 1997). Two trials used immobilisation with a brace (Brandsson 1999; Reat 1997); two trials used no brace (Hess 2002; Santori 1996); and O'Neill 2001 did not report brace use. The rehabilitation programme was the same in both groups for each included study.
Outcomes
Timing of outcome assessment varied among the studies. Minimum final follow‐up times were two years in Brandsson 1999 and Santori 1996; one year in Hess 2002 and Reat 1997; and two years in the interim report and six years in the final report of O'Neill 2001.
Primary outcomes
Subjectively assessed knee function was reported using Lysholm scores in all trials except Reat 1997. None of the trials reported any quality of life measures.
Four trials reported adverse events such as knee stiffness, infection, recurrent lesions, recurrent instability, and graft failure (Brandsson 1999; O'Neill 2001; Reat 1997; Santori 1996). Hess 2002 only reported on complications during the "clinical course".
Secondary outcomes
Secondary outcomes available were objective measures of knee stability (Tegner activity level) (Brandsson 1999), return to previous activity level, O'Neill 2001, and level of activity (Reat 1997), IKDC knee examination (Brandsson 1999; Hess 2002; O'Neill 2001; Reat 1997; Santori 1996), objective function tests (one‐leg hop test) (Brandsson 1999; O'Neill 2001; Reat 1997), static stability measures (Pivot‐Shift, Lachman, mean side‐to‐side differences, measured by a KT‐1000 or KT‐2000) (Brandsson 1999; O'Neill 2001; Reat 1997; Santori 1996), pain (Brandsson 1999; Reat 1997), knee range of motion (Hess 2002; Reat 1997), muscle strength (Hess 2002; O'Neill 2001), and thigh circumference (Hess 2002).
All included studies used the original IKDC knee form, which provides an overall grade (A, B, C, or D) that incorporates the patient's subjective score (Hefti 1993). The newer version provides an overall group grade (A, B, C, or D) in addition to a patient‐based subjective score out of 100 (Irrgang 2001).
Excluded studies
We excluded 18 studies for the reasons provided in the Characteristics of excluded studies table. Seven studies were not randomised or quasi‐randomised controlled trials (Aglietti 1995; Aglietti 2007; Barrett 1996; Garfinkel 1994; Howell 1999; Merchant 2001; Panni 2001). The other 11 randomised controlled trials did not undertake the comparison covered in this review (Benea 2014; Gerich 1997; Hussein 2012; Iorio 2012; Jonsson 1994; Kim 2012; Kim 2013; Lubowitz 2013; Monaco 2017; Yanasse 2016; Zhang 2012). Of note is that Gerich 1997 was excluded because the two‐incision technique was performed through mini‐open arthrotomy rather than through arthroscopy; Iorio 2012 and Monaco 2017 were excluded because different fixation devices were used for femoral fixation of the graft; Jonsson 1994 was excluded because the femoral tunnel was performed using a different technique ("over the top"); and Yanasse 2016 was excluded because the femoral graft fixation for the transtibial group was performed through a lateral incision, similar to the two‐incision group.
Risk of bias in included studies
All five trials had methodological weaknesses that put them at unclear or high risk of bias in many 'Risk of bias' domains (see Figure 2). We previously considered separate reporting of patient‐rated and clinician‐rated outcomes of some 'Risk of bias' domains (blinding of participants and personnel, blinding of outcome assessment, and incomplete outcome data), but chose not to do this because of their high likelihood of being comparable (same results irrespective of subjective or objective outcomes). An overall summary of 'Risk of bias' domains can be found in Figure 3.

Risk of bias summary: review authors' judgements about each risk of bias item for each included study.

Risk of bias graph: review authors' judgements about each risk of bias item presented as percentages across all included studies.
Allocation
We judged selection bias of trials by considering the method of random sequence generation and whether there was allocation concealment.
We considered the quasi‐randomised controlled trial as at high risk of selection bias both in relation to lack of random sequence generation and allocation concealment (O'Neill 2001). We judged two trials that did not describe their method of randomisation as at unclear risk of bias for both domains (Hess 2002; Reat 1997). Although Brandsson 1999 described the use of closed envelopes, they did not describe the method of sequence generation (we judged this domain to be at unclear risk of bias) or safeguards to allocation concealment. Furthermore, it appears that participants in this trial could withdraw consent if they were unhappy with their allocation group, the participants being operated on in two consecutive series. We rated Brandsson 1999 as at high risk of selection bias relating to allocation concealment. Santori 1996's use of a coin toss put it at low risk of bias for sequence generation but at unclear risk of bias for allocation concealment, as safeguards were not described.
Blinding
All studies were at high risk of performance bias, since no trial described blinding of the participants, and blinding of the surgeon is understood to be impossible.
All trials were at unclear risk of detection bias since no mention was made of blinding of outcome assessors. We considered the reference to outcome data collection by independent observers in two trials as insufficient information to judge detection bias (Brandsson 1999; O'Neill 2001).
Incomplete outcome data
We considered two trials as at low risk of bias since they either reported no loss to follow‐up, Santori 1996, or minimal loss to follow‐up (O'Neill 2001). We considered two trials as at unclear risk of bias due to insufficient information on losses (Brandsson 1999; Hess 2002). Reat 1997 reported on losses, but these occurred only in one group at final follow‐up and were disproportionately large for a small trial.
Selective reporting
Initially we rated all trials at unclear risk of selective reporting bias because neither trial registration nor published study protocols were available. However, we than rated O'Neill 2001 at high of bias for this domain due to inclusion of participants in the follow‐up report who were not considered in the early report (O'Neill 2001). Contact with the author was unsuccessful, so it was not possible to obtain the reasons for this.
Other potential sources of bias
We rated all five studies as at unclear risk of other bias, generally reflecting insufficient information to assess whether there was bias from major differences in baseline characteristics, performance bias due to disparity in the experience of the surgeons performing the procedures, and the influence of funding sources as a potential cause of bias. Of note is the lack of information to determine whether there were differences in baseline characteristics in three trials (Brandsson 1999; Hess 2002; O'Neill 2001), with a major imbalance in the mean time between injury and surgery noted in Reat 1997. Although there did not appear to be major imbalances in baseline characteristics in Santori 1996, the imbalance between groups in the numbers randomised remains of some concern. All surgical procedures were performed by experienced surgeons except for Reat 1997, in which orthopaedic residents performed the surgeries under the supervision of a single experienced surgeon. However, confirmation of equivalent experience or familiarity in both techniques by the experienced surgeons was not confirmed in O'Neill 2001 or Santori 1996. We identified no other obvious sources were bias, including those relating to inappropriate influence of funding source, but no statement on funding was given in three trials (Brandsson 1999; Reat 1997; Santori 1996).
Effects of interventions
This review compared two techniques for ACL reconstruction: the two‐incision (outside‐in) technique and the one‐incision (inside‐out) technique. All five studies used bone‐patellar tendon bone grafts. When possible, we presented outcomes separately for the short term (less than six months after ACL reconstruction), intermediate term (six months to two years), and long term (greater than two years after ACL reconstruction). The outcomes in the included studies were for the most part available for the intermediate term. Based on available data, we made a distinction between long‐term follow‐ups of two to five years and six years and above.
The planned subgroup analyses for comparing concomitant meniscal injuries, acute versus chronic ACL injuries, and different methods of making femoral tunnels were not possible due to insufficient data.
Primary outcomes
Subjectively rated knee function
Of the four studies reporting Lysholm scores (scale from 0 to 100: best outcome), two provided mean and standard deviation results (Brandsson 1999; Hess 2002); one reported on participants with 'excellent' scores (90 or more) (O'Neill 2001); and one reported mean scores only (Santori 1996). Pooled data from two studies (79 participants) showed little difference between the two groups at three months (mean difference (MD) 2.73 favouring one‐incision technique, 95% confidence interval (CI) ‐2.70 to 8.15; 79 participants; very low‐quality evidence) or 12 months (MD ‐3.68 favouring two‐incision technique, 95% CI ‐6.61 to ‐0.75; very low‐quality evidence; Analysis 1.1). We found very low‐quality evidence of a similar lack of clinically important difference at 24 months or more in Brandsson 1999 (MD ‐1.00 favouring two‐incision technique, 95% CI ‐7.34 to 5.34; 59 participants; Analysis 1.1) and in Santori 1996 (means: one‐incision technique 96.81 versus two‐incision technique 94.65; 61 participants; difference reported as not statistically significant). Of note is that the results (MDs and 95% CIs) are all below the minimum detectable change (the minimum difference in an outcome score below which cannot be distinguished from random error in the measurement) of 8.9 for the Lysholm score (Briggs 2009). O'Neill 2001 found no difference between the two groups in the participants with excellent Lysholm scores (90 points or more) at two‐ to five‐year follow‐up: 42/45 versus 36/40; risk ratio (RR) 1.04, 95% CI 0.91 to 1.18; very low‐quality evidence; Analysis 1.2.
None of the studies reported functional assessments using the subjective part of the more recent International Knee Documentation Committee (IKDC) score (Irrgang 2001).
Quality of life measures
None of the included studies reported quality of life assessments such as the ACL Quality of Life outcome measure or more general measures such as the Medical Outcomes Study 36‐item short‐form health survey (SF‐36) (Mohtadi 1998).
Adverse effects and complications
With the exception of Hess 2002 (20 participants), which reported an absence of complications affecting the "clinical courses" in all cases at 12 months' follow‐up, the included trials did not report on overall numbers of participants incurring one or more complications in the two groups. The individual adverse effects reported by the trials are presented in Analysis 1.3; none indicated a significant difference between the two groups (very low‐quality evidence). We have not included data from Hess 2002 of they did not describe the specific adverse events that had not occurred.
Infection
Brandsson 1999 reported one case in each group of superficial infection, and Reat 1997 reported no cases of wound infection (1/44 versus 1/45; RR 1.03, 95% CI 0.07 to 15.77).
Nerve palsy
Brandsson 1999 reported one case of nerve palsy, which resolved by 12 months' follow‐up, in the two‐incision group (0/29 versus 1/30).
Haemarthrosis requiring treatment
Brandsson 1999 reported four cases of haemarthrosis (bleeding into the joint) that required arthrocentesis (joint aspiration) (1/29 versus 3/30).
Knee stiffness
Two trials reported on knee stiffness at two to five years, either in terms of loss of terminal extension (4/74 versus 2/70; RR 1.77, 95% 0.40 to 7.79) or loss of terminal flexion (3/74 versus 6/70; RR 0.50, 95% 0.14 to 1.72) (Brandsson 1999; O'Neill 2001).
Recurrent instability
Reat 1997 reported one case of recurrent instability (giving away) in the two‐incision group (1/15 versus 0/12).
Knee swelling
Reat 1997 reported 12 cases of knee swelling, occurring with sedentary, light, moderate, or strenuous activity (7/15 versus 5/12).
Reoperation
Three trials reported on reoperations occurring up to two to five years' follow‐up (Brandsson 1999; O'Neill 2001; Santori 1996). In two trials (Brandsson 1999; Santori 1996), reoperation was for meniscal or cartilage injury. Additional operations in O'Neill 2001 included one reconstruction, one lateral retinacular release, and four for removal of deep hardware. Pooled results showed little difference between the two groups (8/98 versus 9/107; RR 0.89, 95% CI 0.37 to 2.14; 205 participants; 3 studies; Analysis 1.3).
Graft failure
O'Neill 2001 reported nine cases of graft failure at 6 to 11 years' follow‐up (5/75 versus 4/75).
Secondary outcomes
Activity levels
The only study reporting on Tegner activity level scores (assessment based on the highest activity in which the patient can participate: scale 0 to 10: highest sport activity) found neither group returned to their pre‐injury levels by 24 months (one‐incision technique mean 7.0; two‐incision technique mean 6.8), with no clear difference between the two groups (MD ‐0.80 favours two‐incision technique, 95% CI ‐1.90 to 0.30; 59 participants; very low‐quality evidence; Analysis 1.4) (Brandsson 1999). Similar numbers of participants were engaged in strenuous or moderate activity at final follow‐up (between 5 and 28 months) in Reat 1997: 11/15 (one‐incision technique) versus 9/12 (two‐incision technique) (RR 0.98, 95% CI 0.63 to 1.53; data not shown, very low‐quality evidence).
O'Neill 2001 found little difference between the two groups at two to five years' follow‐up in reported return to previous activity (40/45 versus 38/40; RR 0.94, 95% CI 0.83 to 1.06; very low‐quality evidence; Analysis 1.5). Reat 1997 provided incomplete data on return to previous activity by focusing only on those participants (11 versus 13) who had engaged in "strenuous" activity prior to their injury: at 5 to 28 months' follow‐up, 4 of 11 participants in the one‐incision group and 5 of 13 in the two‐incision group were participating in strenuous activity (very low‐quality evidence).
IKDC knee examination (objective part)
All five trials presented results from the IKDC knee examination (primarily objective assessment of aspects such as symptoms, range of motion, and ligament examination) categorised into four groups: A (normal), B (nearly normal), C (abnormal), and D (severely abnormal) (Hefti 1993).
Pooled data for participants with normal or nearly normal scores at three time intervals are presented in Analysis 1.6. However, the data from two studies (43 participants) for three to six months' follow‐up were significantly heterogeneous (P = 0.02, I2 = 81%; very low‐quality evidence) and should be regarded as inconclusive. There was minimal between‐group difference at either 12 to 28 months' average follow‐up (56/78 versus 63/89; RR 1.01, 95% CI 0.85 to 1.21; 167 participants; 4 studies; I2 = 0%; very low‐quality evidence) or at 6 to 11 years (70/75 versus 71/75; RR 0.99, 95% CI 0.91 to 1.07; 150 participants; 1 study; very low‐quality evidence).
Objective function tests (one‐leg hop test)
Three trials reported this outcome in terms of the percentage of the test results relative to the contralateral (non‐operated) leg (Brandsson 1999; O'Neill 2001; Reat 1997). None of the trials found evidence of a difference between the two groups. Both groups in Brandsson 1999 (59 participants) had a mean of 95% result compared with non‐operated legs at 24 months (MD 0.00, 95% CI ‐3.73 to 3.73; very low‐quality evidence; Analysis 1.7). Reat 1997 reported no significant difference between the two groups at around 15 months' follow‐up (one‐incision group mean 89%; two‐incision group mean 92%). O'Neill 2001, reporting on one‐leg hop test results at two to five years, found minimal difference between the two groups in the number of participants with one‐leg hop test greater than 90% of contralateral leg (40/45 versus 37/40; RR 0.96, 95% CI 0.84 to 1.10; very low‐quality evidence; Analysis 1.8).
Static stability measures
Knee stability measured by arthrometer
Brandsson 1999 (59 participants) found small between‐group differences at three months in favour of the two‐incision group in the mean side‐to‐side differences in anterior translation measured by a KT‐1000 arthrometer at 89 N (MD 0.90 mm, 95% CI 0.13 to 1.67) and at 135 N (MD 1.10 mm, 95% CI 0.35 to 1.85). However, the clinical importance of these differences is marginal, and there were no between‐group differences at 24 months at either setting (MD 0.30, 95% CI ‐0.59 to 1.19; MD 0.20, 95% CI ‐0.65 to 1.05; very low‐quality evidence; Analysis 1.9). Pooled data for side‐to‐side differences of less than 3 mm showed no evidence of a difference between the two groups, either when measured by a KT‐1000 arthrometer at 12 to 24 months (34/44 versus 35/42; RR 0.95, 95% CI 0.78 to 1.15; 2 studies) or when measured by a KT‐2000 arthrometer at two to five years (72/99 versus 81/112; RR 0.97, 95% CI 0.83 to 1.14; 2 studies). Overall pooled results also did not show a difference between the two groups (106/143 versus 116/154; RR 0.96, 95% CI 0.85 to 1.09; 297 participants; 4 studies; very low‐quality evidence; Analysis 1.10).
Hess 2002 (20 participants) also reported no differences in the mean side‐to‐side differences (mm), measured by a KT‐1000 arthrometer at manual maximal force with 30 degrees of flexion between the two groups at three months (one‐incision group mean 0.18 mm versus two‐incision group mean 0.79 mm) and at 12 months (one‐incision group mean 1.18 mm versus two‐incision group mean 1.03 mm).
Other measures of stability: Pivot‐Shift Test and Lachman test
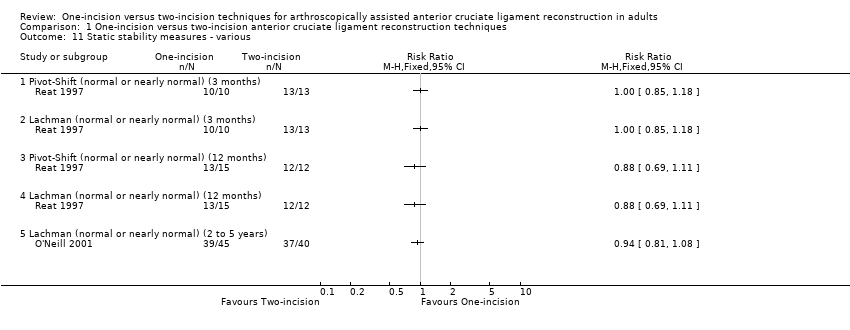
At three months, Reat 1997 found all 23 cases with data at three months had normal or nearly normal Pivot‐Shift Test and Lachman test results (very low‐quality evidence; Analysis 1.11); 25 of 27 cases with data at 12 months also had normal or nearly normal Pivot‐Shift Test and Lachman test results (13/15 versus 12/12; RR 0.88, 95% CI 0.69 to 1.11; very low‐quality evidence; Analysis 1.11). At two to five years, O'Neill 2001 found little difference between the two groups in cases with normal or nearly normal results (39/45 versus 37/40; RR 0.94, 95% CI 0.81 to 1.08; very low‐quality evidence; Analysis 1.11). Anterior Drawer Tests were not reported.
Pain
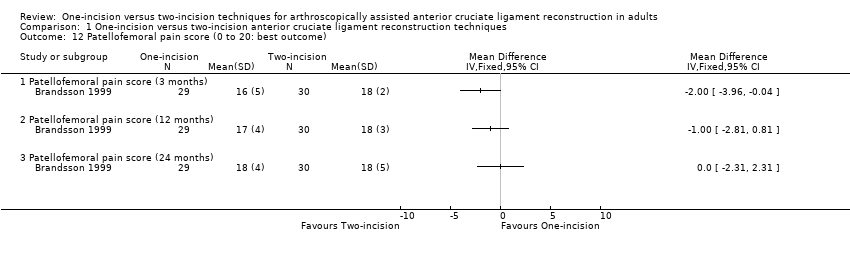
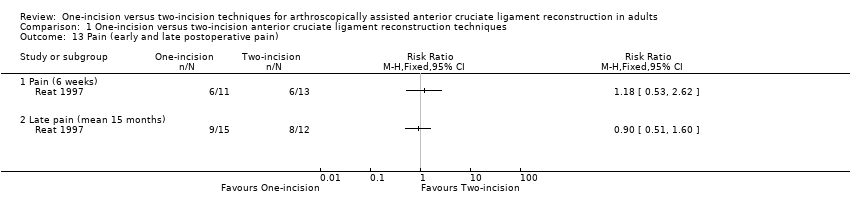
Brandsson 1999 (59 participants) found lower (worse) patellofemoral pain scores (0 to 20: best outcome) in the one‐incision group at 3 months (MD ‐2.00, 95% CI ‐3.96 to ‐0.04) and 12 months (MD ‐1.00, 95% CI ‐2.81 to 0.81) but no between‐group differences at 24 months (MD 0.00, 95% CI ‐2.31 to 2.31); very low‐quality evidence; Analysis 1.12. The actual scale used was not reported, and the clinical significance of any difference is not known. Reat 1997 reported early pain at one, three, and six weeks categorised into four groups: none, mild, moderate, and severe pain. At six weeks, six participants in each group had mild or worse pain (6/11 versus 6/13; RR 1.18, 95% CI 0.53 to 2.62; very low‐quality evidence; Analysis 1.13). There was also no between‐group difference in those reporting pain at 15 months' follow‐up (9/15 versus 8/12; RR 0.90, 95% CI 0.51 to 1.60; very low‐quality evidence; Analysis 1.13).
Knee range of motion
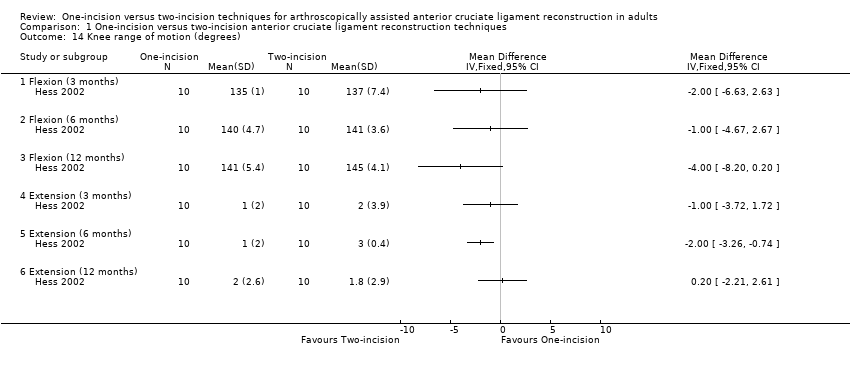
Hess 2002 reported on mean range of motion in both flexion and (hyper)extension at 3, 6, and 12 months. Although tending to favour the two‐incision group, the small differences (1 to 4 degrees for flexion; 0.2 to 2.0 degrees for extension) between the two groups at all follow‐up times were not clinically important, and normal levels were reached at 12 months' postsurgery; very low quality evidence; Analysis 1.14. Reat 1997 reported no difference between the two groups at one, three, and six weeks and last follow‐up (mean 16 months) in the mean extension, flexion, and overall range of motion; very low‐quality evidence; Analysis 1.15.
Muscle strength (Cybex isokinetic muscle strength testing)
Hess 2002 (20 participants) evaluated peak torque forces measured by Cybex isokinetic muscle strength at 3, 6, and 12 months, reporting the results as a percentage of the contralateral side for extensor muscles and flexor muscles at 60°/s and 180°/s under eccentric and concentric isokinetic movement. Hess 2002 reported a "continuous increase of peak torque ratio" over time with a faster improvement in the one‐incision group; between‐group differences in the eight measures ranged from 13.5% to 27.7% at three months and 0.7% to 37.5% at six months (Analysis 1.16). The results at 12 months (standard deviations were estimated from graphs) continued to favour the one‐incision group, although the between‐group differences were smaller with all 95% CI crossing the line of no effect; very low‐quality evidence; Analysis 1.17.
O'Neill 2001 (150 participants) reported on deficits of 10% or more in isokinetic muscle strength at 6 and 11 years' follow‐up. There were fewer cases in the one‐incision group of quadriceps deficit (20/75 versus 31/75; RR 0.65, 95% CI 0.41 to 1.02; very low‐quality evidence) and hamstrings muscle deficit (5/75 versus 10/75; RR 0.50, 95% CI 0.18 to 1.39; very low‐quality evidence) (Analysis 1.18).
Thigh circumference
Hess 2002 (20 participants) provided very low‐quality evidence of no between‐group difference in the mean thigh circumference (cm), 10 cm above the joint line, at 12 months (one‐incision group mean 43 cm versus two‐incision group mean 44 cm).
Femoral tunnel position ‐ anatomic or isometric
None of the included studies reported on this outcome.
Discussion
Summary of main results
This review included four randomised controlled trials and one quasi‐randomised controlled trial comparing one‐incision versus two‐incision ACL reconstruction techniques. The studies randomised a total of 320 participants, most of whom were in their 20s. Participants in all five trials underwent ACL reconstruction with patellar tendon grafts.
The main results of the comparison of one‐incision versus two‐incision ACL reconstruction are presented in summary of findings Table for the main comparison. These show a consistent picture, albeit supported by very low‐quality evidence, of no clinically important differences between the two techniques in self reported knee function, measured using the Lysholm knee score, in short‐term (3 months), intermediate‐term (12 months), and long‐term (2 to 5 years) follow‐up. There were no data for quality of life measures or for participants incurring an adverse event. We found very low‐quality evidence of little between‐group differences in individual adverse events such as those in the postoperative period (e.g. infection), those reported at final follow‐up (e.g. knee stiffness), and by final follow‐up (e.g. reoperation and graft failure). There was very low‐quality evidence from one study of little difference between the two groups in activity levels measured using Tegner scores at two years. We found very low‐quality evidence from four studies of minimal between‐group difference in the number of participants with normal or nearly normal objectively measured knee function at intermediate‐term follow‐up.
It should be noted that the quality of the evidence was also very low for all other secondary outcomes for which data are presented in Effects of interventions.
Overall completeness and applicability of evidence
All five methodologically flawed studies were small, with data available for a maximum of 205 participants (3 studies) for reoperation and 297 participants for objectively measured knee stability. Pooled data for subjective function were only available from two trials (79 participants), with no data for quality of life measures or overall numbers with adverse events. The available data to inform on this comparison are thus very limited and incomplete.
The trial participants are generally representative of those who receive ACL reconstruction, but it should be noted that all grafts used in the trials were patellar tendons. The results may thus not be applicable to reconstruction with other grafts, notably hamstring tendon (Mohtadi 2011). In addition to deficiencies in outcome measurement, such as for subjective outcome and activity level, the large variation in the length of follow‐up data in studies such as Reat 1997 and O'Neill 2001 also hinders interpretation and applicability of trial findings.
Quality of the evidence
All five trials had methodological weaknesses that put them at unclear or high risk of bias in many 'Risk of bias' domains (see Figure 2 and Figure 3). This applied particularly to the largest trial (O'Neill 2001), which was quasi‐randomised. In our assessment of the quality of evidence based on the GRADE approach (Schünemann 2011), we thus downgraded two levels for very serious risk of bias (summary of findings Table for the main comparison). We further downgraded the evidence one level for imprecision, reflecting the small sample size. We did not downgrade for inconsistency, indirectness, or potential publication bias. We thus rated the quality of the evidence as very low for all outcomes for which data were available, meaning we have we have very little confidence in the effect estimates.
Potential biases in the review process
We used the standard methods described in the Cochrane Handbook for Systematic Reviews of Interventions (Higgins 2011). We cross‐checked data extracted from study reports, resolving any disagreements by discussion. We attempted to contact trial authors for missing data and unpublished trials. We have reported any changes to our protocol in Differences between protocol and review. An important change was in our definition of the key outcomes for inclusion in the 'Summary of findings' table, in particular our post hoc inclusion of normal or nearly normal IKDC objective knee assessment at intermediate‐term follow‐up.
Although our literature search was comprehensive, it is possible that we did not identify all trials, especially unpublished trials presented in conference abstracts only.
The evidence was dominated (150 participants) by the results of O'Neill 2001, a quasi‐randomised controlled trial that was reported in two papers (O'Neill 1996; O'Neill 2001), with the inclusion of a further 65 participants (in this review) at follow‐up of 6 to 11 years whose results were not included in the early report at 2‐ to 5‐year follow‐up. We took care in our processing and interpretation of the data from this unsatisfactory trial in order to avoid both double‐counting and losing data. Overall the data were insufficient to perform sensitivity analyses to explore in a meaningful way the inclusion of O'Neill 2001, the only explicit quasi‐randomised controlled trial, or other decisions made in the review process.
Agreements and disagreements with other studies or reviews
We identified one other systematic review of randomised controlled trials comparing one‐incision with two‐incision ACL arthroscopic reconstruction (George 2007). George 2007 included four trials, one of which we excluded from our review because a non‐arthroscopic technique (mini‐open arthrotomy) was used (Gerich 1997). Two trials were not identified (Hess 2002; Santori 1996), and the follow‐up report of O’Neill was not considered (O'Neill 2001). George 2007 did not assess the methodological quality of the included studies and gave emphasis to outcomes, such as operative time, with significant statistical differences between the two techniques, which we did not consider in our review. In terms of outcomes considered in both reviews, such as function and activity scores (e.g. Lysholm and Tegner), George 2007 reported similar findings of a lack of significant differences between one‐incision and two‐incision ACL reconstruction techniques.
Risk of bias summary: review authors' judgements about each risk of bias item for each included study.
Risk of bias graph: review authors' judgements about each risk of bias item presented as percentages across all included studies.
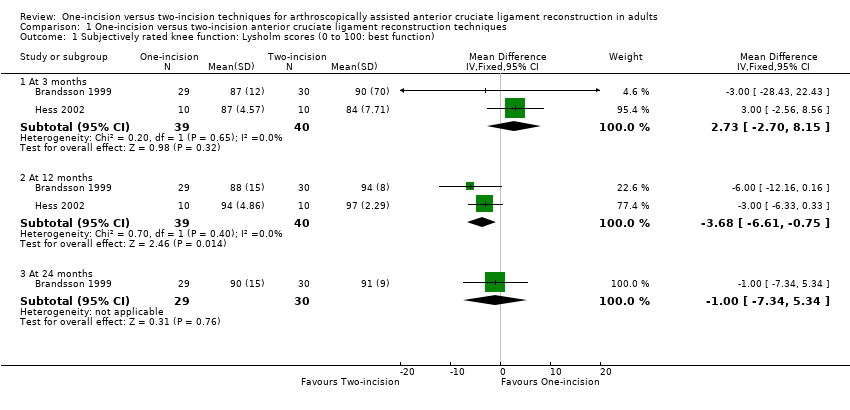
Comparison 1 One‐incision versus two‐incision anterior cruciate ligament reconstruction techniques, Outcome 1 Subjectively rated knee function: Lysholm scores (0 to 100: best function).
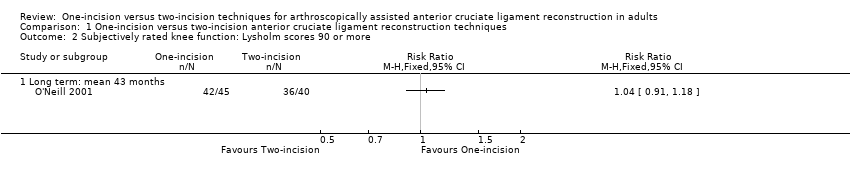
Comparison 1 One‐incision versus two‐incision anterior cruciate ligament reconstruction techniques, Outcome 2 Subjectively rated knee function: Lysholm scores 90 or more.

Comparison 1 One‐incision versus two‐incision anterior cruciate ligament reconstruction techniques, Outcome 3 Adverse events.

Comparison 1 One‐incision versus two‐incision anterior cruciate ligament reconstruction techniques, Outcome 4 Tegner activity score (0 to 10: top activity) at 24 months.

Comparison 1 One‐incision versus two‐incision anterior cruciate ligament reconstruction techniques, Outcome 5 Return to previous activity level (2 to 5 years).

Comparison 1 One‐incision versus two‐incision anterior cruciate ligament reconstruction techniques, Outcome 6 IKDC objective assessment: normal or nearly normal.

Comparison 1 One‐incision versus two‐incision anterior cruciate ligament reconstruction techniques, Outcome 7 Objective function tests: one‐leg hop quotient (% of other leg) (24 months).
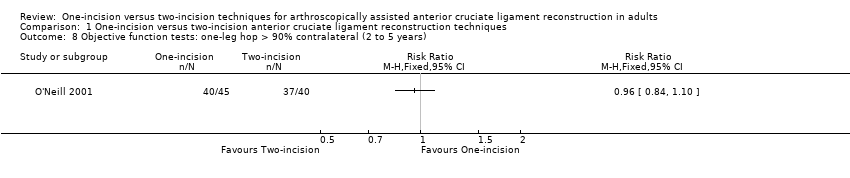
Comparison 1 One‐incision versus two‐incision anterior cruciate ligament reconstruction techniques, Outcome 8 Objective function tests: one‐leg hop > 90% contralateral (2 to 5 years).

Comparison 1 One‐incision versus two‐incision anterior cruciate ligament reconstruction techniques, Outcome 9 Static stability measures ‐ anterior translation, difference between sides (injured ‐ healthy knee).

Comparison 1 One‐incision versus two‐incision anterior cruciate ligament reconstruction techniques, Outcome 10 Static stability measures ‐ anterior translation side‐to‐side difference < 3 mm.
Comparison 1 One‐incision versus two‐incision anterior cruciate ligament reconstruction techniques, Outcome 11 Static stability measures ‐ various.
Comparison 1 One‐incision versus two‐incision anterior cruciate ligament reconstruction techniques, Outcome 12 Patellofemoral pain score (0 to 20: best outcome).
Comparison 1 One‐incision versus two‐incision anterior cruciate ligament reconstruction techniques, Outcome 13 Pain (early and late postoperative pain).
Comparison 1 One‐incision versus two‐incision anterior cruciate ligament reconstruction techniques, Outcome 14 Knee range of motion (degrees).
| Study | Variable (degrees) | One‐incision n = 15 | Two‐incision n = 12 | Mean difference |
| Reat 1997 | Extension | ‐4° | ‐2° | ‐2° |
| Reat 1997 | Flexion | 135° | 134° | 1° |
| Reat 1997 | Range of motion | 139° | 136° | 3° |
Comparison 1 One‐incision versus two‐incision anterior cruciate ligament reconstruction techniques, Outcome 15 Range of motion at mean 15 months follow‐up (range 5 to 28 months).
| Study | Muscle and conditions | One‐incision n = 10 | Two‐incision n = 10 | MD | Reported P |
| 3 months | |||||
| Hess 2002 | Extensor, 60 deg/sec, concentric | 65.8 | 52.3 | 13.5 | 0.05 |
| Hess 2002 | Extensor, 180 deg/sec, concentric | 80.3 | 57.7 | 22.6 | 0.01 |
| Hess 2002 | Extensor, 60 deg/sec, eccentric | 67.1 | 51 | 16.1 | > 0.05 |
| Hess 2002 | Extensor, 180 deg/sec, eccentric | 68.8 | 51.7 | 17.1 | > 0.05 |
| Hess 2002 | Flexor, 60 deg/sec, concentric | 110.4 | 82.7 | 27.7 | 0.02 |
| Hess 2002 | Flexor, 180 deg/sec, concentric | 118.3 | 91.5 | 26.8 | > 0.05 |
| Hess 2002 | Flexor, 60 deg/sec, eccentric | 82.3 | 67.7 | 14.6 | > 0.05 |
| Hess 2002 | Flexor, 180 deg/sec, eccentric | 92.2 | 75.7 | 16.5 | > 0.05 |
| 6 months | |||||
| Hess 2002 | Extensor, 60 deg/sec, concentric | 79.3 | 61.1 | 18.2 | 0.03 |
| Hess 2002 | Extensor, 180 deg/sec, concentric | 82.2 | 78.3 | 3.9 | > 0.05 |
| Hess 2002 | Extensor, 60 deg/sec, eccentric | 92.5 | 55 | 37.5 | 0.02 |
| Hess 2002 | Extensor, 180 deg/sec, eccentric | 77.9 | 65 | 12.9 | 0.05 |
| Hess 2002 | Flexor, 60 deg/sec, concentric | 108.1 | 91.5 | 16.6 | 0.03 |
| Hess 2002 | Flexor, 180 deg/sec, concentric | 100.6 | 99.9 | 0.7 | > 0.05 |
| Hess 2002 | Flexor, 60 deg/sec, eccentric | 94.5 | 79.8 | 14.7 | > 0.05 |
| Hess 2002 | Flexor, 180 deg/sec, eccentric | 107.8 | 87.9 | 19.9 | > 0.05 |
Comparison 1 One‐incision versus two‐incision anterior cruciate ligament reconstruction techniques, Outcome 16 Peak torque forces (% contralateral side) at 3 and 6 months.

Comparison 1 One‐incision versus two‐incision anterior cruciate ligament reconstruction techniques, Outcome 17 Muscle strength (peak torque forces) at 12 months.
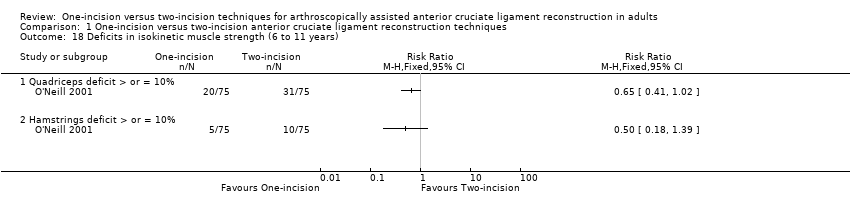
Comparison 1 One‐incision versus two‐incision anterior cruciate ligament reconstruction techniques, Outcome 18 Deficits in isokinetic muscle strength (6 to 11 years).
| One‐incision compared to two‐incision techniques for arthroscopically assisted anterior cruciate ligament (ACL) reconstruction in adults | ||||||
| Patient or population: adults undergoing arthroscopically assisted ACL reconstruction1 Intervention: one‐incision technique | ||||||
| Outcomes | Illustrative comparative risks* (95% CI) | Relative effect | No. of participants | Quality of the evidence | Comments | |
| Assumed risk | Corresponding risk | |||||
| Two‐incision technique (control) | One‐incision technique (intervention) | |||||
| Subjective function (short term)2: Lysholm knee score (0 to 100: higher scores = better function) | The mean Lysholm score in the two‐incision groups ranged from 84 to 90. | The mean Lysholm score in the one‐incision groups was 2.73 higher (2.70 lower to 8.15 higher). | ‐ | 79 | ⊕⊝⊝⊝ | The 95% CI are unlikely to include a clinically important difference.4 |
| Subjective function (intermediate term)2: Lysholm knee score (0 to 100: higher scores = better function) | The mean Lysholm score in the two‐incision groups ranged from 94 to 97. | The mean Lysholm score in the one‐incision groups was 3.68 lower (0.75 to 6.61 lower). | ‐ | 79 | ⊕⊝⊝⊝ | The 95% CI are unlikely to include a clinically important difference.4 A similar lack of differences was found in 2 studies at 24 months (very low‐quality evidence).5 |
| Subjective function (long term)2: Lysholm knee score (0 to 100: higher scores = better function) Follow‐up: mean 43 months; range 2 to 5 years | 900 per 10006 | 936 per 1000 | RR 1.04 | 85 | ⊕⊝⊝⊝ | ‐ |
| Quality of life(intermediate term)2 | See comment | See comment | ‐ | ‐ | See comment | No quality of life measures were reported. |
| Adverse events (overall) | See comment | See comment | ‐ | ‐ | See comment | 4 studies reported on specific complications but not overall numbers. There was very low‐quality evidence of little between‐group differences.8 |
| Activity level (intermediate term) Tegner activity score (0 to 10: highest sport activity) | The mean Tegner activity score in the two‐incision group was 5.7. | The mean Tegner activity score in the one‐incision group was 0.8 lower (1.9 lower to 0.3 higher) | ‐ | 59 | ⊕⊝⊝⊝ | ‐ |
| Objective functional knee assessments using IKDC10 (intermediate term)(normal or nearly normal assessment) | 698 per 100011 | 705 per 1000 | RR 1.01 (0.85 to 1.21) | 167 | ⊕⊝⊝⊝ | ‐ |
| *The risk in the intervention group (and its 95% confidence interval) is based on the assumed risk in the comparison group and the relative effect of the intervention (and its 95% CI). | ||||||
| GRADE Working Group grades of evidence | ||||||
| 1All grafts used in the five included trials were patellar tendons. The participants were mainly in their 20s. | ||||||
| Outcome or subgroup title | No. of studies | No. of participants | Statistical method | Effect size |
| 1 Subjectively rated knee function: Lysholm scores (0 to 100: best function) Show forest plot | 2 | Mean Difference (IV, Fixed, 95% CI) | Subtotals only | |
| 1.1 At 3 months | 2 | 79 | Mean Difference (IV, Fixed, 95% CI) | 2.73 [‐2.70, 8.15] |
| 1.2 At 12 months | 2 | 79 | Mean Difference (IV, Fixed, 95% CI) | ‐3.68 [‐6.61, ‐0.75] |
| 1.3 At 24 months | 1 | 59 | Mean Difference (IV, Fixed, 95% CI) | ‐1.0 [‐7.34, 5.34] |
| 2 Subjectively rated knee function: Lysholm scores 90 or more Show forest plot | 1 | Risk Ratio (M‐H, Fixed, 95% CI) | Totals not selected | |
| 2.1 Long term: mean 43 months | 1 | Risk Ratio (M‐H, Fixed, 95% CI) | 0.0 [0.0, 0.0] | |
| 3 Adverse events Show forest plot | 4 | Risk Ratio (M‐H, Fixed, 95% CI) | Subtotals only | |
| 3.1 Infection | 2 | 89 | Risk Ratio (M‐H, Fixed, 95% CI) | 1.03 [0.07, 15.77] |
| 3.2 Nerve palsy | 1 | 59 | Risk Ratio (M‐H, Fixed, 95% CI) | 0.34 [0.01, 8.13] |
| 3.3 Haemarthrosis requiring joint aspiration | 1 | 59 | Risk Ratio (M‐H, Fixed, 95% CI) | 0.34 [0.04, 3.13] |
| 3.4 Deep vein thrombosis | 1 | 30 | Risk Ratio (M‐H, Fixed, 95% CI) | 3.0 [0.13, 68.26] |
| 3.5 Knee stiffness (loss of terminal extension) (2 to 5 years) | 2 | 144 | Risk Ratio (M‐H, Fixed, 95% CI) | 1.77 [0.40, 7.79] |
| 3.6 Knee stiffness (loss of terminal flexion) (2 to 5 years) | 2 | 144 | Risk Ratio (M‐H, Fixed, 95% CI) | 0.50 [0.14, 1.72] |
| 3.7 Recurrent instability (giving way) | 1 | 27 | Risk Ratio (M‐H, Fixed, 95% CI) | 2.44 [0.11, 54.97] |
| 3.8 Knee swelling at final follow‐up | 1 | 27 | Risk Ratio (M‐H, Fixed, 95% CI) | 1.12 [0.47, 2.65] |
| 3.9 Reoperations | 3 | 205 | Risk Ratio (M‐H, Fixed, 95% CI) | 0.89 [0.37, 2.14] |
| 3.10 Graft failure (6 to 11 years) | 1 | 150 | Risk Ratio (M‐H, Fixed, 95% CI) | 1.25 [0.35, 4.47] |
| 4 Tegner activity score (0 to 10: top activity) at 24 months Show forest plot | 1 | Mean Difference (IV, Fixed, 95% CI) | Totals not selected | |
| 5 Return to previous activity level (2 to 5 years) Show forest plot | 1 | Risk Ratio (M‐H, Fixed, 95% CI) | Totals not selected | |
| 6 IKDC objective assessment: normal or nearly normal Show forest plot | 5 | Risk Ratio (M‐H, Fixed, 95% CI) | Subtotals only | |
| 6.1 At 3 to 6 months | 2 | 43 | Risk Ratio (M‐H, Fixed, 95% CI) | 0.59 [0.33, 1.03] |
| 6.2 At 12 to 28 months | 4 | 167 | Risk Ratio (M‐H, Fixed, 95% CI) | 1.01 [0.85, 1.21] |
| 6.3 At 6 to 11 years | 1 | 150 | Risk Ratio (M‐H, Fixed, 95% CI) | 0.99 [0.91, 1.07] |
| 7 Objective function tests: one‐leg hop quotient (% of other leg) (24 months) Show forest plot | 1 | Mean Difference (IV, Fixed, 95% CI) | Totals not selected | |
| 8 Objective function tests: one‐leg hop > 90% contralateral (2 to 5 years) Show forest plot | 1 | Risk Ratio (M‐H, Fixed, 95% CI) | Totals not selected | |
| 9 Static stability measures ‐ anterior translation, difference between sides (injured ‐ healthy knee) Show forest plot | 1 | Mean Difference (IV, Fixed, 95% CI) | Totals not selected | |
| 9.1 Difference (mm) measured by KT‐1000 arthrometer at 89 N (3 months) | 1 | Mean Difference (IV, Fixed, 95% CI) | 0.0 [0.0, 0.0] | |
| 9.2 Difference (mm) measured by KT‐1000 arthrometer at 135 N (3 months) | 1 | Mean Difference (IV, Fixed, 95% CI) | 0.0 [0.0, 0.0] | |
| 9.3 Difference (mm) measured by KT‐1000 arthrometer at 89 N (24 months) | 1 | Mean Difference (IV, Fixed, 95% CI) | 0.0 [0.0, 0.0] | |
| 9.4 Difference (mm) measured by KT‐1000 arthrometer at 135 N (12 months) | 1 | Mean Difference (IV, Fixed, 95% CI) | 0.0 [0.0, 0.0] | |
| 10 Static stability measures ‐ anterior translation side‐to‐side difference < 3 mm Show forest plot | 4 | 297 | Risk Ratio (M‐H, Fixed, 95% CI) | 0.96 [0.85, 1.09] |
| 10.1 Measured by KT‐1000 arthrometer (12 to 24 months) | 2 | 86 | Risk Ratio (M‐H, Fixed, 95% CI) | 0.95 [0.78, 1.15] |
| 10.2 Measured by KT‐2000 arthrometer (2 to 5 years) | 2 | 211 | Risk Ratio (M‐H, Fixed, 95% CI) | 0.97 [0.83, 1.14] |
| 11 Static stability measures ‐ various Show forest plot | 2 | Risk Ratio (M‐H, Fixed, 95% CI) | Totals not selected | |
| 11.1 Pivot‐Shift (normal or nearly normal) (3 months) | 1 | Risk Ratio (M‐H, Fixed, 95% CI) | 0.0 [0.0, 0.0] | |
| 11.2 Lachman (normal or nearly normal) (3 months) | 1 | Risk Ratio (M‐H, Fixed, 95% CI) | 0.0 [0.0, 0.0] | |
| 11.3 Pivot‐Shift (normal or nearly normal) (12 months) | 1 | Risk Ratio (M‐H, Fixed, 95% CI) | 0.0 [0.0, 0.0] | |
| 11.4 Lachman (normal or nearly normal) (12 months) | 1 | Risk Ratio (M‐H, Fixed, 95% CI) | 0.0 [0.0, 0.0] | |
| 11.5 Lachman (normal or nearly normal) (2 to 5 years) | 1 | Risk Ratio (M‐H, Fixed, 95% CI) | 0.0 [0.0, 0.0] | |
| 12 Patellofemoral pain score (0 to 20: best outcome) Show forest plot | 1 | Mean Difference (IV, Fixed, 95% CI) | Totals not selected | |
| 12.1 Patellofemoral pain score (3 months) | 1 | Mean Difference (IV, Fixed, 95% CI) | 0.0 [0.0, 0.0] | |
| 12.2 Patellofemoral pain score (12 months) | 1 | Mean Difference (IV, Fixed, 95% CI) | 0.0 [0.0, 0.0] | |
| 12.3 Patellofemoral pain score (24 months) | 1 | Mean Difference (IV, Fixed, 95% CI) | 0.0 [0.0, 0.0] | |
| 13 Pain (early and late postoperative pain) Show forest plot | 1 | Risk Ratio (M‐H, Fixed, 95% CI) | Totals not selected | |
| 13.1 Pain (6 weeks) | 1 | Risk Ratio (M‐H, Fixed, 95% CI) | 0.0 [0.0, 0.0] | |
| 13.2 Late pain (mean 15 months) | 1 | Risk Ratio (M‐H, Fixed, 95% CI) | 0.0 [0.0, 0.0] | |
| 14 Knee range of motion (degrees) Show forest plot | 1 | Mean Difference (IV, Fixed, 95% CI) | Totals not selected | |
| 14.1 Flexion (3 months) | 1 | Mean Difference (IV, Fixed, 95% CI) | 0.0 [0.0, 0.0] | |
| 14.2 Flexion (6 months) | 1 | Mean Difference (IV, Fixed, 95% CI) | 0.0 [0.0, 0.0] | |
| 14.3 Flexion (12 months) | 1 | Mean Difference (IV, Fixed, 95% CI) | 0.0 [0.0, 0.0] | |
| 14.4 Extension (3 months) | 1 | Mean Difference (IV, Fixed, 95% CI) | 0.0 [0.0, 0.0] | |
| 14.5 Extension (6 months) | 1 | Mean Difference (IV, Fixed, 95% CI) | 0.0 [0.0, 0.0] | |
| 14.6 Extension (12 months) | 1 | Mean Difference (IV, Fixed, 95% CI) | 0.0 [0.0, 0.0] | |
| 15 Range of motion at mean 15 months follow‐up (range 5 to 28 months) Show forest plot | Other data | No numeric data | ||
| 16 Peak torque forces (% contralateral side) at 3 and 6 months Show forest plot | Other data | No numeric data | ||
| 16.1 3 months | Other data | No numeric data | ||
| 16.2 6 months | Other data | No numeric data | ||
| 17 Muscle strength (peak torque forces) at 12 months Show forest plot | 1 | Mean Difference (IV, Fixed, 95% CI) | Totals not selected | |
| 17.1 Extensors (60º) under concentric isokinetic movement | 1 | Mean Difference (IV, Fixed, 95% CI) | 0.0 [0.0, 0.0] | |
| 17.2 Extensors (180º) under concentric isokinetic movement | 1 | Mean Difference (IV, Fixed, 95% CI) | 0.0 [0.0, 0.0] | |
| 17.3 Extensors (60º) under eccentric isokinetic movement | 1 | Mean Difference (IV, Fixed, 95% CI) | 0.0 [0.0, 0.0] | |
| 17.4 Extensors (180º) under eccentric isokinetic movement | 1 | Mean Difference (IV, Fixed, 95% CI) | 0.0 [0.0, 0.0] | |
| 17.5 Flexors (60º) under concentric isokinetic movement | 1 | Mean Difference (IV, Fixed, 95% CI) | 0.0 [0.0, 0.0] | |
| 17.6 Flexors (180º) under concentric isokinetic movement | 1 | Mean Difference (IV, Fixed, 95% CI) | 0.0 [0.0, 0.0] | |
| 17.7 Flexors (60º) under eccentric isokinetic movement | 1 | Mean Difference (IV, Fixed, 95% CI) | 0.0 [0.0, 0.0] | |
| 17.8 Flexors (180º) under eccentric isokinetic movement | 1 | Mean Difference (IV, Fixed, 95% CI) | 0.0 [0.0, 0.0] | |
| 18 Deficits in isokinetic muscle strength (6 to 11 years) Show forest plot | 1 | Risk Ratio (M‐H, Fixed, 95% CI) | Totals not selected | |
| 18.1 Quadriceps deficit > or = 10% | 1 | Risk Ratio (M‐H, Fixed, 95% CI) | 0.0 [0.0, 0.0] | |
| 18.2 Hamstrings deficit > or = 10% | 1 | Risk Ratio (M‐H, Fixed, 95% CI) | 0.0 [0.0, 0.0] | |