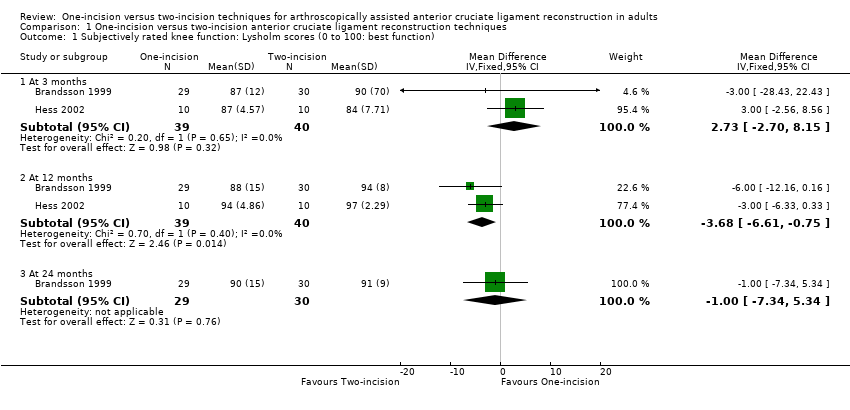
| 1 Subjectively rated knee function: Lysholm scores (0 to 100: best function) Show forest plot | 2 | | Mean Difference (IV, Fixed, 95% CI) | Subtotals only |
|
| 1.1 At 3 months | 2 | 79 | Mean Difference (IV, Fixed, 95% CI) | 2.73 [‐2.70, 8.15] |
| 1.2 At 12 months | 2 | 79 | Mean Difference (IV, Fixed, 95% CI) | ‐3.68 [‐6.61, ‐0.75] |
| 1.3 At 24 months | 1 | 59 | Mean Difference (IV, Fixed, 95% CI) | ‐1.0 [‐7.34, 5.34] |
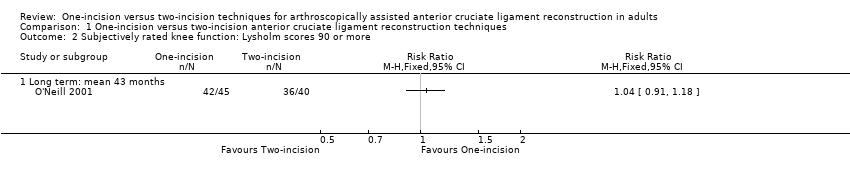
| 2 Subjectively rated knee function: Lysholm scores 90 or more Show forest plot | 1 | | Risk Ratio (M‐H, Fixed, 95% CI) | Totals not selected |
|
| 2.1 Long term: mean 43 months | 1 | | Risk Ratio (M‐H, Fixed, 95% CI) | 0.0 [0.0, 0.0] |
| 3 Adverse events Show forest plot | 4 | | Risk Ratio (M‐H, Fixed, 95% CI) | Subtotals only |
|
| 3.1 Infection | 2 | 89 | Risk Ratio (M‐H, Fixed, 95% CI) | 1.03 [0.07, 15.77] |
| 3.2 Nerve palsy | 1 | 59 | Risk Ratio (M‐H, Fixed, 95% CI) | 0.34 [0.01, 8.13] |
| 3.3 Haemarthrosis requiring joint aspiration | 1 | 59 | Risk Ratio (M‐H, Fixed, 95% CI) | 0.34 [0.04, 3.13] |
| 3.4 Deep vein thrombosis | 1 | 30 | Risk Ratio (M‐H, Fixed, 95% CI) | 3.0 [0.13, 68.26] |
| 3.5 Knee stiffness (loss of terminal extension) (2 to 5 years) | 2 | 144 | Risk Ratio (M‐H, Fixed, 95% CI) | 1.77 [0.40, 7.79] |
| 3.6 Knee stiffness (loss of terminal flexion) (2 to 5 years) | 2 | 144 | Risk Ratio (M‐H, Fixed, 95% CI) | 0.50 [0.14, 1.72] |
| 3.7 Recurrent instability (giving way) | 1 | 27 | Risk Ratio (M‐H, Fixed, 95% CI) | 2.44 [0.11, 54.97] |
| 3.8 Knee swelling at final follow‐up | 1 | 27 | Risk Ratio (M‐H, Fixed, 95% CI) | 1.12 [0.47, 2.65] |
| 3.9 Reoperations | 3 | 205 | Risk Ratio (M‐H, Fixed, 95% CI) | 0.89 [0.37, 2.14] |
| 3.10 Graft failure (6 to 11 years) | 1 | 150 | Risk Ratio (M‐H, Fixed, 95% CI) | 1.25 [0.35, 4.47] |
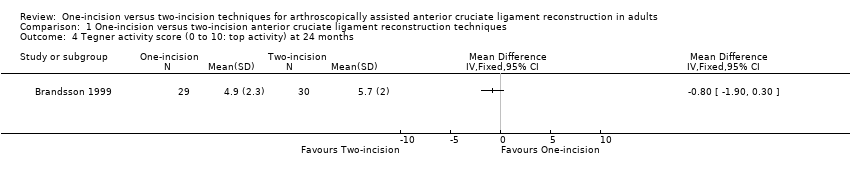
| 4 Tegner activity score (0 to 10: top activity) at 24 months Show forest plot | 1 | | Mean Difference (IV, Fixed, 95% CI) | Totals not selected |
|
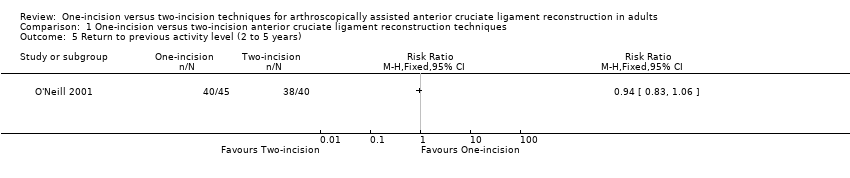
| 5 Return to previous activity level (2 to 5 years) Show forest plot | 1 | | Risk Ratio (M‐H, Fixed, 95% CI) | Totals not selected |
|
| 6 IKDC objective assessment: normal or nearly normal Show forest plot | 5 | | Risk Ratio (M‐H, Fixed, 95% CI) | Subtotals only |
|
| 6.1 At 3 to 6 months | 2 | 43 | Risk Ratio (M‐H, Fixed, 95% CI) | 0.59 [0.33, 1.03] |
| 6.2 At 12 to 28 months | 4 | 167 | Risk Ratio (M‐H, Fixed, 95% CI) | 1.01 [0.85, 1.21] |
| 6.3 At 6 to 11 years | 1 | 150 | Risk Ratio (M‐H, Fixed, 95% CI) | 0.99 [0.91, 1.07] |
| 7 Objective function tests: one‐leg hop quotient (% of other leg) (24 months) Show forest plot | 1 | | Mean Difference (IV, Fixed, 95% CI) | Totals not selected |
|
| 8 Objective function tests: one‐leg hop > 90% contralateral (2 to 5 years) Show forest plot | 1 | | Risk Ratio (M‐H, Fixed, 95% CI) | Totals not selected |
|
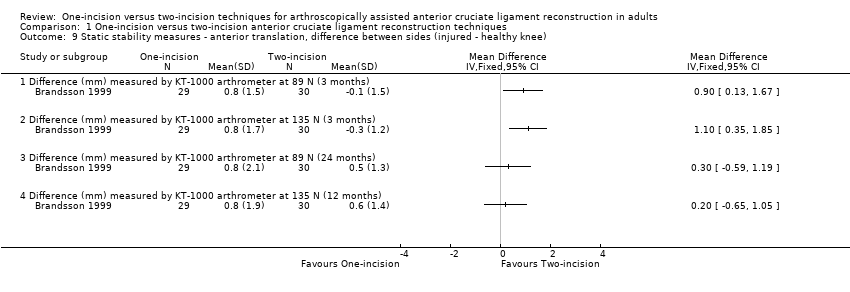
| 9 Static stability measures ‐ anterior translation, difference between sides (injured ‐ healthy knee) Show forest plot | 1 | | Mean Difference (IV, Fixed, 95% CI) | Totals not selected |
|
| 9.1 Difference (mm) measured by KT‐1000 arthrometer at 89 N (3 months) | 1 | | Mean Difference (IV, Fixed, 95% CI) | 0.0 [0.0, 0.0] |
| 9.2 Difference (mm) measured by KT‐1000 arthrometer at 135 N (3 months) | 1 | | Mean Difference (IV, Fixed, 95% CI) | 0.0 [0.0, 0.0] |
| 9.3 Difference (mm) measured by KT‐1000 arthrometer at 89 N (24 months) | 1 | | Mean Difference (IV, Fixed, 95% CI) | 0.0 [0.0, 0.0] |
| 9.4 Difference (mm) measured by KT‐1000 arthrometer at 135 N (12 months) | 1 | | Mean Difference (IV, Fixed, 95% CI) | 0.0 [0.0, 0.0] |
| 10 Static stability measures ‐ anterior translation side‐to‐side difference < 3 mm Show forest plot | 4 | 297 | Risk Ratio (M‐H, Fixed, 95% CI) | 0.96 [0.85, 1.09] |
|
| 10.1 Measured by KT‐1000 arthrometer (12 to 24 months) | 2 | 86 | Risk Ratio (M‐H, Fixed, 95% CI) | 0.95 [0.78, 1.15] |
| 10.2 Measured by KT‐2000 arthrometer (2 to 5 years) | 2 | 211 | Risk Ratio (M‐H, Fixed, 95% CI) | 0.97 [0.83, 1.14] |
| 11 Static stability measures ‐ various Show forest plot | 2 | | Risk Ratio (M‐H, Fixed, 95% CI) | Totals not selected |
|
| 11.1 Pivot‐Shift (normal or nearly normal) (3 months) | 1 | | Risk Ratio (M‐H, Fixed, 95% CI) | 0.0 [0.0, 0.0] |
| 11.2 Lachman (normal or nearly normal) (3 months) | 1 | | Risk Ratio (M‐H, Fixed, 95% CI) | 0.0 [0.0, 0.0] |
| 11.3 Pivot‐Shift (normal or nearly normal) (12 months) | 1 | | Risk Ratio (M‐H, Fixed, 95% CI) | 0.0 [0.0, 0.0] |
| 11.4 Lachman (normal or nearly normal) (12 months) | 1 | | Risk Ratio (M‐H, Fixed, 95% CI) | 0.0 [0.0, 0.0] |
| 11.5 Lachman (normal or nearly normal) (2 to 5 years) | 1 | | Risk Ratio (M‐H, Fixed, 95% CI) | 0.0 [0.0, 0.0] |
| 12 Patellofemoral pain score (0 to 20: best outcome) Show forest plot | 1 | | Mean Difference (IV, Fixed, 95% CI) | Totals not selected |
|
| 12.1 Patellofemoral pain score (3 months) | 1 | | Mean Difference (IV, Fixed, 95% CI) | 0.0 [0.0, 0.0] |
| 12.2 Patellofemoral pain score (12 months) | 1 | | Mean Difference (IV, Fixed, 95% CI) | 0.0 [0.0, 0.0] |
| 12.3 Patellofemoral pain score (24 months) | 1 | | Mean Difference (IV, Fixed, 95% CI) | 0.0 [0.0, 0.0] |
| 13 Pain (early and late postoperative pain) Show forest plot | 1 | | Risk Ratio (M‐H, Fixed, 95% CI) | Totals not selected |
|
| 13.1 Pain (6 weeks) | 1 | | Risk Ratio (M‐H, Fixed, 95% CI) | 0.0 [0.0, 0.0] |
| 13.2 Late pain (mean 15 months) | 1 | | Risk Ratio (M‐H, Fixed, 95% CI) | 0.0 [0.0, 0.0] |
| 14 Knee range of motion (degrees) Show forest plot | 1 | | Mean Difference (IV, Fixed, 95% CI) | Totals not selected |
|
| 14.1 Flexion (3 months) | 1 | | Mean Difference (IV, Fixed, 95% CI) | 0.0 [0.0, 0.0] |
| 14.2 Flexion (6 months) | 1 | | Mean Difference (IV, Fixed, 95% CI) | 0.0 [0.0, 0.0] |
| 14.3 Flexion (12 months) | 1 | | Mean Difference (IV, Fixed, 95% CI) | 0.0 [0.0, 0.0] |
| 14.4 Extension (3 months) | 1 | | Mean Difference (IV, Fixed, 95% CI) | 0.0 [0.0, 0.0] |
| 14.5 Extension (6 months) | 1 | | Mean Difference (IV, Fixed, 95% CI) | 0.0 [0.0, 0.0] |
| 14.6 Extension (12 months) | 1 | | Mean Difference (IV, Fixed, 95% CI) | 0.0 [0.0, 0.0] |
| 15 Range of motion at mean 15 months follow‐up (range 5 to 28 months) Show forest plot | | | Other data | No numeric data |
|
| 16 Peak torque forces (% contralateral side) at 3 and 6 months Show forest plot | | | Other data | No numeric data |
|
| 16.1 3 months | | | Other data | No numeric data |
| 16.2 6 months | | | Other data | No numeric data |
| 17 Muscle strength (peak torque forces) at 12 months Show forest plot | 1 | | Mean Difference (IV, Fixed, 95% CI) | Totals not selected |
|
| 17.1 Extensors (60º) under concentric isokinetic movement | 1 | | Mean Difference (IV, Fixed, 95% CI) | 0.0 [0.0, 0.0] |
| 17.2 Extensors (180º) under concentric isokinetic movement | 1 | | Mean Difference (IV, Fixed, 95% CI) | 0.0 [0.0, 0.0] |
| 17.3 Extensors (60º) under eccentric isokinetic movement | 1 | | Mean Difference (IV, Fixed, 95% CI) | 0.0 [0.0, 0.0] |
| 17.4 Extensors (180º) under eccentric isokinetic movement | 1 | | Mean Difference (IV, Fixed, 95% CI) | 0.0 [0.0, 0.0] |
| 17.5 Flexors (60º) under concentric isokinetic movement | 1 | | Mean Difference (IV, Fixed, 95% CI) | 0.0 [0.0, 0.0] |
| 17.6 Flexors (180º) under concentric isokinetic movement | 1 | | Mean Difference (IV, Fixed, 95% CI) | 0.0 [0.0, 0.0] |
| 17.7 Flexors (60º) under eccentric isokinetic movement | 1 | | Mean Difference (IV, Fixed, 95% CI) | 0.0 [0.0, 0.0] |
| 17.8 Flexors (180º) under eccentric isokinetic movement | 1 | | Mean Difference (IV, Fixed, 95% CI) | 0.0 [0.0, 0.0] |
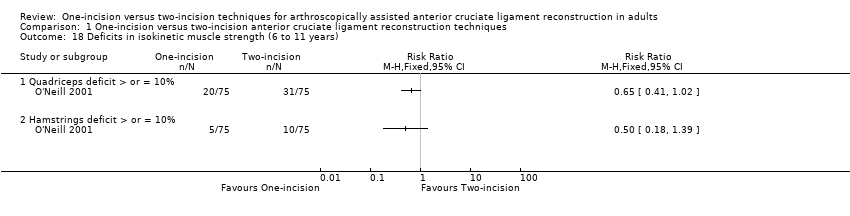
| 18 Deficits in isokinetic muscle strength (6 to 11 years) Show forest plot | 1 | | Risk Ratio (M‐H, Fixed, 95% CI) | Totals not selected |
|
| 18.1 Quadriceps deficit > or = 10% | 1 | | Risk Ratio (M‐H, Fixed, 95% CI) | 0.0 [0.0, 0.0] |
| 18.2 Hamstrings deficit > or = 10% | 1 | | Risk Ratio (M‐H, Fixed, 95% CI) | 0.0 [0.0, 0.0] |