| Trial | Eligibility (ratio intervention: control) | Group | Uptake in intervention | Uptake in control | Comment |
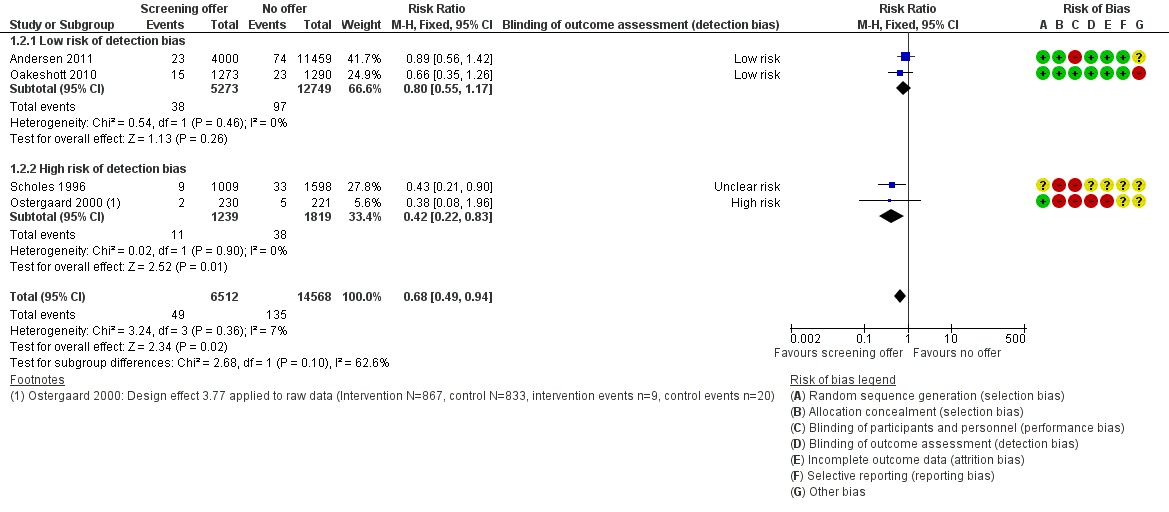
| Andersen 2011 | Selected at random from register (1:4) Intervention: invited for home‐sampling. Assessed after 3 months Control: not contacted. Tests at GP and STI clinics assessed after 3 months | Women | 4000 invited; 1175 (29.4%) sent home‐sample | 11,459 not invited; 1076 (9.4%) opportunistic tests | Control group not aware of trial. Assume routine health‐seeking behaviour over 3 months. If control group testing behaviour continued at the same level over 12 months, the proportion tested by the time the outcome PID was measured could have been higher. |
| Men | 5000 invited; 1033 (20.7%) sent home‐sample | 9980 not invited; 140 (1.4%) opportunistic tests |
| Garcia 2012 | Sex work venues identified and visited by mobile teams | Women | Could not be calculated | Could not be calculated | Not designed to measure uptake; no denominator |
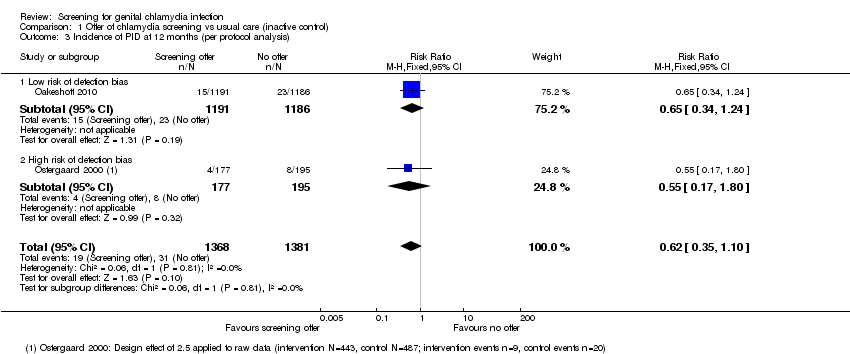
| Oakeshott 2010 | Approached in colleges; all women enrolled were tested, randomised (1:1) | Women | 1259 (100%) immediate screening; 269 (21%) opportunistic tests | 1270 (100%) deferred screening; 258 (20%) opportunistic tests | Not designed to measure uptake |
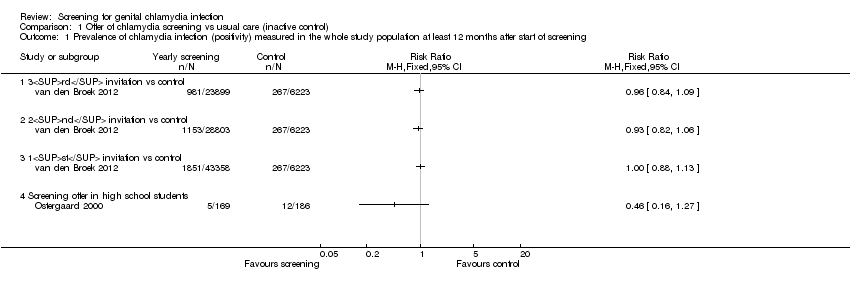
| Ostergaard 2000 | Schools randomised (1:1) Intervention: allocated to home‐sampling Control: allocated to offer of GP testing Sexually active respondents eligible. Assessed after 4 months | Women | 2603 allocated; 928 eligible responders; 867 (93.4%) sent home‐sample | 2884 allocated; 833 eligible responders; 63 (7.6%) opportunistic tests | All students in school were allocated to intervention or control groups and asked if they would take part. Of the responders, only those who had ever had sex were eligible. The denominator of of all who had ever had sex was not known. Intervention group given home‐sampling kits |
| Men | 1733 allocated; 442 eligible responders; 430 (97.3%) sent home sample | 1689 allocated; 246 eligible responders; 4 (1.6%)
opportunistic tests | — |
| Scholes 1996 | Individuals randomised (1:2) Respondents fulfilling criteria for high risk of chlamydia eligible | Women | 36,457 randomised; 20,836 responded;
3111 at high risk | Numbers allocated to intervention and control not reported. Intervention group actively contacted |
| 1009 invited 645 (64%) tested | 1598 not invited; % tested not known |
| van den Broek 2012 | Postal areas allocated (5:1) Intervention: allocated to yearly invitation x3 Control: allocated to single invitation | Women 1st 2nd 3rd | 142,419 invited;
29,831 (21.3%) tested 141,078 invited;
20,246 (14.7%) tested 131,010 invited;
16,853 (17.4%) tested | 24,172 invited;
4199 (17.4%) tested | Postal invitation contained secure login code. Recipients had to register on website to request home‐sampling kit. One reminder letter |
| Men 1st 2nd 3rd | 129,462 invited;
13,617 (10.5%) tested 128,299 invited;
8,616 (6.7%) tested 121,156 invited;
6,970 (5.6%) tested | 23,884 invited
2025 (8.5%) tested |
| All 1st 2nd 3rd | 269,273 invited;
43,358 (16.2%) tested 265,979 invited;
28,803 (10.8%) tested 251,688 invited;
23,899 (9.5%) tested | 48,031 invited
6,223 (13.0%) tested |