Cribado para la infección por clamidia genital
Información
- DOI:
- https://doi.org/10.1002/14651858.CD010866.pub2Copiar DOI

- Base de datos:
-
- Cochrane Database of Systematic Reviews
- Versión publicada:
-
- 13 septiembre 2016see what's new
- Tipo:
-
- Intervention
- Etapa:
-
- Review
- Grupo Editorial Cochrane:
-
Grupo Cochrane de Enfermedades de transmisión sexual
- Copyright:
-
- Copyright © 2016 The Cochrane Collaboration. Published by John Wiley & Sons, Ltd.
Cifras del artículo
Altmetric:
Citado por:
Autores
Contributions of authors
Nicola Low selected studies, extracted data, conducted statistical analyses and drafted and revised the review.
Shelagh Redmond conducted electronic databases searches, selected studies, entered data and conducted statistical analyses.
Berit Andersen, Hannelore Götz, Anneli Uusküla, Jan van Bergen and Helen Ward extracted data, commented on and revised the review.
Sources of support
Internal sources
-
No sources of support supplied
External sources
-
European Centre for Disease Prevention and Control, Sweden.
Financial support for staff to conduct review as part of a project Chlamydia Control in Europe (ECDC/2011/027).
Declarations of interest
Berit Andersen is coauthor of two completed trials that are included in the review.
Jan van Bergen, Hannelore Götz and Nicola Low are coauthors on a completed trial that is included in the review .
Authors of included studies will not be involved in assessing and extracting data of their own studies.
Acknowledgements
The authors would like to thank Marita van der Laar, Otilia Sfetcu and Andrew Amato of the the European Centre for Disease Prevention and Control for funding this review and for their support in developing the review questions and comments on an earlier version of the review (ECDC 2014).
Version history
| Published | Title | Stage | Authors | Version |
| 2016 Sep 13 | Screening for genital chlamydia infection | Review | Nicola Low, Shelagh Redmond, Anneli Uusküla, Jan van Bergen, Helen Ward, Berit Andersen, Hannelore Götz | |
| 2013 Dec 23 | Screening for genital chlamydia infection | Protocol | Nicola Low, Shelagh Redmond, Anneli Uusküla, Jan van Bergen, Helen Ward, Berit Andersen, Hannelore Götz | |
Differences between protocol and review
Types of outcome measures: there is an error in a part of the text of the protocol, but the outcomes stated under the headings 'Primary outcomes' and 'Secondary outcomes' in the protocol are correct and are the same as those reported in the review. The statement following the list of secondary outcomes, "The following outcome will not be included: uptake of chlamydia screening . . ." should read, "The following outcome will not be included as a primary outcome: uptake of chlamydia screening."
We did not calculate the number needed to treat for an additional beneficial outcome (NNTB) or the number needed to treat for an additional harmful outcome (NNTH).
PICO

#Study flow diagram.

Risk of bias summary: review authors' judgements about each risk of bias item for each included study.

Risk of bias graph: review authors' judgements about each risk of bias item presented as percentages across all included studies.
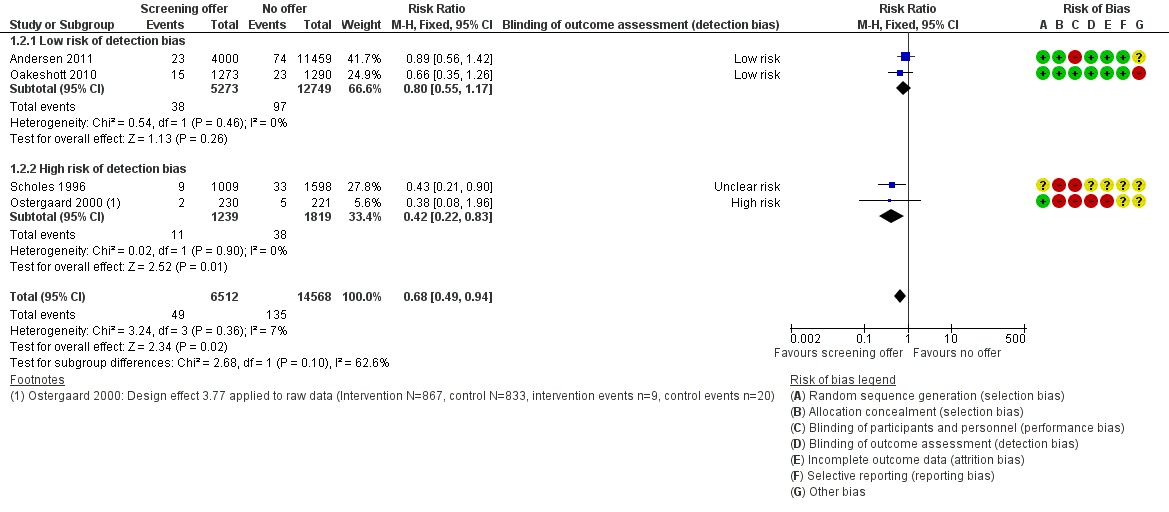
Forest plot of comparison: 1 Offer of chlamydia screening vs usual care (inactive control), outcome: 1.2 Incidence of PID at 12 months (intention‐to‐treat).
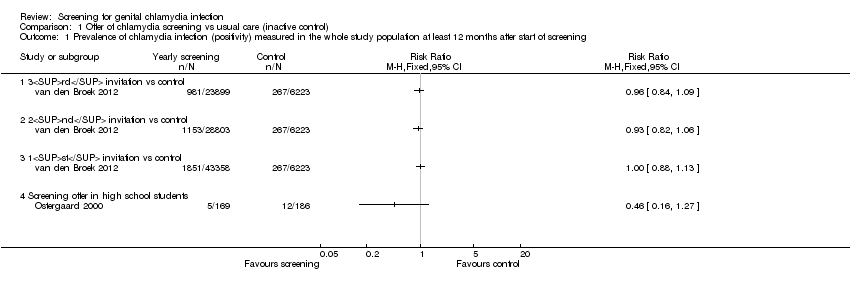
Comparison 1 Offer of chlamydia screening vs usual care (inactive control), Outcome 1 Prevalence of chlamydia infection (positivity) measured in the whole study population at least 12 months after start of screening.

Comparison 1 Offer of chlamydia screening vs usual care (inactive control), Outcome 2 Incidence of PID at 12 months (intention‐to‐treat).
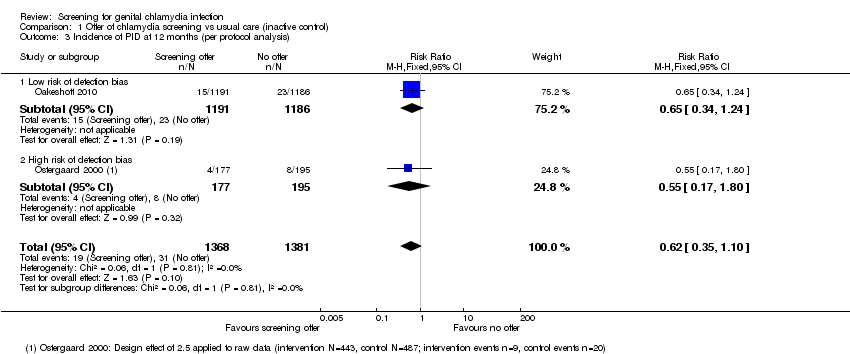
Comparison 1 Offer of chlamydia screening vs usual care (inactive control), Outcome 3 Incidence of PID at 12 months (per protocol analysis).

Comparison 1 Offer of chlamydia screening vs usual care (inactive control), Outcome 4 Incidence of epididymitis in men at 12 months (intention to screen).

Comparison 1 Offer of chlamydia screening vs usual care (inactive control), Outcome 5 Secondary outcomes for reproductive tract morbidity.
| Chlamydia screening compared with usual care for the prevention of C. trachomatis transmission and reproductive tract morbidity | |||||
| Patient or population: healthy adults Settings: general population, high schools or colleges Intervention: chlamydia screening Comparison: usual care | |||||
| Outcomes | Absolute effect | Relative effect | No of Participants | Quality of the evidence | Comments |
| Chlamydia prevalence (general population) Outcome was chlamydia test positivity after 3 yearly invitations in intervention clusters vs 1 invitation in control areas. Uptake was too low for chlamydia positivity to be considered an unbiased estimate of prevalence. | RD 0.0% (‐0‐01, +0.01%) | RR 0.96 (0.84 to 1.09) | 30,122 (1 study) | ⊕⊕⊝⊝1,2 | |
| Chlamydia prevalence (high risk population) Outcome was prevalence of positive chlamydia tests in repeated cross‐sectional surveys of women tested at sex venues after 4 years of intervention. | RD ‐3.7% | RR 0.72 (0.54 to 0.98) | 4156 (1 study) | ⊕⊕⊝⊝3 | |
| Incidence of pelvic inflammatory disease (PID) at 12 months (intention‐to‐treat) Outcome was clinically diagnosed PID reported by the participant or extracted from medical records, pharmacy records or hospital discharge coding. Outcome very likely to be affected by risk of detection bias. | RD 0.0% (0‐0, 0.0%) | RR 0.68 (0.49 to 0.94) | 21,686 (4 studies) | ⊕⊕⊕⊝4 | |
| Incidence of epididymitis in men at 12 months (intention‐to‐treat) Outcome was epididymitis diagnosed in hospital and abstracted from hospital discharge coding. | RD 0.0% (0.0, 0.0%) | RR 0.80 (0.45 to 1.42) | 14,980 (1 study) | ⊕⊝⊝⊝5,6 | |
| GRADE Working Group grades of evidence CI: confidence interval; PID: pelvic inflammatory disease; RR: risk ratio. | |||||
| 1. Selection, attrition and other bias 2. One large non‐randomized cluster‐controlled trial. 3. Single large trial in female sex workers and uncertainty about generalisability to other screening interventions and populations. 4. Selection bias might have overestimated intervention effect. 5. Low uptake of the screening intervention with an imprecise effect estimate and uncertainty about estimated effect of screening interventions with higher sustained levels of uptake. 6. Performance bias | |||||
| Trial | Study population | Baseline | Follow‐up, 12 months | Reported effect (95% CI) | Follow‐up, subsequent | Reported effect (95% CI) | |||
| Intervention | Control | Intervention | Control | Intervention | Control | ||||
| High school students, Denmark | 43/867a | Not measured | 13/443a | 32/487 | RD − 5.5% (− 10 to 0.95%)a | — | — | — | |
| General population, Netherlands | 1851/43358 | 267/6223 | 1153/28803 | Not measured | OR 0.93 (0.81 to 1.07)b | 981/23899 | Not measured | OR 0.96 (0.83 to 1.10)b | |
| Female sex workers, Peru | 13.8% | 15.5% | — | — | — | 9.9% | 14.5% | RR 0.66 (0.47 to 0.94)c | |
| CI: confidence interval; OR: odds ratio; RD: risk difference; RR: risk ratio. | |||||||||
| Trial | Eligibility (ratio intervention: control) | Group | Uptake in intervention | Uptake in control | Comment |
| Selected at random from register (1:4) Intervention: invited for home‐sampling. Assessed after 3 months Control: not contacted. Tests at GP and STI clinics assessed after 3 months | Women | 4000 invited; 1175 (29.4%) sent home‐sample | 11,459 not invited; 1076 (9.4%) opportunistic tests | Control group not aware of trial. Assume routine health‐seeking behaviour over 3 months. If control group testing behaviour continued at the same level over 12 months, the proportion tested by the time the outcome PID was measured could have been higher. | |
| Men | 5000 invited; 1033 (20.7%) sent home‐sample | 9980 not invited; 140 (1.4%) opportunistic tests | |||
| Sex work venues identified and visited by mobile teams | Women | Could not be calculated | Could not be calculated | Not designed to measure uptake; no denominator | |
| Approached in colleges; all women enrolled were tested, randomised (1:1) | Women | 1259 (100%) immediate screening; 269 (21%) opportunistic tests | 1270 (100%) deferred screening; 258 (20%) opportunistic tests | Not designed to measure uptake | |
| Schools randomised (1:1) Intervention: allocated to home‐sampling Control: allocated to offer of GP testing Sexually active respondents eligible. Assessed after 4 months | Women | 2603 allocated; 928 eligible responders; 867 (93.4%) sent home‐sample | 2884 allocated; 833 eligible responders; 63 (7.6%) opportunistic tests | All students in school were allocated to intervention or control groups and asked if they would take part. Of the responders, only those who had ever had sex were eligible. The denominator of of all who had ever had sex was not known. Intervention group given home‐sampling kits | |
| Men | 1733 allocated; 442 eligible responders; 430 (97.3%) sent home sample | 1689 allocated; 246 eligible responders; 4 (1.6%) | — | ||
| Individuals randomised (1:2) Respondents fulfilling criteria for high risk of chlamydia eligible | Women | 36,457 randomised; 20,836 responded; | Numbers allocated to intervention and control not reported. Intervention group actively contacted | ||
| 1009 invited 645 (64%) tested | 1598 not invited; % tested not known | ||||
| Postal areas allocated (5:1) Intervention: allocated to yearly invitation x3 Control: allocated to single invitation | Women 1st 2nd 3rd | 142,419 invited; 141,078 invited; 131,010 invited; | 24,172 invited; | Postal invitation contained secure login code. Recipients had to register on website to request home‐sampling kit. One reminder letter | |
| Men 1st 2nd 3rd | 129,462 invited; 128,299 invited; 121,156 invited; | 23,884 invited | |||
| All 1st 2nd 3rd | 269,273 invited; 265,979 invited; 251,688 invited; | 48,031 invited | |||
| GP: general practitioner; PID: pelvic inflammatory disease; STI: sexually transmitted infection. | |||||
| Outcome or subgroup title | No. of studies | No. of participants | Statistical method | Effect size |
| 1 Prevalence of chlamydia infection (positivity) measured in the whole study population at least 12 months after start of screening Show forest plot | 2 | Risk Ratio (M‐H, Fixed, 95% CI) | Totals not selected | |
| 1.1 3rd invitation vs control | 1 | Risk Ratio (M‐H, Fixed, 95% CI) | 0.0 [0.0, 0.0] | |
| 1.2 2nd invitation vs control | 1 | Risk Ratio (M‐H, Fixed, 95% CI) | 0.0 [0.0, 0.0] | |
| 1.3 1st invitation vs control | 1 | Risk Ratio (M‐H, Fixed, 95% CI) | 0.0 [0.0, 0.0] | |
| 1.4 Screening offer in high school students | 1 | Risk Ratio (M‐H, Fixed, 95% CI) | 0.0 [0.0, 0.0] | |
| 2 Incidence of PID at 12 months (intention‐to‐treat) Show forest plot | 4 | 21080 | Risk Ratio (M‐H, Fixed, 95% CI) | 0.68 [0.49, 0.94] |
| 2.1 Low risk of detection bias | 2 | 18022 | Risk Ratio (M‐H, Fixed, 95% CI) | 0.80 [0.55, 1.17] |
| 2.2 High risk of detection bias | 2 | 3058 | Risk Ratio (M‐H, Fixed, 95% CI) | 0.42 [0.22, 0.83] |
| 3 Incidence of PID at 12 months (per protocol analysis) Show forest plot | 2 | 2749 | Risk Ratio (M‐H, Fixed, 95% CI) | 0.62 [0.35, 1.10] |
| 3.1 Low risk of detection bias | 1 | 2377 | Risk Ratio (M‐H, Fixed, 95% CI) | 0.65 [0.34, 1.24] |
| 3.2 High risk of detection bias | 1 | 372 | Risk Ratio (M‐H, Fixed, 95% CI) | 0.55 [0.17, 1.80] |
| 4 Incidence of epididymitis in men at 12 months (intention to screen) Show forest plot | 1 | 14980 | Risk Ratio (M‐H, Fixed, 95% CI) | 0.80 [0.45, 1.42] |
| 5 Secondary outcomes for reproductive tract morbidity Show forest plot | 1 | Risk Difference (M‐H, Fixed, 95% CI) | Totals not selected | |
| 5.1 Female infertility | 1 | Risk Difference (M‐H, Fixed, 95% CI) | 0.0 [0.0, 0.0] | |
| 5.2 Ectopic pregnancy | 1 | Risk Difference (M‐H, Fixed, 95% CI) | 0.0 [0.0, 0.0] | |