Tratamiento para pacientes con anemia ferropénica posparto
Información
- DOI:
- https://doi.org/10.1002/14651858.CD010861.pub2Copiar DOI

- Base de datos:
-
- Cochrane Database of Systematic Reviews
- Versión publicada:
-
- 13 agosto 2015see what's new
- Tipo:
-
- Intervention
- Etapa:
-
- Review
- Grupo Editorial Cochrane:
-
Grupo Cochrane de Embarazo y parto
- Copyright:
-
- Copyright © 2015 The Cochrane Collaboration. Published by John Wiley & Sons, Ltd.
Cifras del artículo
Altmetric:
Citado por:
Autores
Contributions of authors
Veronika Markova wrote the protocol update and developed this version of the review, searched the references for the background section, adjusted the methodology section, determining the outcomes and types of analyses and conducted the search in the WHO ICTRP and LILACS registries.
Veronika Markova and Astrid Norgaard independently screened the literature for inclusion, assessed risk of bias and extracted data from relevant trials. Veronika Markova entered data into Review Manager 5.3 (proofread by Astrid Norgaard), carried out the statistical analyses, produced the GRADE 'Summary of findings' tables with the support from Karsten Juhl Jørgensen and wrote review drafts.
Astrid Norgaard also provided expert knowledge on current trends in anaemia treatment options and outcomes.
Karsten Juhl Jørgensen provided expert knowledge regarding the methods. He assisted with the statistical analyses and the 'Summary of findings' tables.
Jens Langhoff‐Roos provided expert clinical knowledge on current treatment regiments for postpartum anaemia. He took part in initiating the project of this Cochrane review.
All authors reviewed all manuscript drafts and contributed to the final preparation of the review.
Sources of support
Internal sources
-
This was a non‐profit project and the co‐authors did not receive financial support for their efforts, Denmark.
External sources
-
No sources of support supplied
Declarations of interest
Jens Langhoff‐Roos and Astrid Norgaard are supervisors of an ongoing PhD study (Holm 2015) at University of Copenhagen by Charlotte Holm. The PhD study (EUCTR2012‐005783‐10‐DK) is partly financed by Pharmacosmos which supplies IV iron for the studies. Jens Langhoff‐Roos has no financial interest in this or other pharmaceutical companies. Astrid Norgaard is the principal investigator of one clinical trial and the sponsor of another clinical trial, both partly financed by Pharmacosmos (EudraCT Number 2012‐001529‐28 and 2013‐004979‐13) ‐ neither of these trials would be potentially eligible for inclusion in this review. Astrid Norgaard has no financial interest in this or other pharmaceutical companies.
Veronika Markova: none known
Karsten Juhl Jørgensen: none known
Acknowledgements
We acknowledge the important work of the previous review team (Dodd 2004).
We are grateful for the Pregnancy and Childbirth Group Trials Register search provided by Cochrane Pregnancy and Childbirth's Trials Search Co‐ordinator.
Also, we are very grateful to those corresponding authors and trial investigators who took the time to answer our questions and provided the requested information (Backe 2009;Daniilidis 2011; Froessler 2013; Giannoulis 2009; Guerra 2012; Krafft 2011; Prick 2014; Van Wyck 2007; Wagstrom 2007; Westad 2008).
As part of the pre‐publication editorial process, this review has been commented on by two peers (an editor and referee who is external to the editorial team), a member of the Pregnancy and Childbirth Group's international panel of consumers and the Group's Statistical Adviser.
This project was supported by the National Institute for Health Research, via Cochrane Infrastructure funding to Cochrane Pregnancy and Childbirth. The views and opinions expressed therein are those of the authors and do not necessarily reflect those of the Systematic Reviews Programme, NIHR, NHS or the Department of Health.
Version history
| Published | Title | Stage | Authors | Version |
| 2015 Aug 13 | Treatment for women with postpartum iron deficiency anaemia | Review | Veronika Markova, Astrid Norgaard, Karsten Juhl Jørgensen, Jens Langhoff‐Roos | |
| 2013 Dec 02 | Treatment for women with postpartum iron deficiency anaemia | Protocol | Veronika Markova, Astrid Nørgaard, Karsten Juhl Jørgensen, Jens Langhoff‐Roos | |
Differences between protocol and review
Section: Objectives
Protocol
To assess the efficacy and safety of the available treatment modalities for women with postpartum iron deficiency. These include oral and parenteral iron supplementation, folate, erythropoietin, and blood transfusion.
Review
To assess the efficacy and harms of the available treatment modalities for women with postpartum iron deficiency anaemia. These include oral and parenteral iron, erythropoietin, and blood transfusion.
Comment
We have now learned that the term "safety" is mostly used by intervention trials and indicates a positive tone. We find the term "harms" more appropriate, as we report on registered adverse events of treatment and thus on lack of safety. Also, it is not appropriate to list folate as a treatment for iron deficiency anaemia.
Section: Types of interventions
Protocol
Iron supplementation administered orally or parenterally, either alone or in combination with folate, erythropoietin or blood transfusion started within the first six weeks after giving birth and compared with placebo, another treatment, or no treatment.
Review
Treatment for postpartum iron deficiency anaemia started within the first six weeks after giving birth compared with placebo, no treatment or another treatment.
Currently, accepted treatment for iron deficiency anaemia includes blood transfusion or iron supplementation administered orally or parenterally, either alone or in combination with folate and/or erythropoietin.
Folat supplementation was not considered as an independent treatment of iron deficiency anaemia, but was accepted as a part of other types of treatment for postpartum iron deficiency anaemia.
New treatment modalities appropriate for iron deficiency anaemia will be included in future updates.
Comment
This to ensure inclusion of any new treatments appropriate for iron deficiency anaemia that will be investigated in the future.
Section: Outcomes
Protocol
Primary outcomes
-
Maternal mortality.
-
Fatigue (as reported by the women ‐ verbalisation of fatigue or lack of energy and inability to maintain usual routines; measured by a scale or questionnaire; or as defined by the trial authors).
Secondary outcomes
-
Persistent anaemia symptoms during treatment. Any of the following symptoms: dyspnoea, tachypnoea, tachycardia, palpitations, orthostatic dizziness, syncopation, paleness.
-
Psychological well being (including cognitive performance); measured by the ’Blues Questionnaire’ (Kennerley 1989), ’Selfreport symptom inventory 90 [SCL‐90‐R]’ (Schmitz 1999), ’SF36 [Medical Outcomes Study Short Form]’ (Ware 2000), or similar questionnaire; or as defined by the trial authors).
-
Urinary tract infection, endometritis, or other infections (as defined by the trial authors).
-
Compliance to treatment (as defined by the trial authors).
-
Breastfeeding (at hospital discharge; six weeks postpartum; six months postpartum).
-
Length of hospital stay.
-
Any adverse events during treatment (each type of harm analysed individually, when possible).
-
Number of red blood cell transfusions (number of transfused women and number of red blood cell units per woman).
We will not apply any restrictions regarding follow‐up periods, to avoid excluding data on any long‐term benefits or harms. Studies of included interventions that do not report any of the above mentioned outcomes will be described in the ’Characteristics of included studies’ section, but will not be included in any meta‐analyses.
We plan to include the following outcomes in the ’Summary of findings’ tables of the review, using the Grade Profiler programme (GRADEpro).
-
Maternal mortality
-
Fatigue
-
Constipation (when treatment was oral iron substitution)
-
Allergic reactions (when treatment was intravenous iron)
Review
Primary outcomes
-
Maternal mortality: We considered that no women died only if: a) this was stated explicitly, or b) no dropouts occurred during follow‐up, or c) contact authors provided this information on request. Mortality was considered present only if: a) stated explicitly in published report or b) contact authors provided this information on request. Mortality was assessed as not reported if a) no mention of dropouts or their causes, b) all dropouts not accounted for, c) dropouts not explicitly reported to be alive at the end of the follow‐up period.
-
Fatigue: as reported by the women ‐ verbalisation of fatigue or lack of energy and inability to maintain usual routines; measured by a scale or questionnaire; or as defined by the trial authors. Short‐term and long‐term results, thus the minimal and maximal time from baseline.
Secondary outcomes
-
Persistent anaemia symptoms during treatment. Any of the following symptoms: dyspnoea, tachypnoea, tachycardia, palpitations, orthostatic dizziness, syncopation, paleness.
-
Psychological well being, including cognitive performance, measured by the 'Blues Questionnaire' (Kennerley 1989), 'Self‐report symptom inventory 90 [SCL‐90‐R]' (Schmitz 1999), 'SF36 [Medical Outcomes Study Short Form]' (Ware 2000) or similar questionnaire; or as defined by the trial authors. Only short‐term results, thus the minimal time from baseline.
-
Urinary tract infection, endometritis, or other infections (as defined by the trial authors).
-
Compliance to treatment (as defined by the trial authors).
-
Breastfeeding (at hospital discharge; six weeks postpartum; six months postpartum).
-
Length of hospital stay.
-
Any adverse events during treatment (each type of harm analysed individually, when possible).
-
Number of RBC transfusions (number of transfused women and number of RBC units per woman).
For outcomes other than psychological well being, we did not apply any restrictions regarding follow‐up periods to avoid excluding data on any long‐term benefits or harms. We did not apply language restrictions.
We planned to include the following outcomes in the 'Summary of findings' tables of the review, using the Grade Profiler programme (GRADEpro 2014).
-
Maternal mortality
-
Fatigue
-
Constipation (for oral iron substitution)
-
Allergic reactions (for intravenous iron)
The comparisons included in a 'Summary of findings' tables were chosen based on relevance to current treatment standards according to clinical experts. Therefore we chose not to include treatment with IV EPO or yeast extract in a 'Summary of findings' table, as these methods are no longer practiced. For the treatment‐specific outcomes listed above (constipation and allergic reactions,) the results were included in a 'Summary of findings' table if the specific treatment was present in only one of the study arms.
We chose to include additional outcomes in the 'Summary of findings' tables, which we found important for clinical decision making for each individual treatment modality, when this treatment was present in only one of the study arms. For comparisons with IV iron, this outcome was infections. For comparisons with oral iron we included all GI symptoms combined. For comparisons with RBC transfusions we included infections, thromboembolic events and transfusion‐specific adverse events, such as alloantibody formation and transfusion reactions. For comparisons with EPO, thromboembolic events were essential. For all comparisons which met the above mentioned criteria, we found it important to include anaemia symptoms.
Comment
Mortality is an important primary outcome, and it should be clear how we interpreted the data.
Quality of life outcomes (fatigue and psychological well being) were reported in a manner that produced a very large amount of data. This was due to reporting on multiple domains at multiple different time points. We had to rationally restrict this vast amount of analyses to a manageable and amount of information.
The additional outcomes in the 'Summary of findings' tables are important for clinical decision making.
Section: Sensitivity analysis
Protocol
We plan to carry out a sensitivity analysis based on trial design involving trials with a low risk of bias in all bias domains of the ’Risk of bias’ tool, thus removing trials with a high or unclear risk of bias in any domain.
We will also carry out sensitivity analyses to explore the effects of random‐effects analyses for outcomes with statistical heterogeneity and the effects of any assumptions made such as the value of the ICC used for cluster‐randomised trials.
We will use our primary outcomes only (maternal mortality and fatigue) in the sensitivity analyses.
Review
We planned to carry out a sensitivity analysis based on trial design, thus excluding trials with a high risk of selection, performance, and detection bias.
We also planned to carry out sensitivity analyses to explore the effects of random‐effects analyses for outcomes with statistical heterogeneity and the effects of any assumptions made such as the value of the ICC used for cluster‐randomised trials.
We planned sensitivity analyses only for our primary outcomes (maternal mortality and fatigue). Provided that enough data become available, we will attempt to carry out sensitivity analyses for all comparisons in future updates.
Comment
The original phrase was far too restrictive, as it is practically impossible to find a trial with low risk of bias in all domains, and we would never be able to make sensitivity analyses. Sensitivity analyses on the above mentioned domains will allow us to investigate the effect of trial design, thus factors directly controlled by the trial authors.
Section: Assessment of risk of bias in included studies
Protocol
Standart text listing all seven bias domains (please see the protocol for this review).
Review
Two review authors (VM and AN) independently assessed risk of bias for each study using the criteria outlined in the Cochrane Handbook for Systematic Reviews of Interventions and a 'Risk of bias' table (Higgins 2011). As per Cochrane standards, we assessed selection bias, performance bias, detection bias, attrition bias, reporting bias, and other bias. Each type of bias was assessed as low, high, or unclear. All disagreements were resolved by discussion, or by involving a third assessor (KJ or Jens Langhoff‐Roos (JLR)).
We made explicit judgements about whether studies were at high risk of bias, according to the criteria given in the Cochrane Handbook (Higgins 2011). Where possible, we assessed the likely magnitude and direction of the bias and whether we considered if it was likely to impact the findings. We explored the impact of bias through Sensitivity analysis.
We used Grade Profiler (GRADEpro 2014) to make 'Summary of findings' tables. We included our primary outcomes, constipation (when treated with oral iron), and allergic reactions (when treated with intravenous (IV) iron). We also included additional outcomes, which we considered important for the decision‐making process.
Comment
We received permission to simply refer to the Cochrane Handbook in the 'Assessment of risk of bias in included studies' section, instead of copying the standard text along with the seven listed bias domains. We are aware that traditionally this complete text is written in Pregnancy and Childbirth Group reviews. However, it is fully described in the easily accessible Cochrane Handbook and refraining from citing the whole text saves a lot of space.
Keywords
MeSH
Medical Subject Headings (MeSH) Keywords
- Administration, Oral;
- Anemia, Iron-Deficiency [*therapy];
- *Erythrocyte Transfusion;
- Erythropoietin [*therapeutic use];
- Fatigue [etiology, therapy];
- Injections, Intravenous;
- Iron [*administration & dosage, adverse effects];
- Postpartum Period;
- Puerperal Disorders [*therapy];
- Randomized Controlled Trials as Topic;
Medical Subject Headings Check Words
Adult; Female; Humans;
PICO

Study flow diagram.

'Risk of bias' graph: review authors' judgements about each risk of bias item presented as percentages across all included studies.

'Risk of bias' summary: review authors' judgements about each risk of bias item for each included study.
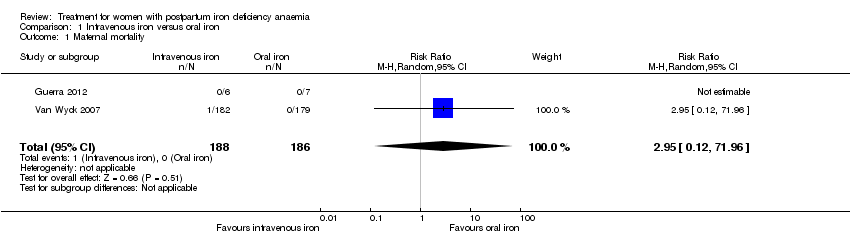
Comparison 1 Intravenous iron versus oral iron, Outcome 1 Maternal mortality.

Comparison 1 Intravenous iron versus oral iron, Outcome 2 Fatigue ‐ 14 days.

Comparison 1 Intravenous iron versus oral iron, Outcome 3 Fatigue ‐ 42 days.
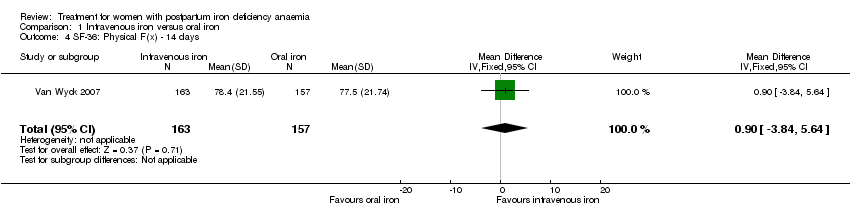
Comparison 1 Intravenous iron versus oral iron, Outcome 4 SF‐36: Physical F(x) ‐ 14 days.
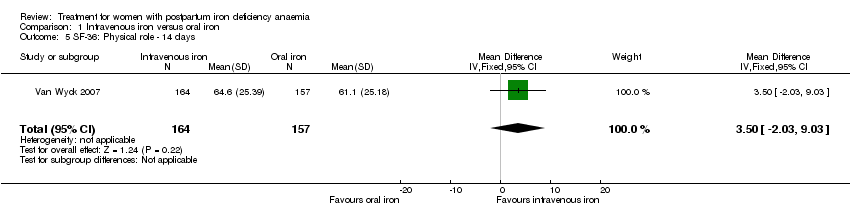
Comparison 1 Intravenous iron versus oral iron, Outcome 5 SF‐36: Physical role ‐ 14 days.
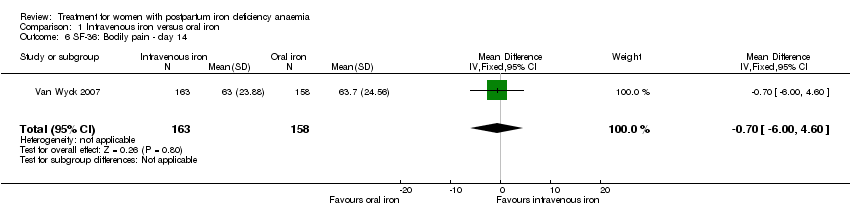
Comparison 1 Intravenous iron versus oral iron, Outcome 6 SF‐36: Bodily pain ‐ day 14.

Comparison 1 Intravenous iron versus oral iron, Outcome 7 SF‐36: General health ‐ 14 days.

Comparison 1 Intravenous iron versus oral iron, Outcome 8 SF‐36: Vitality ‐ 14 days.
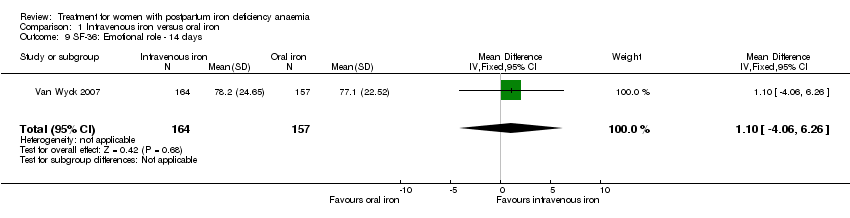
Comparison 1 Intravenous iron versus oral iron, Outcome 9 SF‐36: Emotional role ‐ 14 days.

Comparison 1 Intravenous iron versus oral iron, Outcome 10 SF‐36: Social function ‐ 14 days.
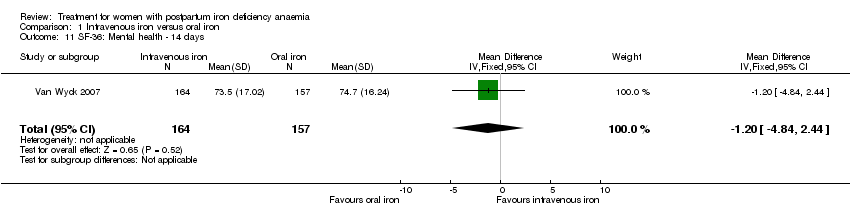
Comparison 1 Intravenous iron versus oral iron, Outcome 11 SF‐36: Mental health ‐ 14 days.

Comparison 1 Intravenous iron versus oral iron, Outcome 12 Depression.

Comparison 1 Intravenous iron versus oral iron, Outcome 13 Infections.

Comparison 1 Intravenous iron versus oral iron, Outcome 14 Compliance to treatment.

Comparison 1 Intravenous iron versus oral iron, Outcome 15 All gastrointestinal symptoms.
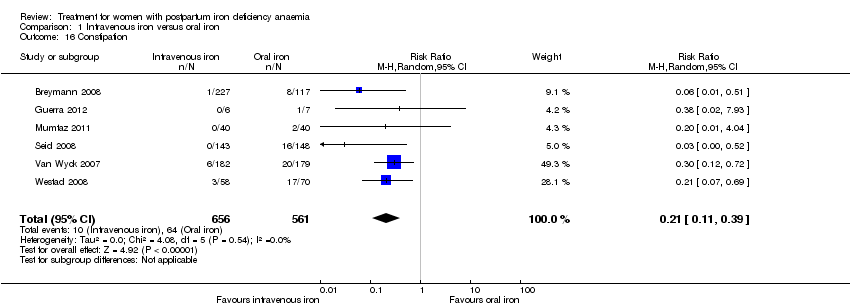
Comparison 1 Intravenous iron versus oral iron, Outcome 16 Constipation.
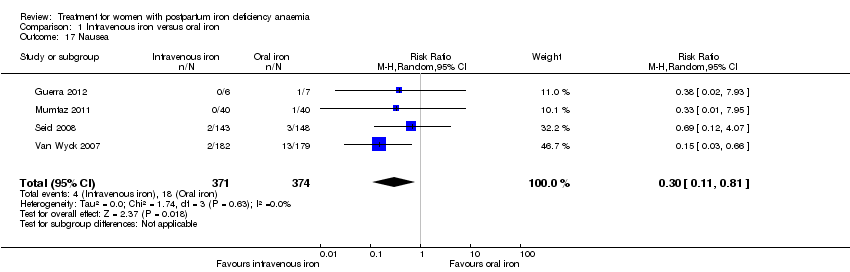
Comparison 1 Intravenous iron versus oral iron, Outcome 17 Nausea.

Comparison 1 Intravenous iron versus oral iron, Outcome 18 Gastrointestinal pain.

Comparison 1 Intravenous iron versus oral iron, Outcome 19 Diarrhoea.

Comparison 1 Intravenous iron versus oral iron, Outcome 20 Vomiting.

Comparison 1 Intravenous iron versus oral iron, Outcome 21 Dyspepsia.

Comparison 1 Intravenous iron versus oral iron, Outcome 22 Dysgeusia.
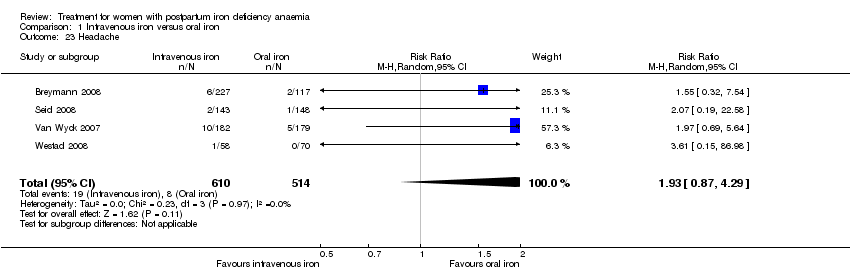
Comparison 1 Intravenous iron versus oral iron, Outcome 23 Headache.

Comparison 1 Intravenous iron versus oral iron, Outcome 24 Hepatic involvement.
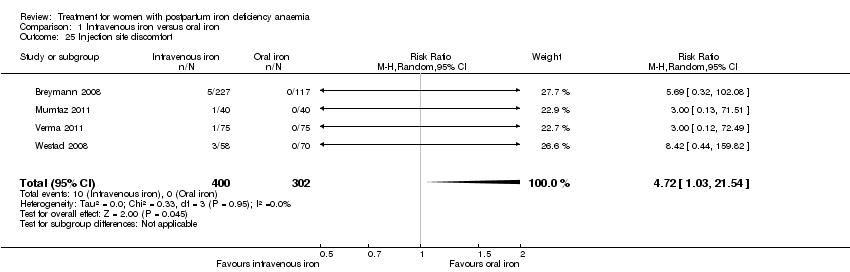
Comparison 1 Intravenous iron versus oral iron, Outcome 25 Injection site discomfort.
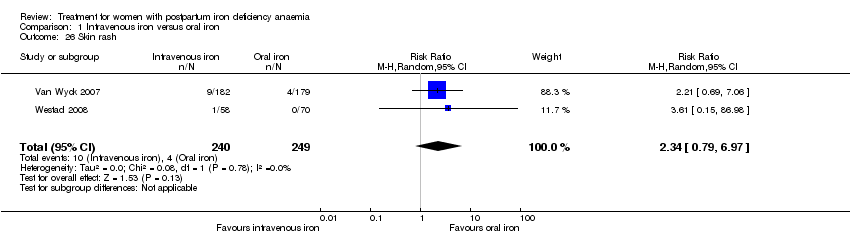
Comparison 1 Intravenous iron versus oral iron, Outcome 26 Skin rash.

Comparison 1 Intravenous iron versus oral iron, Outcome 27 Urticaria.

Comparison 1 Intravenous iron versus oral iron, Outcome 28 Flush.
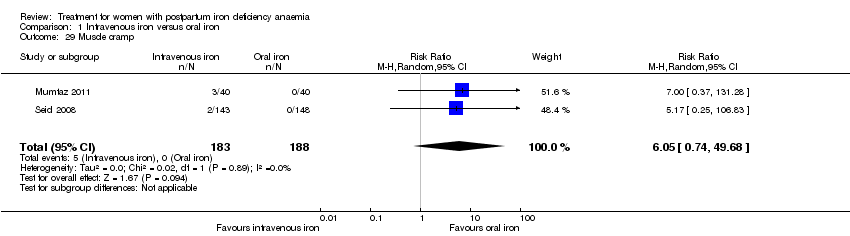
Comparison 1 Intravenous iron versus oral iron, Outcome 29 Muscle cramp.

Comparison 1 Intravenous iron versus oral iron, Outcome 30 Pain (not specified).

Comparison 1 Intravenous iron versus oral iron, Outcome 31 Seriouse adverse events (not specified).

Comparison 1 Intravenous iron versus oral iron, Outcome 32 Anaphylaxis or evidence of hypersensitivity.
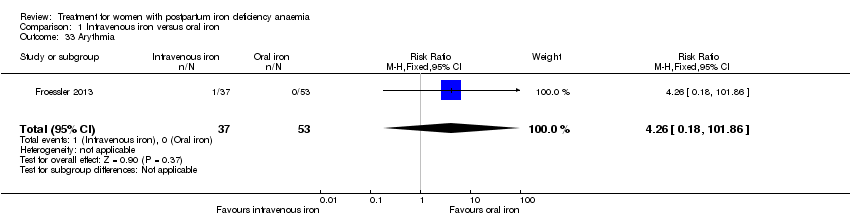
Comparison 1 Intravenous iron versus oral iron, Outcome 33 Arythmia.

Comparison 1 Intravenous iron versus oral iron, Outcome 34 Red blood cell transfusion.
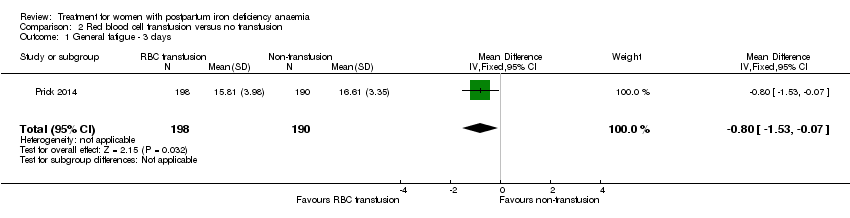
Comparison 2 Red blood cell transfusion versus no transfusion, Outcome 1 General fatigue ‐ 3 days.

Comparison 2 Red blood cell transfusion versus no transfusion, Outcome 2 General fatigue ‐ 6 weeks.

Comparison 2 Red blood cell transfusion versus no transfusion, Outcome 3 SF‐36: Physical functioning ‐ 1 week.
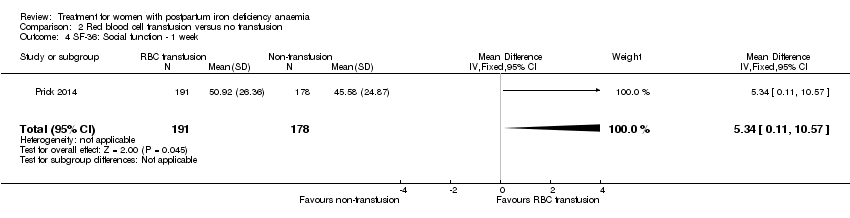
Comparison 2 Red blood cell transfusion versus no transfusion, Outcome 4 SF‐36: Social function ‐ 1 week.

Comparison 2 Red blood cell transfusion versus no transfusion, Outcome 5 SF‐36: Physical role ‐ 1 week.

Comparison 2 Red blood cell transfusion versus no transfusion, Outcome 6 SF‐36: Bodily pain ‐ 1 week.
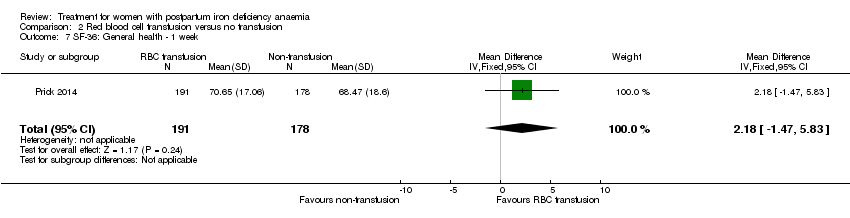
Comparison 2 Red blood cell transfusion versus no transfusion, Outcome 7 SF‐36: General health ‐ 1 week.
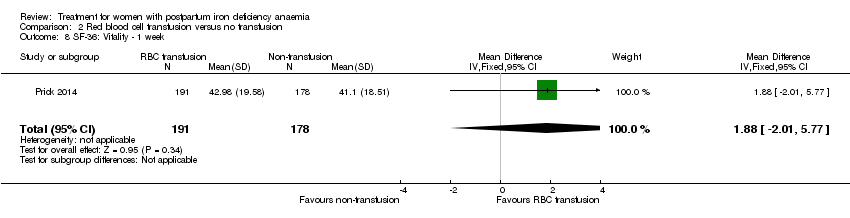
Comparison 2 Red blood cell transfusion versus no transfusion, Outcome 8 SF‐36: Vitality ‐ 1 week.

Comparison 2 Red blood cell transfusion versus no transfusion, Outcome 9 SF‐36: Emotional role ‐ 1 week.

Comparison 2 Red blood cell transfusion versus no transfusion, Outcome 10 SF‐36: Mental health ‐ 1 week.

Comparison 2 Red blood cell transfusion versus no transfusion, Outcome 11 Infections.
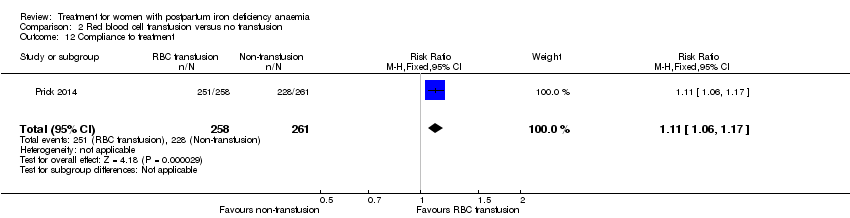
Comparison 2 Red blood cell transfusion versus no transfusion, Outcome 12 Compliance to treatment.

Comparison 2 Red blood cell transfusion versus no transfusion, Outcome 13 Breastfeeding at six weeks.

Comparison 2 Red blood cell transfusion versus no transfusion, Outcome 14 Erythrocyte alloantibody formation.

Comparison 2 Red blood cell transfusion versus no transfusion, Outcome 15 Rash.

Comparison 2 Red blood cell transfusion versus no transfusion, Outcome 16 Fever.
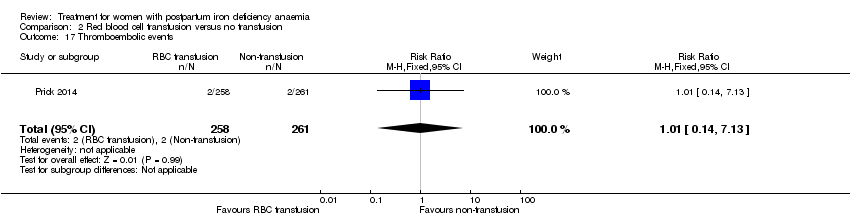
Comparison 2 Red blood cell transfusion versus no transfusion, Outcome 17 Thromboembolic events.

Comparison 2 Red blood cell transfusion versus no transfusion, Outcome 18 Parenteral iron intolerance.

Comparison 2 Red blood cell transfusion versus no transfusion, Outcome 19 Transfusion reactions.

Comparison 3 Oral iron versus placebo, Outcome 1 Digit Symbol Substitution test ‐ 10 weeks.

Comparison 3 Oral iron versus placebo, Outcome 2 EPDS ‐ 10 weeks.

Comparison 3 Oral iron versus placebo, Outcome 3 STAI ‐ 10 weeks.

Comparison 3 Oral iron versus placebo, Outcome 4 Percieved Stress ‐ 10 weeks.

Comparison 3 Oral iron versus placebo, Outcome 5 Breastfeeding at two days postpartum.

Comparison 3 Oral iron versus placebo, Outcome 6 Back pain.

Comparison 3 Oral iron versus placebo, Outcome 7 All gastrointestinal symptoms.
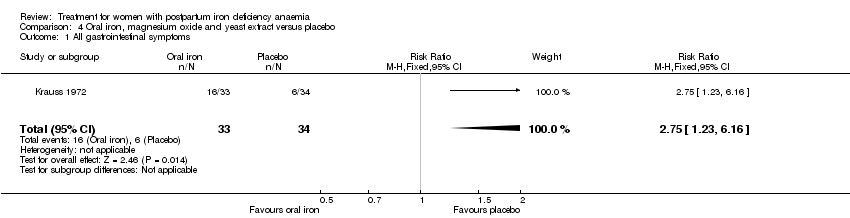
Comparison 4 Oral iron, magnesium oxide and yeast extract versus placebo, Outcome 1 All gastrointestinal symptoms.

Comparison 5 Intravenous iron and oral iron after 4 weeks versus oral iron (week 5‐12), Outcome 1 All gastrointestinal symptoms.
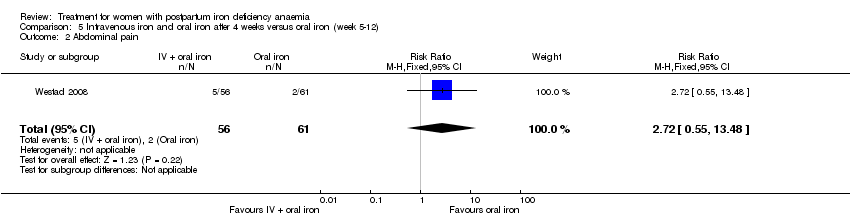
Comparison 5 Intravenous iron and oral iron after 4 weeks versus oral iron (week 5‐12), Outcome 2 Abdominal pain.

Comparison 5 Intravenous iron and oral iron after 4 weeks versus oral iron (week 5‐12), Outcome 3 Constipation.

Comparison 5 Intravenous iron and oral iron after 4 weeks versus oral iron (week 5‐12), Outcome 4 Diarrhoea.
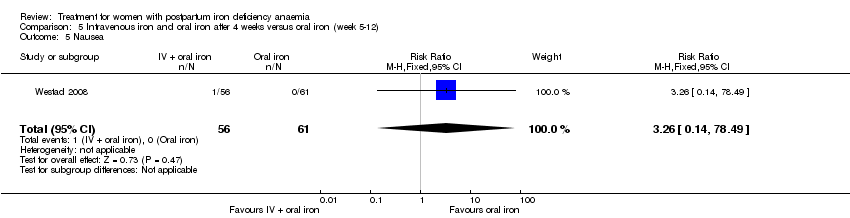
Comparison 5 Intravenous iron and oral iron after 4 weeks versus oral iron (week 5‐12), Outcome 5 Nausea.

Comparison 5 Intravenous iron and oral iron after 4 weeks versus oral iron (week 5‐12), Outcome 6 Dysgeusia.

Comparison 5 Intravenous iron and oral iron after 4 weeks versus oral iron (week 5‐12), Outcome 7 Flatulence.

Comparison 5 Intravenous iron and oral iron after 4 weeks versus oral iron (week 5‐12), Outcome 8 Melaena.
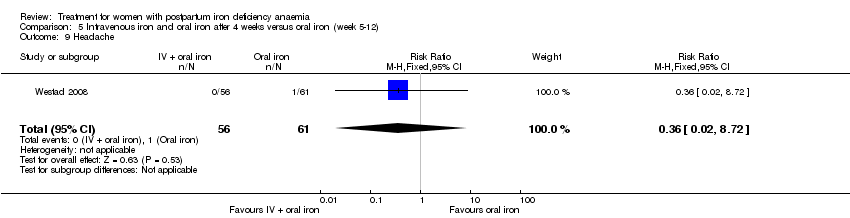
Comparison 5 Intravenous iron and oral iron after 4 weeks versus oral iron (week 5‐12), Outcome 9 Headache.

Comparison 6 Intravenous iron and oral iron versus oral iron, Outcome 1 Persistent anaemia symptoms on a VAS scale: 1 week.

Comparison 6 Intravenous iron and oral iron versus oral iron, Outcome 2 Persistent anaemia symptoms on a VAS scale: 2 week.
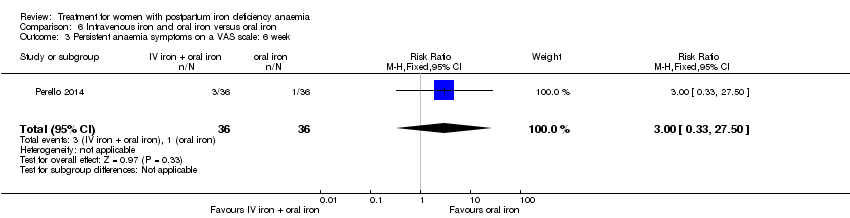
Comparison 6 Intravenous iron and oral iron versus oral iron, Outcome 3 Persistent anaemia symptoms on a VAS scale: 6 week.
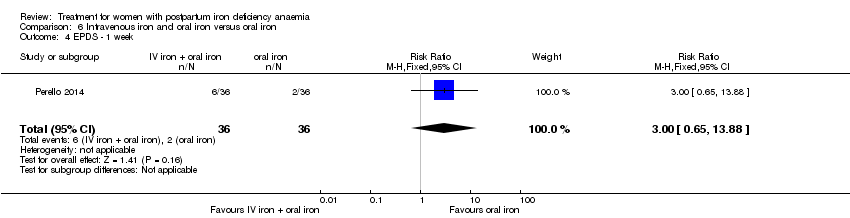
Comparison 6 Intravenous iron and oral iron versus oral iron, Outcome 4 EPDS ‐ 1 week.

Comparison 6 Intravenous iron and oral iron versus oral iron, Outcome 5 Length of hospital stay.
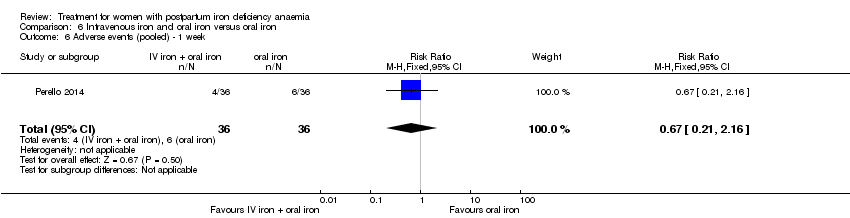
Comparison 6 Intravenous iron and oral iron versus oral iron, Outcome 6 Adverse events (pooled) ‐ 1 week.
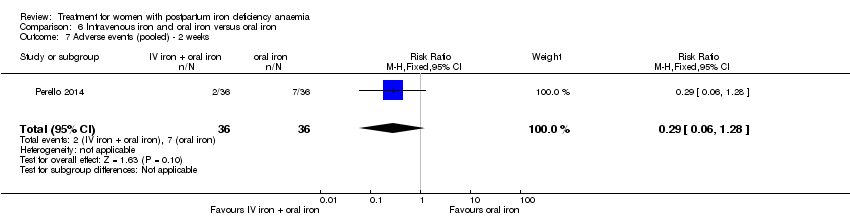
Comparison 6 Intravenous iron and oral iron versus oral iron, Outcome 7 Adverse events (pooled) ‐ 2 weeks.
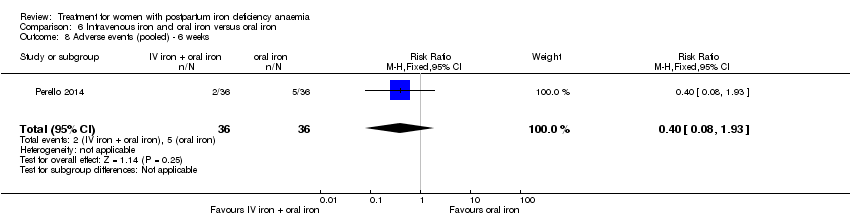
Comparison 6 Intravenous iron and oral iron versus oral iron, Outcome 8 Adverse events (pooled) ‐ 6 weeks.

Comparison 6 Intravenous iron and oral iron versus oral iron, Outcome 9 Red blood cell transfusion.

Comparison 6 Intravenous iron and oral iron versus oral iron, Outcome 10 Anaphylaxis or evidence of hypersensitivity.

Comparison 7 Erythropoietin (regardless of route) and intravenous iron versus intravenous iron, Outcome 1 Postpartum depression.
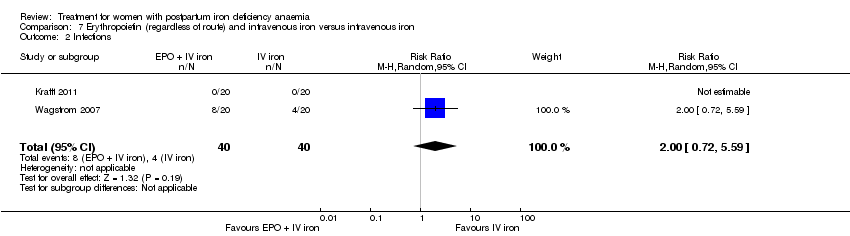
Comparison 7 Erythropoietin (regardless of route) and intravenous iron versus intravenous iron, Outcome 2 Infections.
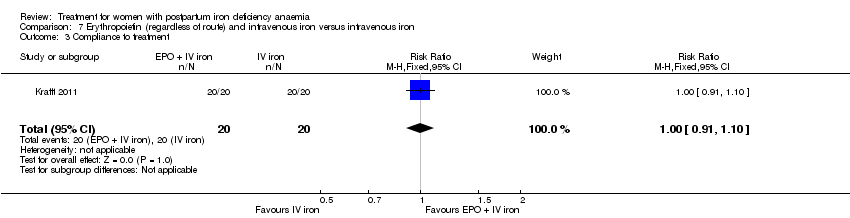
Comparison 7 Erythropoietin (regardless of route) and intravenous iron versus intravenous iron, Outcome 3 Compliance to treatment.

Comparison 7 Erythropoietin (regardless of route) and intravenous iron versus intravenous iron, Outcome 4 Breasfeeding.

Comparison 7 Erythropoietin (regardless of route) and intravenous iron versus intravenous iron, Outcome 5 Dysgeusia.
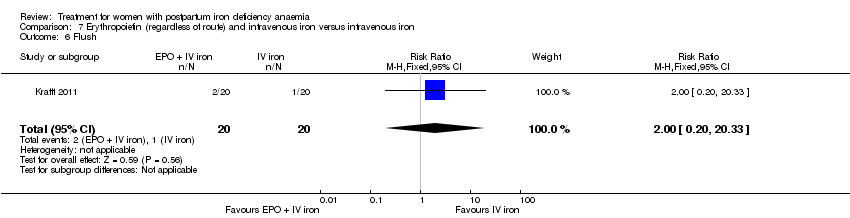
Comparison 7 Erythropoietin (regardless of route) and intravenous iron versus intravenous iron, Outcome 6 Flush.
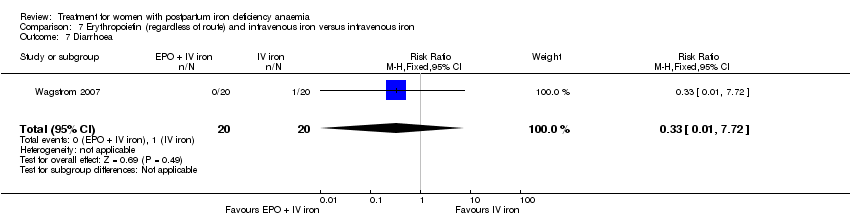
Comparison 7 Erythropoietin (regardless of route) and intravenous iron versus intravenous iron, Outcome 7 Diarrhoea.

Comparison 7 Erythropoietin (regardless of route) and intravenous iron versus intravenous iron, Outcome 8 Headache.

Comparison 7 Erythropoietin (regardless of route) and intravenous iron versus intravenous iron, Outcome 9 Itching (including elevated liver enzymes).

Comparison 7 Erythropoietin (regardless of route) and intravenous iron versus intravenous iron, Outcome 10 Dizziness.
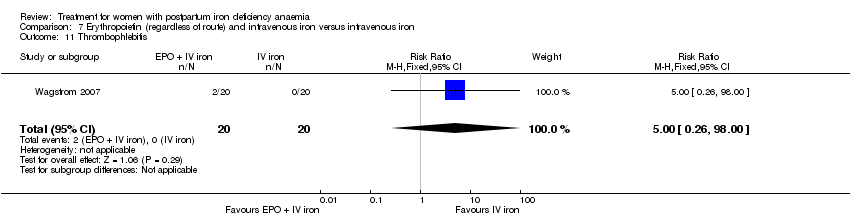
Comparison 7 Erythropoietin (regardless of route) and intravenous iron versus intravenous iron, Outcome 11 Thrombophlebitis.

Comparison 7 Erythropoietin (regardless of route) and intravenous iron versus intravenous iron, Outcome 12 Red blood cell transfusion.
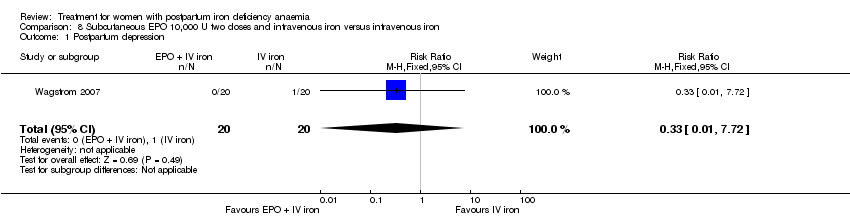
Comparison 8 Subcutaneous EPO 10,000 U two doses and intravenous iron versus intravenous iron, Outcome 1 Postpartum depression.
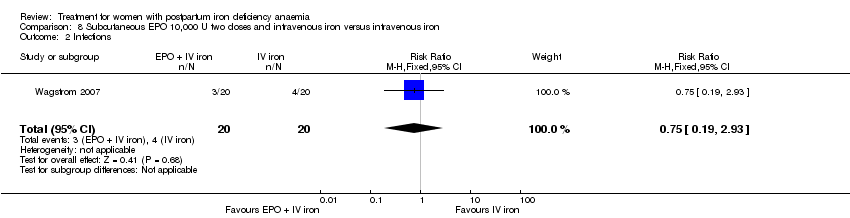
Comparison 8 Subcutaneous EPO 10,000 U two doses and intravenous iron versus intravenous iron, Outcome 2 Infections.
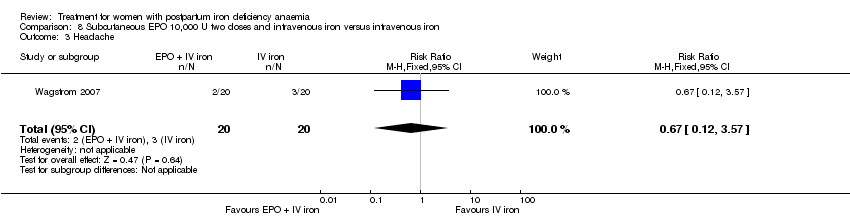
Comparison 8 Subcutaneous EPO 10,000 U two doses and intravenous iron versus intravenous iron, Outcome 3 Headache.

Comparison 8 Subcutaneous EPO 10,000 U two doses and intravenous iron versus intravenous iron, Outcome 4 Low blood pressure.

Comparison 8 Subcutaneous EPO 10,000 U two doses and intravenous iron versus intravenous iron, Outcome 5 Diarrhoea.

Comparison 8 Subcutaneous EPO 10,000 U two doses and intravenous iron versus intravenous iron, Outcome 6 Dizziness.
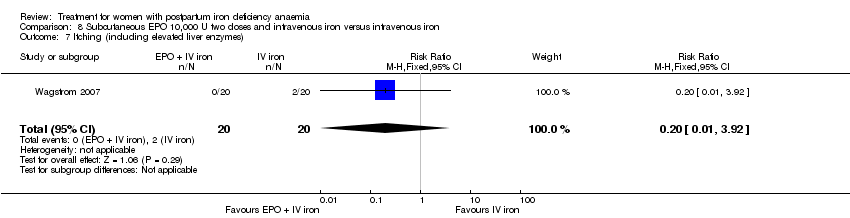
Comparison 8 Subcutaneous EPO 10,000 U two doses and intravenous iron versus intravenous iron, Outcome 7 Itching (including elevated liver enzymes).

Comparison 8 Subcutaneous EPO 10,000 U two doses and intravenous iron versus intravenous iron, Outcome 8 Red blood cell transfusion.

Comparison 9 Intravenous EPO, intravenous iron and oral iron versus intravenous iron and oral iron, Outcome 1 Leg paraesthesia.
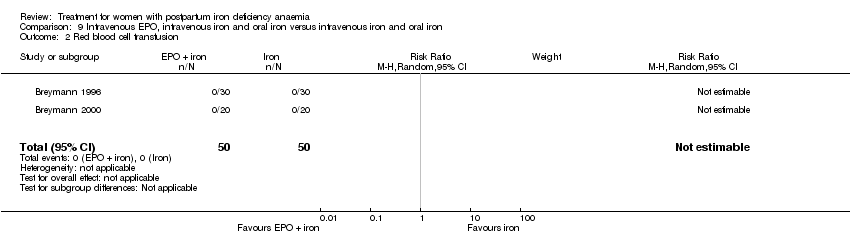
Comparison 9 Intravenous EPO, intravenous iron and oral iron versus intravenous iron and oral iron, Outcome 2 Red blood cell transfusion.

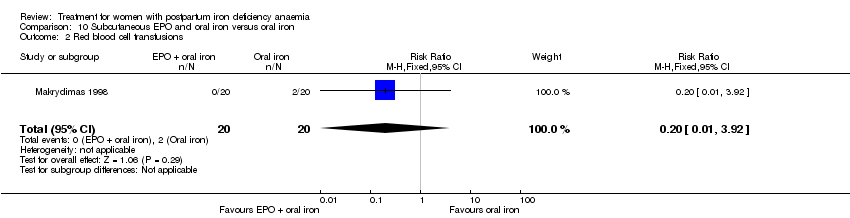
Comparison 10 Subcutaneous EPO and oral iron versus oral iron, Outcome 1 Breastfeeding.
Comparison 10 Subcutaneous EPO and oral iron versus oral iron, Outcome 2 Red blood cell transfusions.
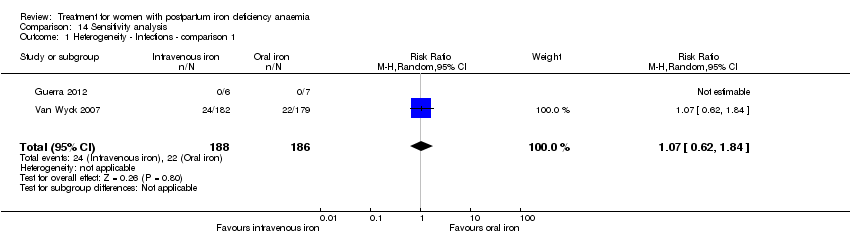
Comparison 14 Sensitivity analysis, Outcome 1 Heterogeneity ‐ Infections ‐ comparison 1.

Comparison 14 Sensitivity analysis, Outcome 2 Heterogeneity, fixed effect ‐ Infections ‐ comparison 1.
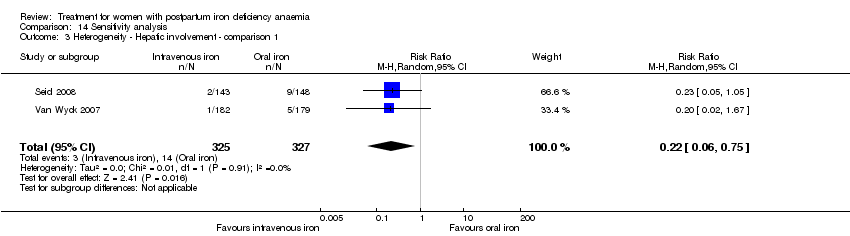
Comparison 14 Sensitivity analysis, Outcome 3 Heterogeneity ‐ Hepatic involvement ‐ comparison 1.

Comparison 14 Sensitivity analysis, Outcome 4 Heterogeneity, fixed effect ‐ Hepatic involvement ‐ comparison 1.
| Intravenous iron compared with oral iron for women with postpartum iron deficiency anaemia | ||||||
| Patient or population: women with postpartum iron deficiency anaemia | ||||||
| Outcomes | Illustrative comparative risks* (95% CI) | Relative effect | No of Participants | Quality of the evidence | Comments | |
| Assumed risk | Corresponding risk | |||||
| Oral iron | Intravenous iron | |||||
| Maternal mortality | Study population | RR 2.95 | 374 | ⊕⊕⊝⊝ | 1 maternal death was reported across the included studies. | |
| 0 per 1000 | 0 per 1000 | |||||
| Moderate | ||||||
| 0 per 1000 | 0 per 1000 | |||||
| Fatigue at 14, 28, and 42 days | See comment | See comment | Not estimable | 361 | ⊕⊝⊝⊝ | No statistically significant difference was found at days 14 and 42 days. |
| Persistent anaemia symptoms ‐ not reported | See comment | See comment | Not estimable | ‐ | See comment | Not reported. |
| Infections | Study population | RR 1.7 | 718 | ⊕⊝⊝⊝ | ||
| 86 per 1000 | 146 per 1000 | |||||
| Moderate | ||||||
| 34 per 1000 | 58 per 1000 | |||||
| Constipation | Study population | RR 0.21 | 1217 | ⊕⊝⊝⊝ | ||
| 114 per 1000 | 24 per 1000 | |||||
| Moderate | ||||||
| 112 per 1000 | 24 per 1000 | |||||
| All gastrointestinal symptoms | Study population | RR 0.31 | 1307 | ⊕⊝⊝⊝ | ||
| 216 per 1000 | 67 per 1000 | |||||
| Moderate | ||||||
| 261 per 1000 | 81 per 1000 | |||||
| Anaphylaxis or evidence of hypersensitivity | Study population | RR 2.78 | 1454 | ⊕⊕⊝⊝ | 3 cases of allergic reactions all occurred in the group treated with intravenous iron. | |
| 0 per 1000 | 0 per 1000 | |||||
| Moderate | ||||||
| 0 per 1000 | 0 per 1000 | |||||
| *The basis for the assumed risk (e.g. the median control group risk across studies) is provided in footnotes. The corresponding risk (and its 95% confidence interval) is based on the assumed risk in the comparison group and the relative effect of the intervention (and its 95% CI). | ||||||
| GRADE Working Group grades of evidence | ||||||
| 1 The outcome is unlikely to be influenced by risk of bias and so we did not downgrade the evidence for this outcome: open‐label design combined with a objective outcome measure. | ||||||
| Red blood cell transfusion compared with non‐transfusion for postpartum iron deficiency anaemia | ||||||
| Patient or population: patients with postpartum iron deficiency anaemia | ||||||
| Outcomes | Illustrative comparative risks* (95% CI) | Relative effect | No of Participants | Quality of the evidence | Comments | |
| Assumed risk | Corresponding risk | |||||
| Non‐transfusion | RBC transfusion | |||||
| Maternal mortality ‐ not reported | See comment | See comment | Not estimable | ‐ | See comment | Not reported. |
| Fatigue | See comment | See comment | 519 | ⊕⊕⊝⊝ | General fatigue at 3 days was 0.8 lower (1.53 to 0.07) in the transfused group. No statistically significant difference was seen at six weeks. | |
| Persistent anaemia symptoms | Study population | Not estimable | 519 | ⊕⊝⊝⊝ | The outcome was not systematically registered/reported. | |
| See comment | See comment | |||||
| Moderate | ||||||
| Infections | Study population | RR 0.93 | 519 | ⊕⊕⊕⊝ | ||
| 92 per 1000 | 86 per 1000 | |||||
| Moderate | ||||||
| 92 per 1000 | 86 per 1000 | |||||
| Erythrocyte alloantibody formation | Study population | RR 3.03 | 519 | ⊕⊝⊝⊝ | There was no systematical screening for this outcome in the study population. | |
| 0 per 1000 | 0 per 1000 | |||||
| Moderate | ||||||
| 0 per 1000 | 0 per 1000 | |||||
| Thromboembolic events | Study population | RR 1.01 | 519 | ⊕⊕⊝⊝ | ||
| 8 per 1000 | 8 per 1000 | |||||
| Moderate | ||||||
| 8 per 1000 | 8 per 1000 | |||||
| Transfusion reactions | Study population | RR 7.08 | 519 | ⊕⊝⊝⊝ | 3 cases of transfusion reactions occurred in the transfusion group. | |
| 0 per 1000 | 0 per 1000 | |||||
| Moderate | ||||||
| 0 per 1000 | 0 per 1000 | |||||
| *The basis for the assumed risk (e.g. the median control group risk across studies) is provided in footnotes. The corresponding risk (and its 95% confidence interval) is based on the assumed risk in the comparison group and the relative effect of the intervention (and its 95% CI). | ||||||
| GRADE Working Group grades of evidence | ||||||
| 1 Downgraded two levels due to risk of bias: open‐label design combined with a subjective outcome measure. | ||||||
| Oral iron compared with placebo for women with postpartum iron deficiency anaemia | ||||||
| Patient or population: women with postpartum iron deficiency anaemia | ||||||
| Outcomes | Illustrative comparative risks* (95% CI) | Relative effect | No of Participants | Quality of the evidence | Comments | |
| Assumed risk | Corresponding risk | |||||
| Placebo | Oral iron | |||||
| Maternal mortality ‐ not reported | See comment | See comment | Not estimable | ‐ | See comment | Not reported. |
| Fatigue ‐ not reported | See comment | See comment | Not estimable | ‐ | See comment | Not reported. |
| Persistent anaemia symptoms | Study population | Not estimable | (1) | See comment | Symptoms of anaemia were not reported for the anaemic groups separately. | |
| See comment | See comment | |||||
| Moderate | ||||||
| All gastrointestinal symptoms | Study population | RR 1 | 68 | ⊕⊝⊝⊝ | ||
| 176 per 1000 | 176 per 1000 | |||||
| Moderate | ||||||
| 177 per 1000 | 177 per 1000 | |||||
| Constipation ‐ not reported | See comment | See comment | Not estimable | ‐ | See comment | Not reported. |
| *The basis for the assumed risk (e.g. the median control group risk across studies) is provided in footnotes. The corresponding risk (and its 95% confidence interval) is based on the assumed risk in the comparison group and the relative effect of the intervention (and its 95% CI). | ||||||
| GRADE Working Group grades of evidence | ||||||
| 1 Downgraded two levels due to risk of bias: open‐label design combined with a subjective outcome measure. | ||||||
| Intravenous iron with oral iron compared with oral iron for women with postpartum iron deficiency anaemia | ||||||
| Patient or population: women with postpartum iron deficiency anaemia | ||||||
| Outcomes | Illustrative comparative risks* (95% CI) | Relative effect | No of Participants | Quality of the evidence | Comments | |
| Assumed risk | Corresponding risk | |||||
| Oral iron | Intravenous iron with oral iron | |||||
| Maternal mortality | See comment | See comment | Not estimable | ‐ | See comment | In 1 study no maternal deaths were reported. The other study did not report on maternal mortality. |
| Fatigue ‐ not reported | See comment | See comment | Not estimable | ‐ | See comment | Not reported. |
| Persistent anaemia symptoms ‐ 1 week | Study population | RR 1.75 | 72 | ⊕⊝⊝⊝ | ||
| 111 per 1000 | 194 per 1000 | |||||
| Moderate | ||||||
| 111 per 1000 | 194 per 1000 | |||||
| Persistent anaemia symptoms ‐ 2 weeks | Study population | RR 0.6 | 72 | ⊕⊝⊝⊝ | ||
| 139 per 1000 | 83 per 1000 | |||||
| Moderate | ||||||
| 139 per 1000 | 83 per 1000 | |||||
| Persistent anaemia symptoms ‐ 6 weeks | Study population | RR 3 | 72 | ⊕⊝⊝⊝ | ||
| 28 per 1000 | 83 per 1000 | |||||
| Moderate | ||||||
| 28 per 1000 | 84 per 1000 | |||||
| Infections ‐ not reported | See comment | See comment | Not estimable | ‐ | See comment | Not reported. |
| Anaphylaxis or evidence of hypersensitivity | Study population | Not estimable | 0 | ⊕⊕⊝⊝ | 1 study reported 0 events, other study pooled adverse events, not reporting allergic reactions separately. Thus the effect was not estimable. | |
| See comment | See comment | |||||
| Moderate | ||||||
| *The basis for the assumed risk (e.g. the median control group risk across studies) is provided in footnotes. The corresponding risk (and its 95% confidence interval) is based on the assumed risk in the comparison group and the relative effect of the intervention (and its 95% CI). | ||||||
| GRADE Working Group grades of evidence | ||||||
| 1 Downgraded two levels due to risk of bias: the included study had high risk of attrition and reporting bias. | ||||||
| Erythropoietin (regardless of rout) with intravenous iron compared with intravenous iron for women with postpartum iron deficiency anaemia | ||||||
| Patient or population: women with postpartum iron deficiency anaemia | ||||||
| Outcomes | Illustrative comparative risks* (95% CI) | Relative effect | No of Participants | Quality of the evidence | Comments | |
| Assumed risk | Corresponding risk | |||||
| Intravenous iron | EPO (regardless of rout) with IV iron | |||||
| Maternal mortality | See comment | See comment | Not estimable | ‐ | See comment | In 1 study no maternal deaths were reported. The other study did not report on maternal mortality. |
| Fatigue ‐ not reported | See comment | See comment | Not estimable | ‐ | See comment | Not reported. |
| Thromboembolic events ‐ not reported | See comment | See comment | Not estimable | ‐ | See comment | Not reported. |
| Persistent anaemia symptoms ‐ not reported | See comment | See comment | Not estimable | ‐ | See comment | Not reported. |
| *The basis for the assumed risk (e.g. the median control group risk across studies) is provided in footnotes. The corresponding risk (and its 95% confidence interval) is based on the assumed risk in the comparison group and the relative effect of the intervention (and its 95% CI). | ||||||
| GRADE Working Group grades of evidence | ||||||
| Subcutaneous EPO 10,000 U of doses with intravenous iron compared with intravenous iron for women with postpartum iron deficiency anaemia | ||||||
| Patient or population: patients with women with postpartum iron deficiency anaemia | ||||||
| Outcomes | Illustrative comparative risks* (95% CI) | Relative effect | No of Participants | Quality of the evidence | Comments | |
| Assumed risk | Corresponding risk | |||||
| Intravenous iron | Erythropoietin 10,000 U 2 doses with intravenous iron | |||||
| Maternal mortality ‐ not reported | See comment | See comment | Not estimable | ‐ | See comment | Not reported. |
| Fatigue ‐ not reported | See comment | See comment | Not estimable | ‐ | See comment | Not reported. |
| Persistent anaemia symptoms ‐ not reported | See comment | See comment | Not estimable | ‐ | See comment | Not reported. |
| Thromboembolic events ‐ not reported | See comment | See comment | Not estimable | ‐ | See comment | Not reported. |
| *The basis for the assumed risk (e.g. the median control group risk across studies) is provided in footnotes. The corresponding risk (and its 95% confidence interval) is based on the assumed risk in the comparison group and the relative effect of the intervention (and its 95% CI). | ||||||
| GRADE Working Group grades of evidence | ||||||
| Subcutaneous EPO with oral iron compared with oral iron for women with postpartum iron deficiency anaemia | ||||||
| Patient or population: women with postpartum iron deficiency anaemia | ||||||
| Outcomes | Illustrative comparative risks* (95% CI) | Relative effect | No of Participants | Quality of the evidence | Comments | |
| Assumed risk | Corresponding risk | |||||
| Oral iron | Subcutaneous EPO with oral iron | |||||
| Maternal mortality | See comment | See comment | Not estimable | 40 | See comment | No maternal deaths were reported. |
| Fatigue ‐ not reported | See comment | See comment | Not estimable | ‐ | See comment | Not reported. |
| Persistent anaemia symptoms ‐ not reported | See comment | See comment | Not estimable | ‐ | See comment | Not reported. |
| Thromboembolic events ‐ not reported | See comment | See comment | Not estimable | ‐ | See comment | Not reported. |
| *The basis for the assumed risk (e.g. the median control group risk across studies) is provided in footnotes. The corresponding risk (and its 95% confidence interval) is based on the assumed risk in the comparison group and the relative effect of the intervention (and its 95% CI). | ||||||
| GRADE Working Group grades of evidence | ||||||
| Subcutaneous EPO with IV iron and oral iron compared with intravenous iron with oral iron for women with postpartum iron deficiency anaemia | ||||||
| Patient or population: women with postpartum iron deficiency anaemia | ||||||
| Outcomes | Illustrative comparative risks* (95% CI) | Relative effect | No of Participants | Quality of the evidence | Comments | |
| Assumed risk | Corresponding risk | |||||
| Intravenous iron + oral iron | Subcutaneous EPO + IV iron + oral iron | |||||
| Maternal mortality ‐ not reported | See comment | See comment | Not estimable | ‐ | See comment | Not reported. |
| Fatigue ‐ not reported | See comment | See comment | Not estimable | ‐ | See comment | Not reported. |
| Persistent anaemia symptoms ‐ not reported | See comment | See comment | Not estimable | ‐ | See comment | Not reported. |
| Thromboembolic events ‐ not reported | See comment | See comment | Not estimable | ‐ | See comment | Not reported. |
| *The basis for the assumed risk (e.g. the median control group risk across studies) is provided in footnotes. The corresponding risk (and its 95% confidence interval) is based on the assumed risk in the comparison group and the relative effect of the intervention (and its 95% CI). | ||||||
| GRADE Working Group grades of evidence | ||||||
| Outcome or subgroup title | No. of studies | No. of participants | Statistical method | Effect size |
| 1 Maternal mortality Show forest plot | 2 | 374 | Risk Ratio (M‐H, Random, 95% CI) | 2.95 [0.12, 71.96] |
| 2 Fatigue ‐ 14 days Show forest plot | 1 | 322 | Mean Difference (IV, Fixed, 95% CI) | ‐3.30 [‐8.04, 1.44] |
| 3 Fatigue ‐ 42 days Show forest plot | 1 | 329 | Mean Difference (IV, Fixed, 95% CI) | ‐2.10 [‐6.77, 2.57] |
| 4 SF‐36: Physical F(x) ‐ 14 days Show forest plot | 1 | 320 | Mean Difference (IV, Fixed, 95% CI) | 0.90 [‐3.84, 5.64] |
| 5 SF‐36: Physical role ‐ 14 days Show forest plot | 1 | 321 | Mean Difference (IV, Fixed, 95% CI) | 3.50 [‐2.03, 9.03] |
| 6 SF‐36: Bodily pain ‐ day 14 Show forest plot | 1 | 321 | Mean Difference (IV, Fixed, 95% CI) | ‐0.70 [‐6.00, 4.60] |
| 7 SF‐36: General health ‐ 14 days Show forest plot | 1 | 321 | Mean Difference (IV, Fixed, 95% CI) | 0.70 [‐3.09, 4.49] |
| 8 SF‐36: Vitality ‐ 14 days Show forest plot | 1 | 321 | Mean Difference (IV, Fixed, 95% CI) | 0.90 [‐3.64, 5.44] |
| 9 SF‐36: Emotional role ‐ 14 days Show forest plot | 1 | 321 | Mean Difference (IV, Fixed, 95% CI) | 1.10 [‐4.06, 6.26] |
| 10 SF‐36: Social function ‐ 14 days Show forest plot | 1 | 321 | Mean Difference (IV, Fixed, 95% CI) | 1.0 [‐4.08, 6.08] |
| 11 SF‐36: Mental health ‐ 14 days Show forest plot | 1 | 321 | Mean Difference (IV, Fixed, 95% CI) | ‐1.20 [‐4.84, 2.44] |
| 12 Depression Show forest plot | 1 | 361 | Risk Ratio (M‐H, Fixed, 95% CI) | 0.33 [0.01, 8.00] |
| 13 Infections Show forest plot | 3 | 718 | Risk Ratio (M‐H, Random, 95% CI) | 1.70 [0.58, 5.03] |
| 14 Compliance to treatment Show forest plot | 5 | 890 | Risk Ratio (M‐H, Random, 95% CI) | 1.17 [1.01, 1.35] |
| 15 All gastrointestinal symptoms Show forest plot | 8 | 1307 | Risk Ratio (M‐H, Random, 95% CI) | 0.31 [0.20, 0.47] |
| 16 Constipation Show forest plot | 6 | 1217 | Risk Ratio (M‐H, Random, 95% CI) | 0.21 [0.11, 0.39] |
| 17 Nausea Show forest plot | 4 | 745 | Risk Ratio (M‐H, Random, 95% CI) | 0.30 [0.11, 0.81] |
| 18 Gastrointestinal pain Show forest plot | 4 | 543 | Risk Ratio (M‐H, Random, 95% CI) | 0.18 [0.04, 0.83] |
| 19 Diarrhoea Show forest plot | 3 | 569 | Risk Ratio (M‐H, Random, 95% CI) | 0.11 [0.02, 0.59] |
| 20 Vomiting Show forest plot | 1 | 128 | Risk Ratio (M‐H, Fixed, 95% CI) | 0.40 [0.02, 9.66] |
| 21 Dyspepsia Show forest plot | 2 | 93 | Risk Ratio (M‐H, Random, 95% CI) | 0.36 [0.04, 3.20] |
| 22 Dysgeusia Show forest plot | 4 | 543 | Risk Ratio (M‐H, Random, 95% CI) | 7.20 [1.63, 31.76] |
| 23 Headache Show forest plot | 4 | 1124 | Risk Ratio (M‐H, Random, 95% CI) | 1.93 [0.87, 4.29] |
| 24 Hepatic involvement Show forest plot | 3 | 996 | Risk Ratio (M‐H, Random, 95% CI) | 0.45 [0.12, 1.71] |
| 25 Injection site discomfort Show forest plot | 4 | 702 | Risk Ratio (M‐H, Random, 95% CI) | 4.72 [1.03, 21.54] |
| 26 Skin rash Show forest plot | 2 | 489 | Risk Ratio (M‐H, Random, 95% CI) | 2.34 [0.79, 6.97] |
| 27 Urticaria Show forest plot | 1 | 291 | Risk Ratio (M‐H, Fixed, 95% CI) | 4.14 [0.47, 36.59] |
| 28 Flush Show forest plot | 2 | 124 | Risk Ratio (M‐H, Random, 95% CI) | 9.00 [1.18, 68.81] |
| 29 Muscle cramp Show forest plot | 2 | 371 | Risk Ratio (M‐H, Random, 95% CI) | 6.05 [0.74, 49.68] |
| 30 Pain (not specified) Show forest plot | 1 | 128 | Risk Ratio (M‐H, Fixed, 95% CI) | 8.42 [0.44, 159.82] |
| 31 Seriouse adverse events (not specified) Show forest plot | 1 | 291 | Risk Ratio (M‐H, Fixed, 95% CI) | 1.03 [0.26, 4.06] |
| 32 Anaphylaxis or evidence of hypersensitivity Show forest plot | 8 | 1454 | Risk Ratio (M‐H, Random, 95% CI) | 2.78 [0.31, 24.92] |
| 33 Arythmia Show forest plot | 1 | 90 | Risk Ratio (M‐H, Fixed, 95% CI) | 4.26 [0.18, 101.86] |
| 34 Red blood cell transfusion Show forest plot | 4 | 606 | Risk Ratio (M‐H, Random, 95% CI) | 0.48 [0.19, 1.23] |
| Outcome or subgroup title | No. of studies | No. of participants | Statistical method | Effect size |
| 1 General fatigue ‐ 3 days Show forest plot | 1 | 388 | Mean Difference (IV, Fixed, 95% CI) | ‐0.80 [‐1.53, ‐0.07] |
| 2 General fatigue ‐ 6 weeks Show forest plot | 1 | 318 | Mean Difference (IV, Fixed, 95% CI) | ‐0.25 [‐1.22, 0.72] |
| 3 SF‐36: Physical functioning ‐ 1 week Show forest plot | 1 | 368 | Mean Difference (IV, Fixed, 95% CI) | 5.67 [0.84, 10.50] |
| 4 SF‐36: Social function ‐ 1 week Show forest plot | 1 | 369 | Mean Difference (IV, Fixed, 95% CI) | 5.34 [0.11, 10.57] |
| 5 SF‐36: Physical role ‐ 1 week Show forest plot | 1 | 366 | Mean Difference (IV, Fixed, 95% CI) | 4.56 [‐1.41, 10.53] |
| 6 SF‐36: Bodily pain ‐ 1 week Show forest plot | 1 | 368 | Mean Difference (IV, Fixed, 95% CI) | ‐2.0 [‐5.90, 1.90] |
| 7 SF‐36: General health ‐ 1 week Show forest plot | 1 | 369 | Mean Difference (IV, Fixed, 95% CI) | 2.18 [‐1.47, 5.83] |
| 8 SF‐36: Vitality ‐ 1 week Show forest plot | 1 | 369 | Mean Difference (IV, Fixed, 95% CI) | 1.88 [‐2.01, 5.77] |
| 9 SF‐36: Emotional role ‐ 1 week Show forest plot | 1 | 368 | Mean Difference (IV, Fixed, 95% CI) | 4.37 [‐4.51, 13.25] |
| 10 SF‐36: Mental health ‐ 1 week Show forest plot | 1 | 369 | Mean Difference (IV, Fixed, 95% CI) | 1.21 [‐2.29, 4.71] |
| 11 Infections Show forest plot | 1 | 519 | Risk Ratio (M‐H, Fixed, 95% CI) | 0.93 [0.53, 1.61] |
| 12 Compliance to treatment Show forest plot | 1 | 519 | Risk Ratio (M‐H, Fixed, 95% CI) | 1.11 [1.06, 1.17] |
| 13 Breastfeeding at six weeks Show forest plot | 1 | 297 | Risk Ratio (M‐H, Fixed, 95% CI) | 0.91 [0.78, 1.07] |
| 14 Erythrocyte alloantibody formation Show forest plot | 1 | 519 | Risk Ratio (M‐H, Fixed, 95% CI) | 3.03 [0.12, 74.15] |
| 15 Rash Show forest plot | 1 | 519 | Risk Ratio (M‐H, Fixed, 95% CI) | 3.03 [0.12, 74.15] |
| 16 Fever Show forest plot | 1 | 519 | Risk Ratio (M‐H, Fixed, 95% CI) | 5.06 [0.24, 104.84] |
| 17 Thromboembolic events Show forest plot | 1 | 519 | Risk Ratio (M‐H, Fixed, 95% CI) | 1.01 [0.14, 7.13] |
| 18 Parenteral iron intolerance Show forest plot | 1 | 519 | Risk Ratio (M‐H, Fixed, 95% CI) | 0.34 [0.01, 8.24] |
| 19 Transfusion reactions Show forest plot | 1 | 519 | Risk Ratio (M‐H, Fixed, 95% CI) | 7.08 [0.37, 136.41] |
| Outcome or subgroup title | No. of studies | No. of participants | Statistical method | Effect size |
| 1 Digit Symbol Substitution test ‐ 10 weeks Show forest plot | 1 | 51 | Mean Difference (IV, Fixed, 95% CI) | 0.0 [‐2.76, 2.76] |
| 2 EPDS ‐ 10 weeks Show forest plot | 1 | 51 | Mean Difference (IV, Fixed, 95% CI) | 0.10 [‐0.86, 1.06] |
| 3 STAI ‐ 10 weeks Show forest plot | 1 | 51 | Mean Difference (IV, Fixed, 95% CI) | ‐0.40 [‐3.18, 2.38] |
| 4 Percieved Stress ‐ 10 weeks Show forest plot | 1 | 51 | Mean Difference (IV, Fixed, 95% CI) | 4.1 [1.70, 6.50] |
| 5 Breastfeeding at two days postpartum Show forest plot | 1 | 122 | Risk Ratio (M‐H, Fixed, 95% CI) | 0.82 [0.58, 1.17] |
| 6 Back pain Show forest plot | 1 | 150 | Risk Ratio (M‐H, Fixed, 95% CI) | 0.66 [0.42, 1.03] |
| 7 All gastrointestinal symptoms Show forest plot | 1 | 68 | Risk Ratio (M‐H, Fixed, 95% CI) | 1.0 [0.36, 2.79] |
| Outcome or subgroup title | No. of studies | No. of participants | Statistical method | Effect size |
| 1 All gastrointestinal symptoms Show forest plot | 1 | 67 | Risk Ratio (M‐H, Fixed, 95% CI) | 2.75 [1.23, 6.16] |
| Outcome or subgroup title | No. of studies | No. of participants | Statistical method | Effect size |
| 1 All gastrointestinal symptoms Show forest plot | 1 | 117 | Risk Ratio (M‐H, Fixed, 95% CI) | 1.43 [0.83, 2.45] |
| 2 Abdominal pain Show forest plot | 1 | 117 | Risk Ratio (M‐H, Fixed, 95% CI) | 2.72 [0.55, 13.48] |
| 3 Constipation Show forest plot | 1 | 117 | Risk Ratio (M‐H, Fixed, 95% CI) | 1.20 [0.55, 2.60] |
| 4 Diarrhoea Show forest plot | 1 | 117 | Risk Ratio (M‐H, Fixed, 95% CI) | 3.27 [0.35, 30.51] |
| 5 Nausea Show forest plot | 1 | 117 | Risk Ratio (M‐H, Fixed, 95% CI) | 3.26 [0.14, 78.49] |
| 6 Dysgeusia Show forest plot | 1 | 117 | Risk Ratio (M‐H, Fixed, 95% CI) | 3.26 [0.14, 78.49] |
| 7 Flatulence Show forest plot | 1 | 117 | Risk Ratio (M‐H, Fixed, 95% CI) | 0.36 [0.02, 8.72] |
| 8 Melaena Show forest plot | 1 | 117 | Risk Ratio (M‐H, Fixed, 95% CI) | 0.36 [0.02, 8.72] |
| 9 Headache Show forest plot | 1 | 117 | Risk Ratio (M‐H, Fixed, 95% CI) | 0.36 [0.02, 8.72] |
| Outcome or subgroup title | No. of studies | No. of participants | Statistical method | Effect size |
| 1 Persistent anaemia symptoms on a VAS scale: 1 week Show forest plot | 1 | 72 | Risk Ratio (M‐H, Fixed, 95% CI) | 1.75 [0.56, 5.46] |
| 2 Persistent anaemia symptoms on a VAS scale: 2 week Show forest plot | 1 | 72 | Risk Ratio (M‐H, Fixed, 95% CI) | 0.6 [0.15, 2.33] |
| 3 Persistent anaemia symptoms on a VAS scale: 6 week Show forest plot | 1 | 72 | Risk Ratio (M‐H, Fixed, 95% CI) | 3.0 [0.33, 27.50] |
| 4 EPDS ‐ 1 week Show forest plot | 1 | 72 | Risk Ratio (M‐H, Fixed, 95% CI) | 3.0 [0.65, 13.88] |
| 5 Length of hospital stay Show forest plot | 1 | 72 | Mean Difference (IV, Fixed, 95% CI) | ‐0.30 [‐1.02, 0.42] |
| 6 Adverse events (pooled) ‐ 1 week Show forest plot | 1 | 72 | Risk Ratio (M‐H, Fixed, 95% CI) | 0.67 [0.21, 2.16] |
| 7 Adverse events (pooled) ‐ 2 weeks Show forest plot | 1 | 72 | Risk Ratio (M‐H, Fixed, 95% CI) | 0.29 [0.06, 1.28] |
| 8 Adverse events (pooled) ‐ 6 weeks Show forest plot | 1 | 72 | Risk Ratio (M‐H, Fixed, 95% CI) | 0.4 [0.08, 1.93] |
| 9 Red blood cell transfusion Show forest plot | 2 | 112 | Risk Ratio (M‐H, Random, 95% CI) | 1.0 [0.15, 6.72] |
| 10 Anaphylaxis or evidence of hypersensitivity Show forest plot | 1 | 40 | Risk Ratio (M‐H, Fixed, 95% CI) | 0.0 [0.0, 0.0] |
| Outcome or subgroup title | No. of studies | No. of participants | Statistical method | Effect size |
| 1 Postpartum depression Show forest plot | 1 | 40 | Risk Ratio (M‐H, Fixed, 95% CI) | 0.33 [0.01, 7.72] |
| 2 Infections Show forest plot | 2 | 80 | Risk Ratio (M‐H, Random, 95% CI) | 2.0 [0.72, 5.59] |
| 3 Compliance to treatment Show forest plot | 1 | 40 | Risk Ratio (M‐H, Fixed, 95% CI) | 1.0 [0.91, 1.10] |
| 4 Breasfeeding Show forest plot | 1 | 40 | Risk Ratio (M‐H, Fixed, 95% CI) | 1.0 [0.91, 1.10] |
| 5 Dysgeusia Show forest plot | 1 | 40 | Risk Ratio (M‐H, Fixed, 95% CI) | 0.71 [0.27, 1.88] |
| 6 Flush Show forest plot | 1 | 40 | Risk Ratio (M‐H, Fixed, 95% CI) | 2.0 [0.20, 20.33] |
| 7 Diarrhoea Show forest plot | 1 | 40 | Risk Ratio (M‐H, Fixed, 95% CI) | 0.33 [0.01, 7.72] |
| 8 Headache Show forest plot | 1 | 40 | Risk Ratio (M‐H, Fixed, 95% CI) | 0.14 [0.01, 2.60] |
| 9 Itching (including elevated liver enzymes) Show forest plot | 1 | 40 | Risk Ratio (M‐H, Fixed, 95% CI) | 0.2 [0.01, 3.92] |
| 10 Dizziness Show forest plot | 1 | 40 | Risk Ratio (M‐H, Fixed, 95% CI) | 0.33 [0.01, 7.72] |
| 11 Thrombophlebitis Show forest plot | 1 | 40 | Risk Ratio (M‐H, Fixed, 95% CI) | 5.0 [0.26, 98.00] |
| 12 Red blood cell transfusion Show forest plot | 2 | 80 | Risk Ratio (M‐H, Random, 95% CI) | 3.0 [0.13, 69.52] |
| Outcome or subgroup title | No. of studies | No. of participants | Statistical method | Effect size |
| 1 Postpartum depression Show forest plot | 1 | 40 | Risk Ratio (M‐H, Fixed, 95% CI) | 0.33 [0.01, 7.72] |
| 2 Infections Show forest plot | 1 | 40 | Risk Ratio (M‐H, Fixed, 95% CI) | 0.75 [0.19, 2.93] |
| 3 Headache Show forest plot | 1 | 40 | Risk Ratio (M‐H, Fixed, 95% CI) | 0.67 [0.12, 3.57] |
| 4 Low blood pressure Show forest plot | 1 | 40 | Risk Ratio (M‐H, Fixed, 95% CI) | 3.0 [0.13, 69.52] |
| 5 Diarrhoea Show forest plot | 1 | 40 | Risk Ratio (M‐H, Fixed, 95% CI) | 0.33 [0.01, 7.72] |
| 6 Dizziness Show forest plot | 1 | 40 | Risk Ratio (M‐H, Fixed, 95% CI) | 0.33 [0.01, 7.72] |
| 7 Itching (including elevated liver enzymes) Show forest plot | 1 | 40 | Risk Ratio (M‐H, Fixed, 95% CI) | 0.2 [0.01, 3.92] |
| 8 Red blood cell transfusion Show forest plot | 1 | 40 | Risk Ratio (M‐H, Fixed, 95% CI) | 0.0 [0.0, 0.0] |
| Outcome or subgroup title | No. of studies | No. of participants | Statistical method | Effect size |
| 1 Leg paraesthesia Show forest plot | 2 | 76 | Risk Ratio (M‐H, Random, 95% CI) | 0.72 [0.08, 6.65] |
| 2 Red blood cell transfusion Show forest plot | 2 | 100 | Risk Ratio (M‐H, Random, 95% CI) | 0.0 [0.0, 0.0] |
| Outcome or subgroup title | No. of studies | No. of participants | Statistical method | Effect size |
| 1 Breastfeeding Show forest plot | 1 | 40 | Risk Ratio (M‐H, Fixed, 95% CI) | 1.9 [1.21, 2.98] |
| 2 Red blood cell transfusions Show forest plot | 1 | 40 | Risk Ratio (M‐H, Fixed, 95% CI) | 0.2 [0.01, 3.92] |
| Outcome or subgroup title | No. of studies | No. of participants | Statistical method | Effect size |
| 1 Heterogeneity ‐ Infections ‐ comparison 1 Show forest plot | 2 | 374 | Risk Ratio (M‐H, Random, 95% CI) | 1.07 [0.62, 1.84] |
| 2 Heterogeneity, fixed effect ‐ Infections ‐ comparison 1 Show forest plot | 3 | 718 | Risk Ratio (M‐H, Fixed, 95% CI) | 1.49 [0.93, 2.38] |
| 3 Heterogeneity ‐ Hepatic involvement ‐ comparison 1 Show forest plot | 2 | 652 | Risk Ratio (M‐H, Random, 95% CI) | 0.22 [0.06, 0.75] |
| 4 Heterogeneity, fixed effect ‐ Hepatic involvement ‐ comparison 1 Show forest plot | 3 | 996 | Risk Ratio (M‐H, Fixed, 95% CI) | 0.47 [0.21, 1.07] |