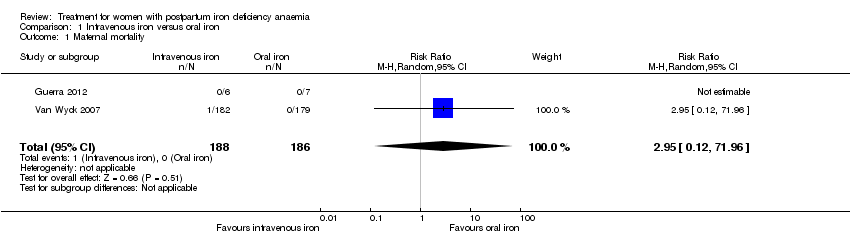
| 1 Maternal mortality Show forest plot | 2 | 374 | Risk Ratio (M‐H, Random, 95% CI) | 2.95 [0.12, 71.96] |
|
| 2 Fatigue ‐ 14 days Show forest plot | 1 | 322 | Mean Difference (IV, Fixed, 95% CI) | ‐3.30 [‐8.04, 1.44] |
|
| 3 Fatigue ‐ 42 days Show forest plot | 1 | 329 | Mean Difference (IV, Fixed, 95% CI) | ‐2.10 [‐6.77, 2.57] |
|
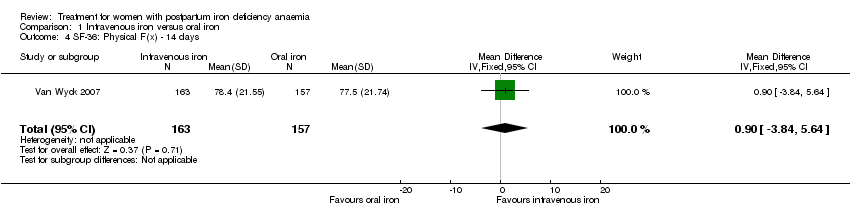
| 4 SF‐36: Physical F(x) ‐ 14 days Show forest plot | 1 | 320 | Mean Difference (IV, Fixed, 95% CI) | 0.90 [‐3.84, 5.64] |
|
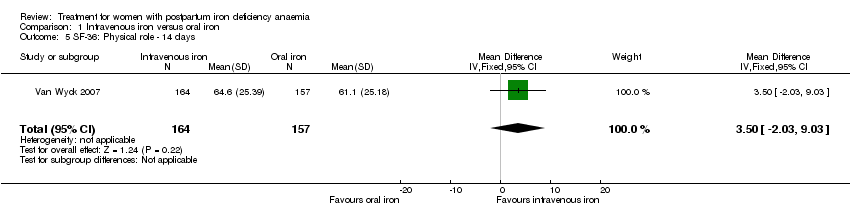
| 5 SF‐36: Physical role ‐ 14 days Show forest plot | 1 | 321 | Mean Difference (IV, Fixed, 95% CI) | 3.50 [‐2.03, 9.03] |
|
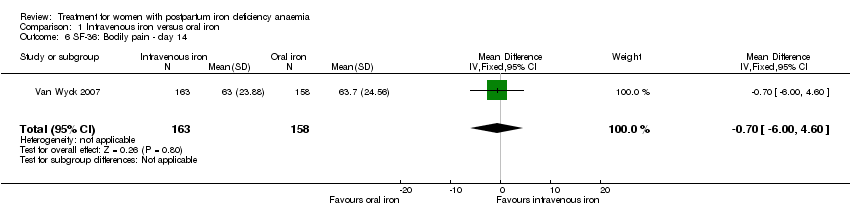
| 6 SF‐36: Bodily pain ‐ day 14 Show forest plot | 1 | 321 | Mean Difference (IV, Fixed, 95% CI) | ‐0.70 [‐6.00, 4.60] |
|
| 7 SF‐36: General health ‐ 14 days Show forest plot | 1 | 321 | Mean Difference (IV, Fixed, 95% CI) | 0.70 [‐3.09, 4.49] |
|
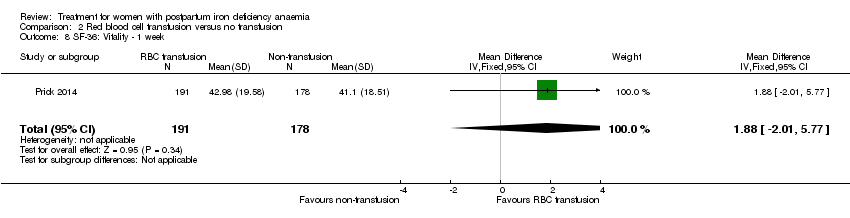
| 8 SF‐36: Vitality ‐ 14 days Show forest plot | 1 | 321 | Mean Difference (IV, Fixed, 95% CI) | 0.90 [‐3.64, 5.44] |
|
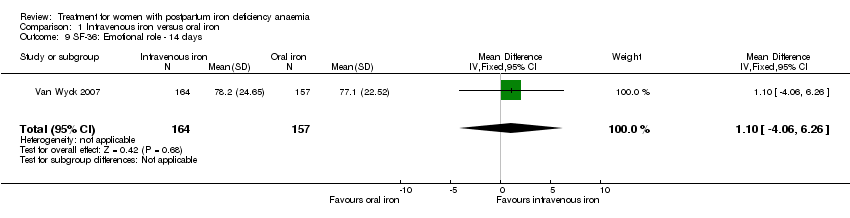
| 9 SF‐36: Emotional role ‐ 14 days Show forest plot | 1 | 321 | Mean Difference (IV, Fixed, 95% CI) | 1.10 [‐4.06, 6.26] |
|
| 10 SF‐36: Social function ‐ 14 days Show forest plot | 1 | 321 | Mean Difference (IV, Fixed, 95% CI) | 1.0 [‐4.08, 6.08] |
|
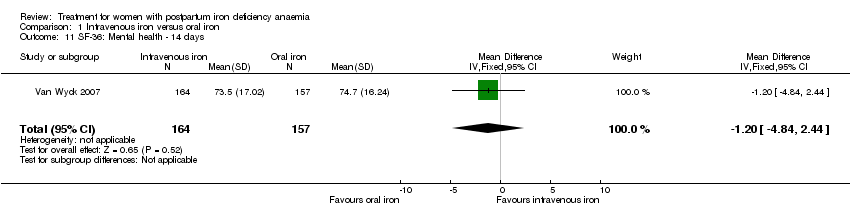
| 11 SF‐36: Mental health ‐ 14 days Show forest plot | 1 | 321 | Mean Difference (IV, Fixed, 95% CI) | ‐1.20 [‐4.84, 2.44] |
|
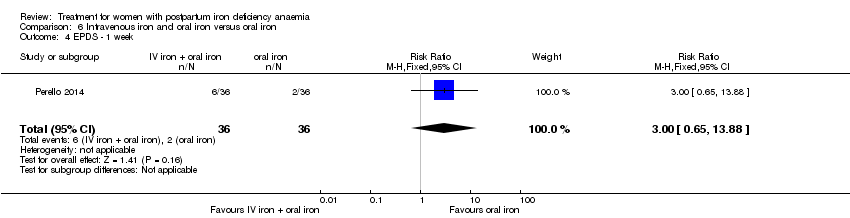
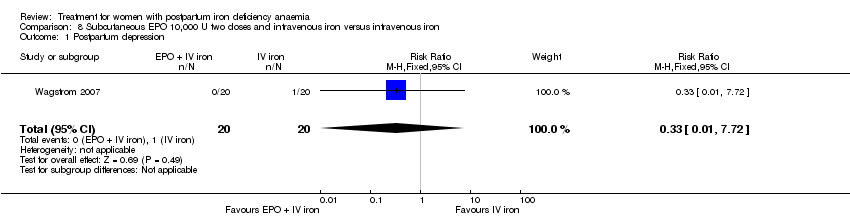
| 12 Depression Show forest plot | 1 | 361 | Risk Ratio (M‐H, Fixed, 95% CI) | 0.33 [0.01, 8.00] |
|
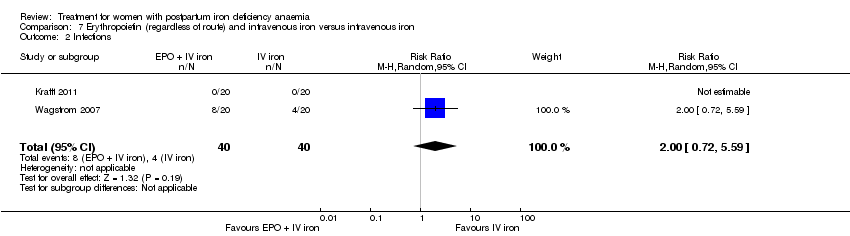
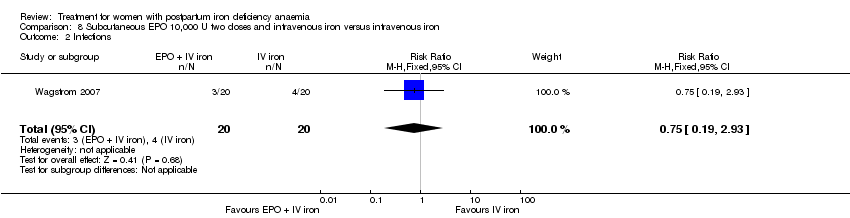
| 13 Infections Show forest plot | 3 | 718 | Risk Ratio (M‐H, Random, 95% CI) | 1.70 [0.58, 5.03] |
|
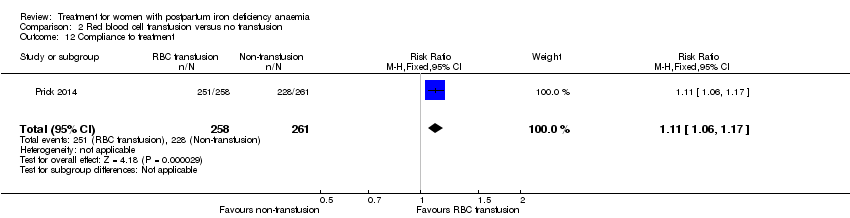
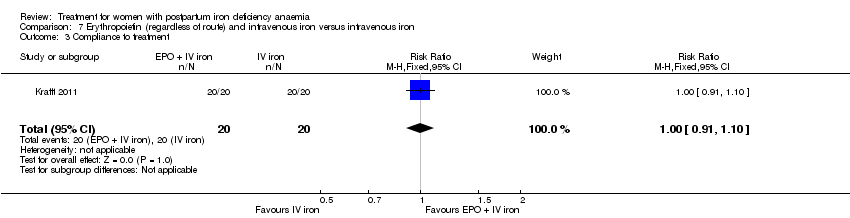
| 14 Compliance to treatment Show forest plot | 5 | 890 | Risk Ratio (M‐H, Random, 95% CI) | 1.17 [1.01, 1.35] |
|
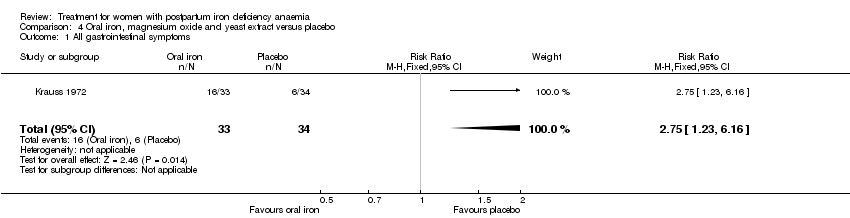
| 15 All gastrointestinal symptoms Show forest plot | 8 | 1307 | Risk Ratio (M‐H, Random, 95% CI) | 0.31 [0.20, 0.47] |
|
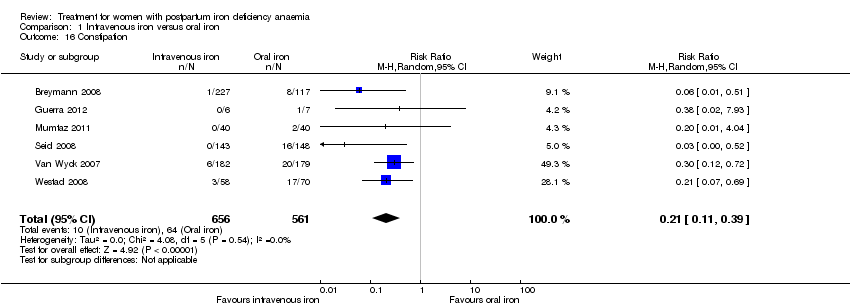
| 16 Constipation Show forest plot | 6 | 1217 | Risk Ratio (M‐H, Random, 95% CI) | 0.21 [0.11, 0.39] |
|
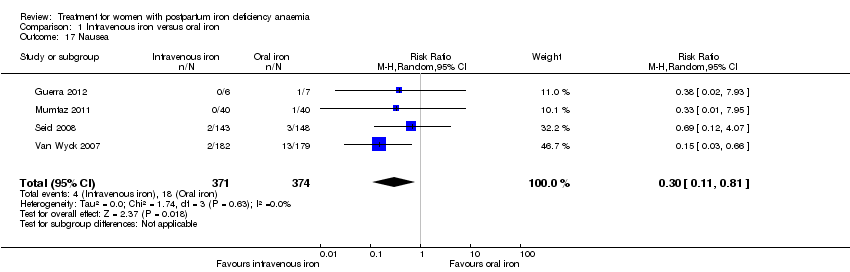
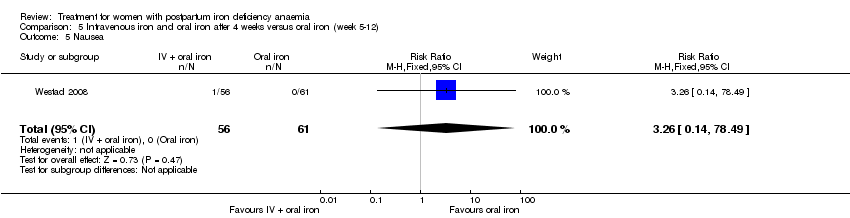
| 17 Nausea Show forest plot | 4 | 745 | Risk Ratio (M‐H, Random, 95% CI) | 0.30 [0.11, 0.81] |
|
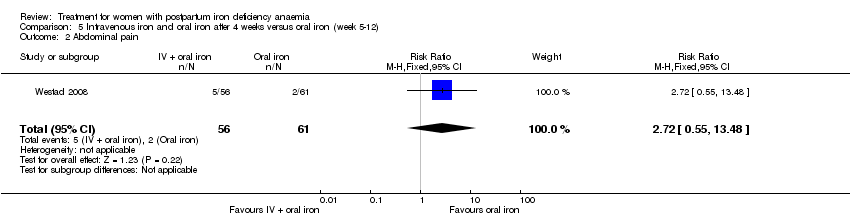
| 18 Gastrointestinal pain Show forest plot | 4 | 543 | Risk Ratio (M‐H, Random, 95% CI) | 0.18 [0.04, 0.83] |
|
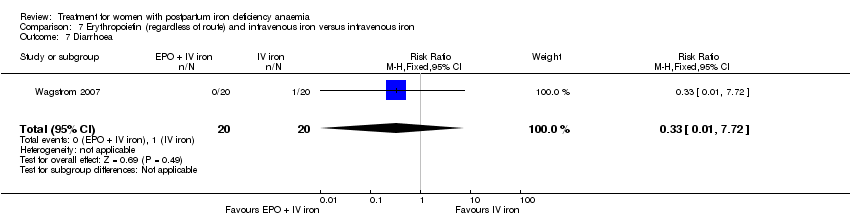
| 19 Diarrhoea Show forest plot | 3 | 569 | Risk Ratio (M‐H, Random, 95% CI) | 0.11 [0.02, 0.59] |
|
| 20 Vomiting Show forest plot | 1 | 128 | Risk Ratio (M‐H, Fixed, 95% CI) | 0.40 [0.02, 9.66] |
|
| 21 Dyspepsia Show forest plot | 2 | 93 | Risk Ratio (M‐H, Random, 95% CI) | 0.36 [0.04, 3.20] |
|
| 22 Dysgeusia Show forest plot | 4 | 543 | Risk Ratio (M‐H, Random, 95% CI) | 7.20 [1.63, 31.76] |
|
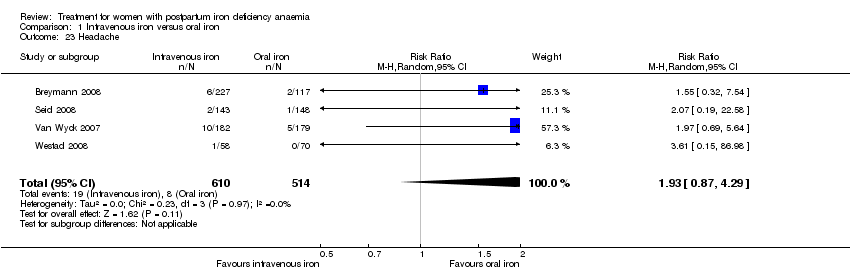
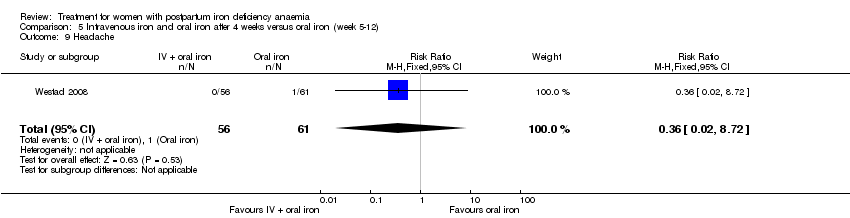
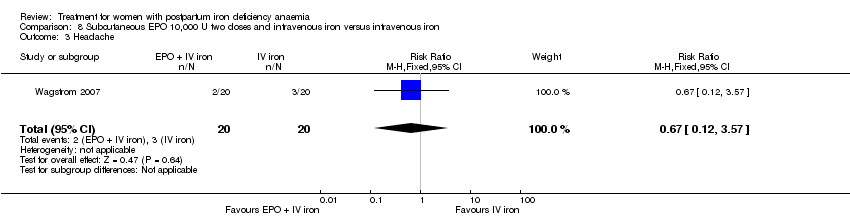
| 23 Headache Show forest plot | 4 | 1124 | Risk Ratio (M‐H, Random, 95% CI) | 1.93 [0.87, 4.29] |
|
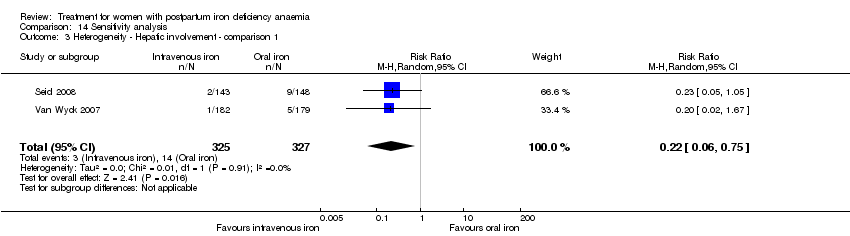
| 24 Hepatic involvement Show forest plot | 3 | 996 | Risk Ratio (M‐H, Random, 95% CI) | 0.45 [0.12, 1.71] |
|
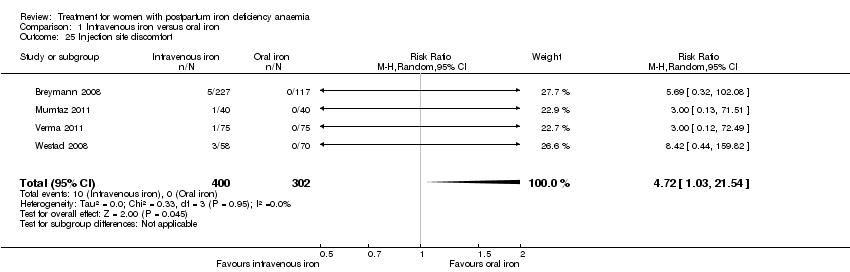
| 25 Injection site discomfort Show forest plot | 4 | 702 | Risk Ratio (M‐H, Random, 95% CI) | 4.72 [1.03, 21.54] |
|
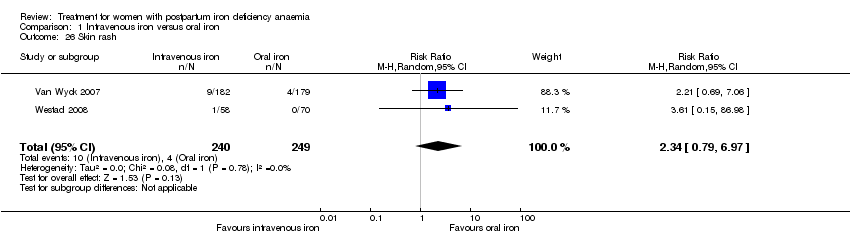
| 26 Skin rash Show forest plot | 2 | 489 | Risk Ratio (M‐H, Random, 95% CI) | 2.34 [0.79, 6.97] |
|
| 27 Urticaria Show forest plot | 1 | 291 | Risk Ratio (M‐H, Fixed, 95% CI) | 4.14 [0.47, 36.59] |
|
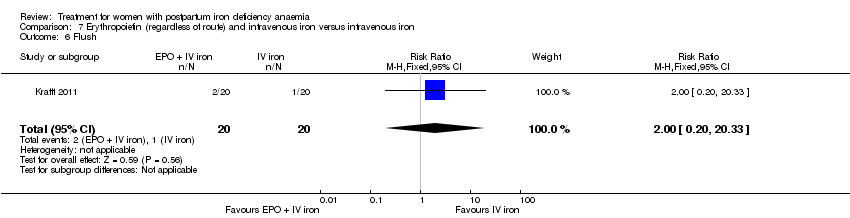
| 28 Flush Show forest plot | 2 | 124 | Risk Ratio (M‐H, Random, 95% CI) | 9.00 [1.18, 68.81] |
|
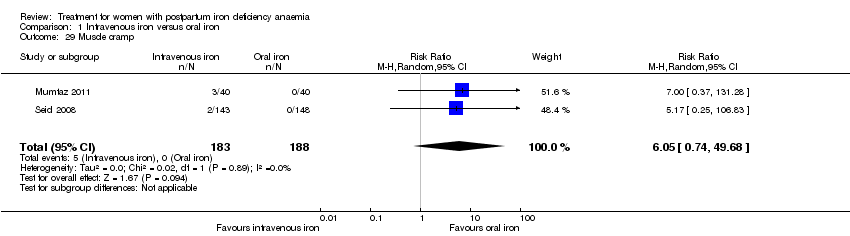
| 29 Muscle cramp Show forest plot | 2 | 371 | Risk Ratio (M‐H, Random, 95% CI) | 6.05 [0.74, 49.68] |
|
| 30 Pain (not specified) Show forest plot | 1 | 128 | Risk Ratio (M‐H, Fixed, 95% CI) | 8.42 [0.44, 159.82] |
|
| 31 Seriouse adverse events (not specified) Show forest plot | 1 | 291 | Risk Ratio (M‐H, Fixed, 95% CI) | 1.03 [0.26, 4.06] |
|
| 32 Anaphylaxis or evidence of hypersensitivity Show forest plot | 8 | 1454 | Risk Ratio (M‐H, Random, 95% CI) | 2.78 [0.31, 24.92] |
|
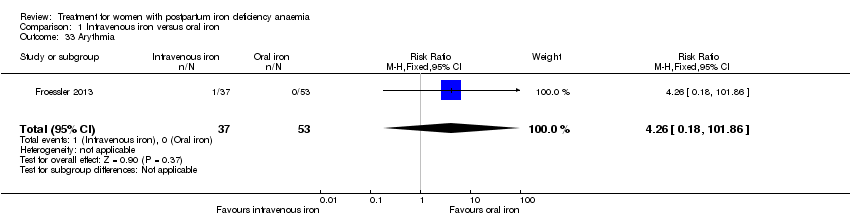
| 33 Arythmia Show forest plot | 1 | 90 | Risk Ratio (M‐H, Fixed, 95% CI) | 4.26 [0.18, 101.86] |
|
| 34 Red blood cell transfusion Show forest plot | 4 | 606 | Risk Ratio (M‐H, Random, 95% CI) | 0.48 [0.19, 1.23] |
|