Tratamiento por inhalación de acción prolongada (agonistas beta, anticolinérgicos y esteroides) para la EPOC: un metanálisis de redes
Resumen
Antecedentes
El objetivo del tratamiento farmacológico para la enfermedad pulmonar obstructiva crónica (EPOC) es aliviar los síntomas, mejorar la calidad de vida y prevenir o tratar las exacerbaciones.
El tratamiento tiende a comenzar con un inhalador, y los tratamientos adicionales se introducen a medida que se consideran necesarios. Para los síntomas persistentes o que empeoran, se prefieren los tratamientos por inhalación de acción prolongada administrados una vez o dos veces al día a los inhaladores de acción corta. Varias revisiones Cochrane han considerado los riesgos y los beneficios de determinados tratamientos por inhalación de acción prolongada en comparación con placebo u otros tratamientos. Sin embargo, para los pacientes y los clínicos, es importante comprender los méritos de estos tratamientos al compararlos entre sí, y si una clase particular de tratamientos por inhalación es más beneficiosa que las otras.
Objetivos
Evaluar la eficacia de las opciones de tratamiento para los pacientes cuya enfermedad pulmonar obstructiva crónica no puede ser controlada con tratamientos de acción corta solos. La revisión no tiene en cuenta los tratamientos combinados generalmente considerados posteriormente en el curso de la enfermedad.
Como parte de este metanálisis de redes, se considerarán los siguientes temas:
1. ¿Cómo se compara la eficacia a largo plazo entre diferentes tratamientos farmacológicos para la EPOC?
2. ¿Hay limitaciones en la base de pruebas actuales que puedan comprometer las conclusiones establecidas mediante este metanálisis de redes? Si es así, ¿cuáles son las implicaciones para la investigación futura?
Métodos de búsqueda
Se identificaron ensayos controlados aleatorios (ECA) en revisiones Cochrane existentes mediante la búsqueda en la Base de Datos Cochrane de Revisiones Sistemáticas (Cochrane Database of Systematic Reviews, CDSR). Además, se realizó una búsqueda exhaustiva de citas en el Registro de Ensayos del Grupo Cochrane de Vías Respiratorias (Cochrane Airways Group Register of trials, CAGR) y se examinaron los sitios web de fabricantes y las listas de referencias de otras revisiones. Las búsquedas más recientes se realizaron en septiembre 2013.
Criterios de selección
Se incluyeron ECA de grupos paralelos de al menos seis meses de duración en pacientes con EPOC. Los estudios se incluyeron si comparaban alguno de los siguientes tratamientos versus cualquier otro: los agonistas beta2 de acción prolongada (ABAP; formoterol, indacaterol, salmeterol); los antagonistas muscarínicos de acción prolongada (AMAP; aclidinio, glicopirronio, tiotropio); los corticosteroides inhalados (CSI; budesonida, fluticasona, mometasona); la combinación de agonistas beta2 de acción prolongada (ABAP) y corticosteroides inhalados (ABAP/CSI) (formoterol/budesonida, formoterol/mometasona, salmeterol/fluticasona); y placebo.
Obtención y análisis de los datos
Se realizó un metanálisis de redes mediante los métodos de cadena de Markov Monte Carlo para dos resultados de eficacia: puntuación total en el St George Respiratory Questionnaire (SGRQ) y volumen espiratorio forzado en un segundo (VEF1). mínimo. Se modeló la efectividad relativa de dos tratamientos como una función de cada tratamiento en relación con el tratamiento de referencia (placebo). Se asumió que los efectos del tratamiento eran similares dentro de las clases de tratamiento (AMAP, ABAP, CSI, ABAP/CSI). Se presentan cálculos de los efectos de la clase, la variabilidad entre los tratamientos dentro de cada clase y los efectos del tratamiento individual comparados entre sí.
Para justificar los análisis, se evaluaron los ensayos en cuanto a la transitividad clínica y metodológica a través de las comparaciones. Se probó la solidez de los análisis mediante la realización de análisis de sensibilidad para la falta de cegamiento y considerando los datos a los 6 y 12 meses por separado.
Resultados principales
Se identificaron 71 ECA que asignaron al azar a 73 062 pacientes con EPOC a 184 brazos de tratamiento de interés. Los ensayos fueron similares con respecto a la metodología, los criterios de inclusión y de exclusión y las características iniciales importantes. Los participantes fueron más a menudo hombres, de alrededor de 65 años de edad, con un VEF1 teórico normal entre 40% y 50% y con antecedentes de un consumo importante de tabaco (40+ paquetes‐años). El riesgo de sesgo fue generalmente bajo, aunque la información faltante dificultó la posibilidad de juzgar el riesgo de sesgo de selección y de informe de resultado selectivo. Los efectos fijos se usaron para los análisis del SGRQ, y los efectos aleatorios para los análisis del VEF1 mínimo, basados en las estadísticas de ajuste del modelo y los criterios de información de las desviaciones (CID).
SGRQ
Los datos del SGRQ estuvieron disponibles en 42 estudios (n = 54 613). A los seis meses, se realizaron 39 comparaciones por pares entre 18 tratamientos en 25 estudios (n = 27 024). La combinación de ABAP/CSI fue la intervención clasificada como de mayor nivel en la clasificación, con una mejoría media sobre el placebo de ‐3,89 unidades a los seis meses (intervalo creíble del 95% [ICr] ‐4,70 a ‐2,97) y ‐3,60 a los 12 meses (ICr del 95%: ‐4,63 a ‐2,34). Los AMAP y los ABAP se clasificaron segundos y terceros a los seis meses, con diferencias de medias de ‐2,63 (ICr del 95%: ‐3,53 a ‐1,97) y ‐2,29 (ICr ‐3,18 a ‐1,53), respectivamente. Los corticosteroides inhalados se clasificaron cuartos (DM ‐2,00; ICr del 95%: ‐3,06 a ‐0,87). Las diferencias de clases entre los ABAP, los AMAP y los CSI fueron menos prominentes a los 12 meses. El indacaterol y el aclidinio se clasificaron en un nivel algo mayor que otros miembros de sus clases, y el formoterol de 12 mcg, la budesonida de 400 mcg y la combinación de formoterol/mometasona se clasificaron en niveles inferiores dentro de sus clases. Hubo una superposición considerable en los intervalos creíbles y las clasificaciones tanto para las clases como para los tratamientos individuales.
VEF1 mínimo
Los datos del VEF1 mínimo estuvieron disponibles en 46 estudios (n = 47 409). A los seis meses, se realizaron 41 comparaciones por pares entre 20 tratamientos en 31 estudios (n = 29 271). En cuanto al SGRQ, la combinación de ABAP/CSI fue la clase clasificada como de mayor nivel, con una mejoría media sobre el placebo de 133,3 mL a los seis meses (ICr del 95%: 100,6 a 164,0) y con una puntuación levemente menor a los 12 meses (diferencia de medias [DM] 100, ICr del 95%: 55,5 a 140,1). Los AMAP (DM 103,5; ICr del 95%: 81,8 a 124,9) y los ABAP (DM 99,4; ICr del 95%: 72,0 a 127,8) generalmente mostraron resultados equivalentes a los seis meses, y los CSI fueron la clase clasificada como cuarta (DM 65,4; ICr del 95%: 33,1 a 96,9). Del mismo modo que con el SGRQ, las diferencias iniciales entre las clases no fueron tan marcadas a los 12 meses. El indacaterol y el salmeterol/fluticasona se consideraron levemente mejores que otros en su clase y el formoterol 12, el aclidinio, la budesonida y la combinación de formoterol/budesonida se clasificaron como inferiores dentro de sus clases. Todos los intervalos creíbles para las clasificaciones individuales fueron amplios.
Conclusiones de los autores
Este metanálisis de redes compara cuatro clases diferentes de inhaladores de acción prolongada para los pacientes con EPOC que necesitan más que broncodilatadores de acción corta. La calidad de vida y la función pulmonar presentaron las mayores mejorías con los inhaladores de combinación (ABAP y CSI) y las menores con CSI solos a los 6 y a los 12 meses. En general, los inhaladores que incluyen AMAP y ABAP tuvieron efectos similares, en particular a los 12 meses. La red ha demostrado el beneficio de los CSI cuando se los agrega a los ABAP para estos resultados en los participantes que en su mayoría tuvieron un VEF1 que fue menor que el 50% teórico, aunque debe considerarse el costo adicional de los inhaladores de combinación y cualquier posibilidad de aumento de los eventos adversos (que han sido establecidos por otras revisiones). Los datos concuerdan con las guías del National Institute for Health and Care Excellence (NICE).
PICO
Resumen en términos sencillos
¿Qué fármacos inhalados de acción prolongada, administrados solos o en combinación, son los más efectivos para los pacientes con EPOC?
¿Por qué es importante esta pregunta?
Se ha demostrado que los fármacos inhalados para la EPOC alivian los síntomas, mejoran la calidad de vida y previenen o tratan las exacerbaciones. El tratamiento con estos fármacos inhalados tiende a comenzar con un inhalador, y los tratamientos adicionales se introducen a medida que se consideran necesarios. Para los síntomas persistentes o que empeoran, se prefieren los fármacos inhalados de acción prolongada administrados una vez o dos veces al día a los inhaladores de acción corta. Varias revisiones Cochrane han considerado los riesgos y los beneficios de determinados tratamientos por inhalación de acción prolongada en comparación con placebo u otros tratamientos. Sin embargo, para los pacientes y los clínicos es importante comprender los beneficios de estos tratamientos comparados entre sí, y si un tipo particular de tratamiento por inhalación es más beneficioso que los otros.
¿Cómo se respondió a la pregunta?
Se buscaron estudios en las revisiones Cochrane existentes y se realizaron búsquedas electrónicas detalladas hasta septiembre de 2013. Se incluyeron los estudios con una duración de al menos seis meses y que comparaban cualquiera de los siguientes tratamientos versus cualquier otro para los pacientes con EPOC: los agonistas beta2 de acción prolongada (ABAP—formoterol, indacaterol, salmeterol); los antagonistas muscarínicos de acción prolongada (AMAP—aclidinio, glicopirronio, tiotropio); los corticosteroides inhalados (CSI—budesonida, fluticasona, mometasona); la combinación de agonistas beta2 de acción prolongada y corticosteroides inhalados (ABAP/CSI—formoterol/budesonida, formoterol/mometasona, salmeterol/fluticasona); y placebo.
Se realizó un metanálisis de redes para evaluar los beneficios de cada tipo de tratamiento (p.ej. los agonistas beta2 de acción prolongada) en relación con los otros en cuanto a la calidad de vida y la función pulmonar. También se consideró cuánto variaban los tratamientos individuales (p.ej. ¿Cuán diferentes eran los tres esteroides inhalados entre sí?) y si ciertos tratamientos eran más efectivos que otros. Se evaluaron los datos a los 6 y 12 meses por separado y se informaron los datos a los 6 meses como resultados primarios.
¿Qué se encontró?
Se encontraron 71 estudios relevantes, pero no todos midieron los resultados por los que había interés. Se incluyeron 42 estudios en los análisis de la calidad de vida (medida con el St George's Respiratory Questionnaire), y se incluyeron 46 en los análisis de la función pulmonar.
Las pruebas provenientes de ensayos similares y de buena calidad apoyaron las combinaciones de ABAP/CSI como la estrategia de tratamiento con mayor probabilidad de brindar mayores mejorías en cuanto a la calidad de vida y la función pulmonar. El tratamiento de combinación proporcionó un beneficio promedio de 3,9 unidades sobre el placebo a los seis meses. Los AMAP y los ABAP se clasificaron segundos y terceros a los seis meses (‐2,63 y ‐2,29 unidades, respectivamente), especialmente cuando los ensayos poco confiables no fueron incluidos, aunque se observó un grado alto de superposición en los cálculos.
La combinación de ABAP/CSI fue la clase clasificada como más alta en cuanto al volumen espiratorio forzado en un segundo (VEF1) mínimo, con mejorías medias sobre el placebo de 133 ml a los seis meses (Intervalo creíble [ICr] del 95%: 101 a 164). Al igual que con el SGRQ, los AMAP (diferencia de medias [DM] 104, ICr del 95%: 82 a 125) se clasificaron justo por encima de los ABAP (DM 99, ICr del 95%: 72 a 128) a los seis meses y los CSI fueron la clase clasificada como más baja (DM 65, ICr del 95%: 33 a 97).
Para ambos resultados, los efectos de los ABAP y los CSI administrados solos parecieron aumentar cuando se utilizaron juntos durante seis meses, aunque las diferencias iniciales entre las clases de tratamiento fueron menos obvias después de un año de tratamiento.
Conclusion
La calidad de vida y la función pulmonar presentaron las mayores mejorías con los inhaladores de combinación (ABAP y CSI) y las menores con CSI solos a los 6 y 12 meses. En general, los inhaladores que incluyen AMAP y ABAP tuvieron efectos similares, en concreto a los 12 meses. La red ha demostrado el beneficio de los CSI cuando se los agrega a los ABAP para estos resultados en los participantes que en su mayoría tuvieron un VEF1 que fue menor que el 50% teórico, aunque debe considerarse el costo adicional de los inhaladores de combinación y cualquier posibilidad de aumento de los eventos adversos (lo cual se ha observado en otras revisiones). Los hallazgos concuerdan con las guías del National Institute for Health and Care Excellence (NICE).
Conclusiones de los autores
Antecedentes
Descripción de la afección
La enfermedad pulmonar obstructiva crónica (EPOC) es una enfermedad respiratoria caracterizada por disnea crónica y progresiva, tos, producción de esputo y obstrucción del flujo aéreo, que da lugar a una actividad restringida y a una calidad de vida deficiente (GOLD). La Organización Mundial de la Salud (OMS) ha calculado que la EPOC es la cuarta o quinta causa única más común de muerte en todo el mundo y los costos del tratamiento y del control presentan una carga significativa para la salud pública. En el Reino Unido, se calcula que el costo anual de la EPOC para el National Health Service (NHS) es de £1 300 000 por 100 000 pacientes (NICE 2011). Además, debido a la aparición lenta y a la falta de reconocimiento de la enfermedad, en muchos casos no es diagnosticada (GOLD). La EPOC comprende una combinación de bronquitis y enfisema e incluye inflamación crónica y cambios estructurales en el pulmón. El consumo de cigarrillos es el factor de riesgo más importante; Sin embargo, la contaminación del aire y el polvo y los productos químicos en el trabajo también pueden aumentar el riesgo de desarrollar la enfermedad. La EPOC es una enfermedad progresiva que da lugar a una disminución en la función pulmonar con el transcurso del tiempo, incluso con la mejor atención disponible. Actualmente no se conoce ninguna curación para la EPOC, aunque la misma es tanto prevenible como tratable. El tratamiento de la enfermedad es multifacético e incluye intervenciones para el abandono del hábito de fumar (van der Meer 2001), tratamientos farmacológicos (GOLD), educación (Effing 2007) y rehabilitación pulmonar (Lacasse 2006; Puhan 2011). El tratamiento farmacológico procura aliviar los síntomas, mejorar la tolerancia al ejercicio y la calidad de vida, mejorar la función pulmonar e incluso prevenir y tratar las exacerbaciones. Las exacerbaciones de la EPOC deterioran la calidad de vida de los pacientes (GOLD) y una gran parte de la carga económica de la EPOC se atribuye al costo del tratamiento de las exacerbaciones, en particular las que dan lugar a hospitalizaciones o al uso de los servicios de casos agudos (Hutchinson 2010). En el Reino Unido, uno de ocho ingresos de urgencia al hospital se debe a la EPOC, y es uno de los trastornos más costosos tratados por el NHS (NICE 2011). Por lo tanto, el tratamiento farmacológico apropiado de la enfermedad es importante, en particular para reducir y prevenir las exacerbaciones.
Descripción de las intervenciones
El tratamiento farmacológico de la EPOC tiende a comenzar con un tratamiento, y los tratamientos adicionales se introducen según sean necesarios para controlar los síntomas y reducir la frecuencia y la gravedad de las exacerbaciones (GOLD). El primer paso a menudo es un broncodilatador de acción corta para el control de la disnea, cuando es necesario: un agonista beta2 de acción corta (ABAC; p.ej. salbutamol) o el antagonista muscarínico de acción corta (AMAC) ipratropio. Ambos broncodilatadores tienen una duración de la acción de cuatro a seis horas (Beeh 2010), y mejoran la función pulmonar y la disnea (Appleton 2006; Sestini 2009). Para la disnea persistente o que empeora asociada con el deterioro de la función pulmonar, pueden introducirse broncodilatadores de acción prolongada (GOLD). Los mismos comprenden agonistas beta2 de acción prolongada, como salmeterol o formoterol (ABAP; duración de la acción 12 horas) e indacaterol (duración de la acción 24 horas) y agentes anticolinérgicos de acción prolongada, como tiotropio (duración de la acción 24 horas) y más recientemente bromuro de aclidinio y bromuro de glicopirronio. Se prefiere el tratamiento regular con broncodilatadores de acción prolongada sobre el tratamiento regular con broncodilatadores de acción corta sobre la base de la eficacia y los efectos adversos (Beeh 2010; GOLD). Una opción cuando no se dispone de broncodilatadores o no son asequibles es la teofilina, un inhibidor de la fosfodiesterasa (FDE) administrado por vía oral. Sin embargo, la teofilina es menos efectiva y presenta una tolerabilidad menor que los broncodilatadores de acción prolongada inhalados. Para los pacientes con EPOC grave o muy grave (volumen espiratorio forzado en un segundo [VEF1] < 50% teórico) y con exacerbaciones repetidas, la GOLD recomienda el agregado de corticosteroides inhalados (CSI) al tratamiento broncodilatador. Los CSI son fármacos antiinflamatorios que están autorizados como inhaladores de combinación con ABAP. Las combinaciones más frecuentes de CSI y ABAP en los inhaladores de combinación son fluticasona y salmeterol, y budesonida y formoterol. El grupo de pacientes más gravemente enfermos con EPOC avanzada también puede beneficiarse del tratamiento con el inhibidor de la FDE4 roflumilast, que puede reducir el riesgo de exacerbaciones (GOLD), junto con otros agonistas beta 2 o agentes anticolinérgicos y CSI, aunque estas combinaciones no se consideran en esta revisión.
Cómo podrían funcionar las intervenciones
Agonistas beta2 de acción prolongada
Los agonistas beta2de acción prolongada (ABAP) inhalados activan los receptores beta2en el músculo liso de la vía respiratoria, lo cual da lugar a una cascada de reacciones que resultan en la broncodilatación. Los ABAP comúnmente usados incluyen salmeterol, formoterol e indacaterol. La duración de la acción para el salmeterol y el formoterol es de aproximadamente 12 horas; por lo tanto, generalmente se toman dos veces al día. El indacaterol tiene una duración de acción de 24 horas y, por lo tanto, puede administrarse una vez al día. Del mismo modo que los antagonistas muscarínicos de acción prolongada (AMAP), los ABAP se usan comúnmente para controlar los síntomas y reducir las exacerbaciones en la EPOC estable (Moen 2010; Rodrigo 2008). Los efectos secundarios posibles de los ABAP incluyen efectos cardíacos, como arritmias y palpitaciones, temblores musculares, cefalea y sequedad bucal (Berger 2008).
Corticosteroides inhalados
Los corticosteroides inhalados (CSI) son fármacos antiinflamatorios. Los CSI están autorizados como inhaladores de combinación con ABAP. Las combinaciones más frecuentes de CSI y ABAP en los inhaladores de combinación son fluticasona y salmeterol, y budesonida y formoterol. Los inhaladores de combinación tienen efectos similares a los ABAP solos, reducen las tasas de exacerbaciones y mejoran la calidad de vida de los pacientes. Sin embargo, algunos han argumentado que la diferencia es pequeña (Rodrigo 2009), y que el tratamiento con CSI, solos o en combinación con agonistas beta 2, se asocia con un mayor riesgo de neumonía y de fractura por osteoporosis (GOLD; Loke 2011; Singh 2010).
Antagonistas muscarínicos de acción prolongada
Los antagonistas muscarínicos de acción prolongada (AMAP) son agentes anticolinérgicos que bloquean la acción del neurotransmisor acetilcolina. El AMAP tiotropio ha ganado una aceptación generalizada como tratamiento de mantenimiento una vez al día en la EPOC estable por sus efectos sobre los síntomas y las exacerbaciones (Barr 2005; GOLD). Recientemente se han autorizado dos AMAP más nuevos que pueden administrarse una vez al día —bromuro de aclidinio y bromuro de glicopirronio— para el tratamiento de mantenimiento de los pacientes con EPOC. Los efectos adversos anticolinérgicos que pueden ocurrir incluyen sensación de sequedad en la boca, estreñimiento y taquicardia (Tashkin 2008).
Por qué es importante realizar esta revisión
Varias revisiones sistemáticas han considerado los riesgos y los beneficios de tratamientos por inhalación específicos comparados con placebo u otros tratamientos por inhalación. Sin embargo, para los pacientes o para los médicos que tratan con los pacientes, la pregunta a menudo es la siguiente: ¿Cuál de las opciones de tratamiento de acción prolongada es la opción de tratamiento más beneficiosa para los pacientes que ya no obtienen el alivio de los síntomas con los tratamientos de acción corta, pero en los que los inhibidores de la FDE4 u otros tratamientos adicionales todavía no son necesarios? Dos metanálisis de redes recientes se han centrado principalmente en los resultados de seguridad (Decramer 2013; Dong 2013).
Objetivos
Evaluar la eficacia de las opciones de tratamiento para los pacientes cuya enfermedad pulmonar obstructiva crónica no puede ser controlada con tratamientos de acción corta solos. La revisión no considera los tratamientos combinados generalmente considerados posteriormente en el curso de la enfermedad.
Como parte de este metanálisis de redes, se considerarán los siguientes temas:
-
¿Cómo se compara la eficacia a largo plazo entre diferentes tratamientos farmacológicos para la EPOC?
-
¿Hay limitaciones en la base de pruebas actuales que puedan comprometer las conclusiones establecidas mediante este metanálisis de redes? Si es así, ¿cuáles son las implicaciones para la investigación futura?
Métodos
Criterios de inclusión de estudios para esta revisión
Tipos de estudios
Se incluyeron sólo ensayos controlados con asignación aleatoria (ECA), con un diseño de grupos paralelos de al menos 24 semanas de duración. No se incluyeron ensayos con grupos cruzados, debido a que los tratamientos farmacéuticos en estudio pueden tener efectos de duración prolongada.
Tipos de participantes
Se incluyeron ECA con participantes que tenían un diagnóstico clínico de EPOC, como ATS/ERS 2004. Se buscaron los siguientes criterios de inclusión.
-
Razón del volumen espiratorio forzado en un segundo (VEF1) / capacidad vital forzada (CVF) < 0,7; que confirma la presencia de limitación persistente del flujo aéreo.
-
Uno o más de los siguientes indicadores fundamentales:
-
Disnea progresiva o persistente.
-
Tos crónica.
-
Producción de esputo crónico.
-
Antecedentes de exposición a factores de riesgo (humo de tabaco, humo de la cocina del hogar y de combustibles para calefacción, polvos y productos químicos en el trabajo).
-
Tipos de intervenciones
Se incluyeron estudios que compararon cualquiera de las siguientes terapias versus cualquier otra.
-
ABAP (formoterol, salmeterol, indacaterol).
-
AMAP (tiotropio, bromuro de aclidinio, bromuro de glicopirronio).
-
CSI (budesonida, fluticasona, mometasona).
-
Combinación de ABAP/CSI (formoterol/budesonida, formoterol/mometasona, salmeterol/fluticasona).
-
Placebo.
Las clases de tratamiento y los tratamientos individuales se compararon entre sí mediante un metanálisis de redes de clase‐modelo. La lista de los tratamientos incluidos comprendía los agentes utilizados comúnmente dentro de cada clase.
A los participantes se les permitía recibir otros fármacos para la EPOC de forma concomitante según lo prescrito por el profesional sanitario, siempre que estos fármacos no formaran parte del tratamiento del ensayo en estudio.
Tipos de medida de resultado
Para los estudios de seis meses de duración, se utilizó el final del estudio como el momento de análisis para todos los resultados. Para los estudios más largos, se extrajeron los datos informados en los intervalos de 6 y 12 meses cuando estaban disponibles. Se eligieron dos medidas de eficacia como variables de valoración, debido a que los metanálisis de redes anteriores principalmente han evaluado los resultados de seguridad (mortalidad, Dong 2013; exacerbaciones y eventos adversos, Decramer 2013).
Resultados primarios
-
Calidad de vida (medida como cambio desde el inicio evaluado con el St George's Respiratory Questionnaire [SGRQ]).
-
Datos del VEF1 (cambio en mL desde el inicio).
Costo‐efectividad
No se realizó un análisis formal del costo‐efectividad, aunque se procuró identificar las evaluaciones económicas que comparaban las intervenciones incluidas para complementar la revisión sistemática principal de los efectos. Las mismas se resumen en un comentario breve en la discusión.
Results
Description of studies
Basic study characteristics, including duration, intervention details and population characteristics, are summarised in Table 1, and full details of each included study can be found in Characteristics of included studies.
| Study ID | Weeks | Arms includeda | N | Ageb | % male | % pred FEV1b | Pack‐yearsb |
| 24 | tiotropium, placebo | 856 | 64.2 | 64.9 | 43.3 | 46.9 | |
| 52 | aclidinium, placebo | 843 | 62.4 | 78.6 | 53.9 | 39.9 | |
| 52 | aclidinium, placebo | 804 | 65.1 | 63.0 | 50.3 | 57.9 | |
| 52 | salmeterol, salmeterol/fluticasone | 797 | 65.4 | 54 | 34.0 | 57.2 | |
| 24 | aclidinium (2), placebo | 828 | 62.4 | 67.4 | 52.5 | 40.2 | |
| 48 | tiotropium, placebo | 3991 | 64.8 | 77.6 | 39.9 | 46 | |
| 48 | tiotropium (2), placebo | 1990 | 65.0 | 74.2 | 37.7 | nr | |
| 26 | indacaterol, tiotropium, glycopyrronium, placebo | 1667 | 64.0 | 74.9 | 55.0 | nr | |
| 26 | budesonide, placebo | 79 | 66 | 78.6 | 36.5 | 51 | |
| 26 | salmeterol, tiotropium, placebo | 1207 | 64.2 | 76.3 | 38.5 | 43.8 | |
| 156 | fluticasone, placebo | 751 | 63.8 | 74.6 | 50.2 | 44 | |
| 52 | formoterol, budesonide, formoterol/budesonide, placebo | 1122 | 64 | 76 | 36 | 39 | |
| 52 | salmeterol, fluticasone, salmeterol/fluticasone, placebo | 1466 | 63.2 | 72.5 | 44.7 | 42.3 | |
| 52 | mometasone, placebo | 631 | nr | nr | 47 | nr | |
| 156 | salmeterol, fluticasone, salmeterol/fluticasone, placebo | 6185 | 65.0 | 75.8 | 44.0 | 48.5 | |
| 52 | mometasone (2), placebo | 911 | 65.1 | 68.3 | 42.3 | nr | |
| 48 | formoterol, formoterol/budesonide | 718 | 63.9 | 81.3 | 42.4 | 38.8 | |
| 26 | formoterol, placebo | 432 | 55 | 67 | 53.6 | 37 | |
| 52 | tiotropium, placebo | 921 | 65 | 65.0 | 38.7 | 61.4 | |
| 48 | tiotropium, placebo | 913 | 66.8 | 59.7 | 39.4 | 50.6 | |
| 104 | tiotropium, placebo | 519 | 64.6 | 77.3 | 38.2 | 51.7 | |
| 52 | formoterol, placebo | 867 | 63.5 | 31.9 | 51.7 | 40.8 | |
| 52 | salmeterol, salmeterol/fluticasone, placebo | 18 | nr | 83.3 | 50.0 | 41.4 | |
| 26 | formoterol, mometasone, formoterol/mometasone (2), placebo | 1196 | 59.7 | 75.2 | 38.6 | 45.1 | |
| 26 | indacaterol (2), tiotropium, placebo | 1683 | 63.6 | 62.8 | 55.6 | 49.7 | |
| 48 | tiotropium, placebo | 1010 | 64.7 | 88 | 47.9 | nr | |
| 52 | tiotropium, salmeterol/fluticasone | 126 | 62.5 | 73.8 | nr | nr | |
| 52 | salmeterol, salmeterol/fluticasone | 782 | 64.9 | 55 | 32.8 | 56.5 | |
| 26 | fluticasone (2), placebo | 640 | 64.4 | 68.8 | nr | nr | |
| 52 | aclidinium (2) | 605 | nr | nr | 46.5 | nr | |
| 26 | glycopyrronium, placebo | 822 | 63.9 | 81.8 | 54.6 | 44.8 | |
| 52 | glycopyrronium, tiotropium, placebo | 1066 | 63.6 | 64.2 | 56.0 | 49.1 | |
| 26 | salmeterol, fluticasone, salmeterol/fluticasone, placebo | 723 | 63.9 | 63.1 | 42 | 56.5 | |
| 43 | salmeterol, salmeterol/fluticasone | 994 | 63.9 | 75.8 | 40.4 | 36.9 | |
| 26 | salmeterol, placebo | 339 | 63.3 | 74.7 | 53.3 | 40.3 | |
| 130 | fluticasone (2), salmeterol/fluticasone, placebo | 114 | 61 | 86.6 | 55.3 | 44.3 | |
| 26 | budesonide, placebo | 49 | nr | nr | nr | nr | |
| 26 | salmeterol, fluticasone, salmeterol/fluticasone, placebo | 674 | 63.5 | 65.8 | 41 | 40.8 | |
| 26 | salmeterol, tiotropium | 90 | nr | 91 | nr | nr | |
| 26 | tiotropium, placebo | 1829 | 67.9 | 98.5 | 35.6 | 68.4 | |
| 26 | salmeterol, salmeterol/fluticasone | 639 | nr | nr | nr | nr | |
| 26 | budesonide, placebo | 26 | 65.4 | 69.2 | 59.2 | 45.0 | |
| 26 | fluticasone, placebo | 281 | 63 | 74 | 57 | nr | |
| 156 | budesonide, placebo | 1277 | 52.5 | 72.9 | 76.9 | 39.3 | |
| 52 | tiotropium, placebo | 142 | 66.4 | 62.9 | 50.0 | 55.2 | |
| 104 | budesonide, placebo | 39 | 55 | 100 | 63.5 | nr | |
| 52 | formoterol, budesonide, formoterol/budesonide, placebo | 1964 | 63.2 | 63.9 | 39.6 | 40 (med) | |
| 52 | formoterol (2), placebo | 645 | 62.7 | 83.3 | nr | nr | |
| 156 | fluticasone, placebo | 190 | 59.0 | 70.5 | 64.5 | 28.3 | |
| 26 | salmeterol, salmeterol/fluticasone | 1050 | 63.6 | 77.8 | nr | nr | |
| 52 | salmeterol/fluticasone, fluticasone, placebo | 387 | 64.8 | 82 | nr | nr | |
| 156 | salmeterol, salmeterol/fluticasone | 186 | 65.7 | 61.3 | nr | nr | |
| 26 | budesonide, placebo | 26 | 60.5 | 53.5 | nr | nr | |
| 104+ | budesonide, placebo | 254 | 63.6 | 58.3 | 52 | 56 | |
| 52 | formoterol, budesonide/formoterol (2) | 1219 | 63.0 | 62.0 | 37.7 | 44.3 | |
| 26 | salmeterol, placebo | 34 | 63.8 | 88.3 | nr | nr | |
| 64 | tiotropium (OL), glycopyrronium | 1483 | 63.4 | 74.1 | nr | nr | |
| 52 | formoterol, budesonide, formoterol/budesonide, placebo | 812 | 64 | 78.8 | 36.2 | 44.5 | |
| 26 | formoterol, budesonide, formoterol/budesonide (3), placebo | 1704 | 63.4 | 66.9 | 39.9 | 40 (med) | |
| 208 | tiotropium, placebo | 5993 | 64.5 | 74.7 | 39.4 | 48.7 | |
| 26 | formoterol, mometasone, formoterol/mometasone (2), placebo | 1055 | 59.8 | 77.5 | nr | 40.4 | |
| 52 | salmeterol, indacaterol | 186 | 69.1 | nr | 53 | nr | |
| 39 | tiotropium, placebo | 554 | 64.2 | 86.1 | 46.9 | 43.7 | |
| 24 | tiotropium, placebo | 457 | 61.8 | 68.4 | nr | nr | |
| 26 | fluticasone, placebo | 23 | 55 | 82.3 | 63.5 | 25.5 | |
| 156 | budesonide, placebo | 290 | 59.1 | 87.5 | 86.6 | nr | |
| 26 | formoterol, tiotropium, placebo | 640 | 62.6 | 77.5 | 51.4 | 38.0 | |
| 52 | salmeterol, tiotropium | 7384 | 62.9 | 74.7 | 49.3 | 38.3 | |
| 104 | tiotropium, salmeterol/fluticasone | 1323 | 64.5 | 82.5 | 39.3 | 40.4 | |
| 24 | salmeterol/fluticasone, placebo | 448 | 66.3 | 88.6 | nr | nr | |
| 24 | budesonide, formoterol/budesonide | 308 | 65.2 | 95.1 | 32.7 | nr |
aNumbers in parentheses indicate multiple doses of the same treatment.
bAge, % predicted FEV1 and pack‐years smoked are reported as means unless otherwise stated.
bid = twice daily.
FEV1 = forced expiratory volume in one second.
ICS = inhaled corticosteroid.
LABA = long‐acting beta2‐agonist.
LABA/ICS = long‐acting beta2‐agonist/inhaled corticosteroid combination therapy.
LAMA = long‐acting muscarinic antagonist.
nr = not reported.
PBO = placebo inhaler.
qd = once daily.
Results of the search
Results of the search are presented in Figure 1, broken down by the search for Cochrane reviews on the left and the electronic database search on the right.
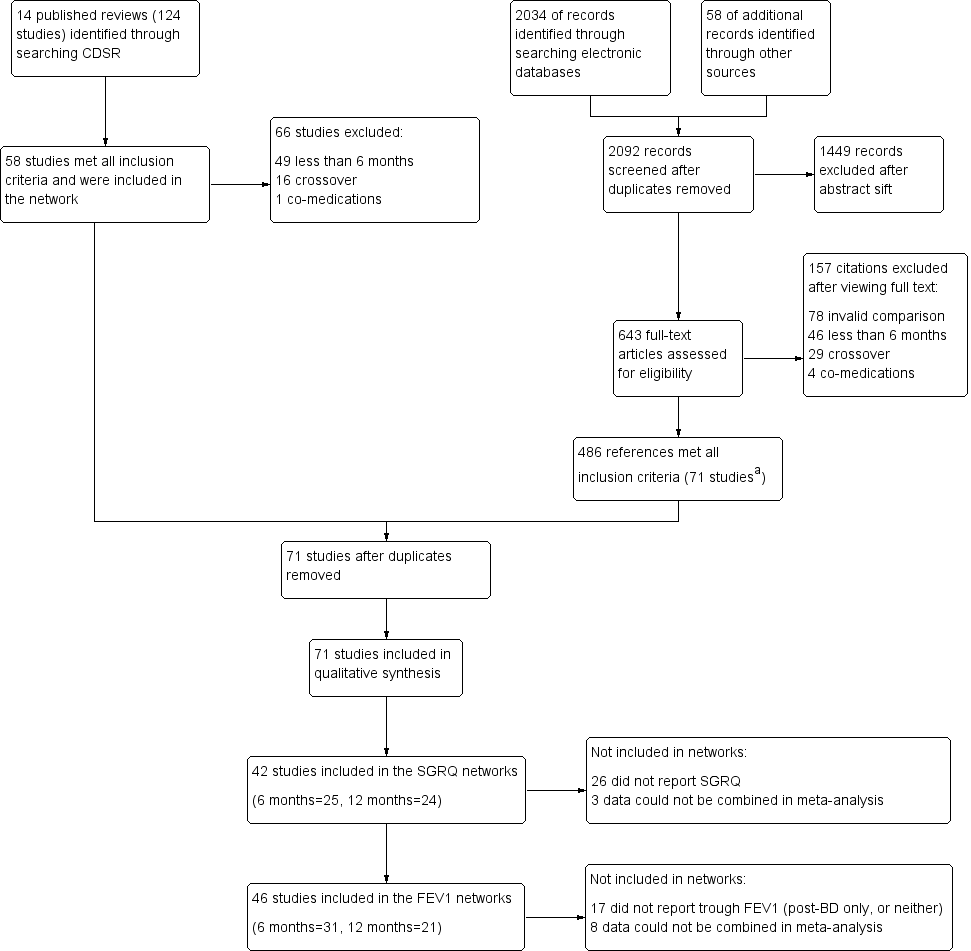
Study flow diagram.
aAll 58 studies identified in the review search were also identified in the electronic database search.
Abbreviations: CDSR = Cochrane Database of Systematic Reviews.
Fourteen relevant Cochrane reviews were identified (Chong 2012; Geake 2012; Karner 2011; Karner 2011a; Karner 2012; Karner 2012a; Kew 2013; Kew 2014; Nannini 2012; Nannini 2013; Nannini 2013a; Spencer 2011; Welsh 2013; Yang 2012a), including a total of 124 studies. Sixty‐six studies were excluded because of differences in the reviews' inclusion criteria, most commonly, 'duration less than six months' (n = 49), and 'cross‐over design' (n = 16). The remaining 58 studies were included in the review.
Searching the CAGR of trials returned 2034 references, and 58 additional references were identified by searching reference lists and drug company websites. We excluded 1449 references after sifting titles and abstracts, and we reviewed full texts after studification for the remaining 643. Four hundred eighty‐six references met all inclusion criteria, most of which related to the 58 studies identified from the review search. The remaining references were collated into 13 additional studies that met the inclusion criteria. The most common reasons for excluding citations after viewing full texts were 'invalid comparison for this review' (n = 78), 'duration less than six months' (n = 46) and 'cross‐over design' (n = 29).
Included studies
Seventy‐one studies met the inclusion criteria, randomly assigning 73,062 people with a diagnosis of COPD to 184 treatment arms of interest (including placebo). The number of participants included in the trials ranged from 18 (Dal Negro 2003) to 7384 (Vogelmeier 2011 [POET]); the mean number per arm of a trial was 397. Table 1 lists all 71 studies that met the inclusion criteria, along with their total duration, treatment arms relevant to the network and summary characteristics for each study population. Table 2 and Table 3 present pooled characteristics for each class and for individual nodes within them for studies contributing data to the SGRQ and trough FEV1 data sets, respectively.
| Comparison | Comparisons | N | Ageb | % male | % FEV1c | Packsd |
| LABA vs placebo | 16 | 13,808 | 62.9 | 74.7 | 46.2 | 42.5 |
| LAMA vs placebo | 15 | 22,406 | 64.2 | 71.3 | 47.1 | 47.5 |
| ICS vs placebo | 10 | 8153 | 63.4 | 74.9 | 41.7 | 42.7 |
| LABA/ICS vs placebo | 10 | 9097 | 63.1 | 75.3 | 39.7 | 42.4 |
| LABA vs LAMA | 2 | 2680 | 63.7 | 69.5 | 55.2 | 49.7 |
| LABA vs ICS | 7 | 6226 | 62.7 | 73.8 | 40.0 | 42.7 |
| LABA vs LABA/ICS | 13 | 12,505 | 63.1 | 71.0 | 38.8 | 43.9 |
| LAMA vs ICS | 0 | ‐ | ‐ | ‐ | ‐ | ‐ |
| LAMA vs LABA/ICS | 1 | 1323 | 64.5 | 82.5 | 39.3 | 40.4 |
| ICS vs LABA/ICS | 10 | 8721 | 62.9 | 75.3 | 38.8 | 42.9 |
aSummary population data are for all study comparisons excluding those made in the 29 studies that could not be included in either the six‐month or the 12‐month SGRQ network.
bAge = mean years.
c% FEV1 = mean percentage predicted FEV1.
dPacks = mean pack‐years.
FEV1 = forced expiratory volume in one second.
ICS = inhaled corticosteroid.
LABA = long‐acting beta2‐agonist.
LABA/ICS = long‐acting beta2‐agonist/inhaled corticosteroid combination therapy.
LAMA = long‐acting muscarinic antagonist.
SGRQ = St George's Respiratory Questionnaire.
| Comparison | Comparisons | N | Ageb | % male | %FEV1c | Packsd |
| LABA vs Placebo | 13 | 8680 | 63.3 | 73.2 | 47.7 | 43.9 |
| LAMA vs Placebo | 16 | 23,111 | 64.3 | 72.2 | 47.6 | 48.9 |
| ICS vs Placebo | 12 | 4574 | 63.6 | 71.9 | 46.2 | 45.2 |
| LABA/ICS vs Placebo | 9 | 4978 | 63.9 | 73.5 | 41.6 | 44.4 |
| LABA vs LAMA | 2 | 2680 | 63.7 | 69.5 | 55.2 | 49.7 |
| LABA vs ICS | 5 | 2506 | 63.6 | 67.1 | 40.6 | 46.7 |
| LABA vs LABA/ICS | 12 | 8005 | 63.7 | 68.8 | 39.9 | 45.8 |
| LAMA vs ICS | 0 | ‐ | ‐ | ‐ | ‐ | ‐ |
| LAMA vs LABA/ICS | 0 | ‐ | ‐ | ‐ | ‐ | ‐ |
| ICS vs LABA/ICS | 8 | 4560 | 63.6 | 71.7 | 39.0 | 45.5 |
aSummary population data are for all study comparisons excluding those made in the 23 studies that could not be included in either the six‐month or the 12‐month FEV1 network; all doses are given in micrograms.
bAge = mean years.
c% FEV1 = mean percentage predicted FEV1.
dPacks = mean pack‐years.
FEV1 = forced expiratory volume in one second.
ICS = inhaled corticosteroid.
LABA = long‐acting beta2‐agonist.
LABA/ICS = long‐acting beta2‐agonist/inhaled corticosteroid combination therapy.
LAMA = long‐acting muscarinic antagonist.
Design and duration
All of the studies were parallel‐group, randomised controlled trials, and most were conducted at multiple centres in several countries. A vast majority were double‐blind; five included one open‐label treatment (see sensitivity analyses), a subset were double‐blind and double‐dummy and blinding was unclear in four others.
All studies had a randomly assigned treatment period of at least 24 weeks. Similar numbers of six‐month and 12‐month studies were identified (n = 30 and n = 29, respectively), but six‐month data were available in a number of the longer trials. Twelve studies lasted between two and four years (Burge 2000 [ISOLDE]; Calverley 2007 [TORCH]; Cooper 2010; Lapperre 2009; Pauwels 1999; Renkema 1996; Schermer 2009; SCO40041; Shaker 2009; Tashkin 2008a [UPLIFT]; Vestbo 1999; Wedzicha 2008 [INSPIRE]). For these studies, we used data measured and reported for six and 12 months in the NMA, rather than endpoint. Data entered in the six‐month analysis were reported between 24 and 32 weeks, and data included in the 12‐month networks were measured between 44 and 56 weeks in the individual studies.
Participant inclusion and exclusion criteria
The trials were relatively consistent in their key inclusion and exclusion criteria. All studies required a clinical diagnosis of COPD, and most specified that this was in accordance with recent guidelines (usually ATS/ERS 2004 or GOLD). The cutoff for forced expiratory volume in one second (FEV1) expressed as the percentage predicted normal value ranged from 50% to 80%. Additional inclusion criteria that were common across trials were these: smokers or ex‐smokers with a smoking history of at least 10 pack‐years, 40 years of age or older and FEV1/FVC ratio less than 70%.
Exclusion criteria that were common across most trials were these: history of asthma or other respiratory disease, any significant disease other than COPD and the need for supplemental oxygen. Patients who had a COPD exacerbation or upper respiratory tract infection in the run up to screening (usually within four to six weeks) were usually excluded. Trials often listed additional exclusion criteria specific to the drugs under study, such as sensitivities to active ingredients, or medical conditions that might be affected by known adverse effects.
Baseline characteristics of participants in the trials
Baseline characteristics are presented for all included studies in Table 1, and for the subsets of studies contributing data to the SGRQ and FEV1 analyses in Table 2 and Table 3, respectively.
In the SGRQ data set, the overall mean age per class was very similar, ranging from 62.9 to 64.5 years. In the FEV1 data set, the overall mean age for each comparison was also very similar, ranging from 63.3 to 64.3. Both data sets consistently included more men than women, and the means of trial percentages were similar between and within comparisons (SGRQ range 69.5% to 82.5%, FEV1 range 67.1% to 73.2%). As might be expected from variation in inclusion criteria, greater variability was noted in the summary statistics for percentage predicted FEV1, with the LABA versus LAMA comparison having somewhat higher scores in both data sets than the other classes (both means around 55% compared with 39% to 47% in the other comparisons). Overall, most population means for percentage predicted FEV1 were less than 50% predicted. Mean pack‐years were between 40 and 50 for all comparisons in both data sets. In general, the data indicated a fairly consistent moderate to severe population across both outcome data sets and across direct between‐class comparisons, which satisfied the transitivity assumption.
Characteristics of the interventions
Table 4 shows the distribution of treatment arms across all 71 included studies, organised by the five prespecified treatment classes. The text below summarises information about all 71 included studies. Table 2 and Table 3 show the number of studies making each class comparison represented in the SGRQ or FEV1 analyses, respectively.
aStudies not contributing data to either outcome.
bid = twice daily.
ICS = inhaled corticosteroid.
LABA = long‐acting beta2‐agonist.
LABA/ICS = long‐acting beta2‐agonist/inhaled corticosteroid combination therapy.
LAMA = long‐acting muscarinic antagonist.
PBO = placebo inhaler.
qd = once daily.
Lists of allowed co‐medications varied between studies, but participants were always allowed a short‐acting beta‐agonist reliever inhaler and short‐term treatment for exacerbations during the randomised period (course of oral corticosteroids or antibiotics).
1. Long‐acting beta2‐agonists (LABAs)
Thirty‐seven LABA treatment arms were identified across 30 studies (n = 15,266). Twelve studies included a formoterol arm with treatment given at 12 mcg twice daily, and Rossi 2002 also randomly assigned participants to a higher dose of twice‐daily 24 mcg. Formoterol was most commonly given via a dry powder inhaler but sometimes via a metered‐dose inhaler (to retain blinding in the newer multiarm mometasone studies). Salmeterol was given at 50 mcg twice daily in 17 studies (n = 9019), primarily via the Diskus device. Indacaterol, a once‐daily preparation, was given as 150 mcg in three studies (Bateman 2013 [SHINE]; Donohue 2010 [INHANCE]; Kornmann 2011) and as 300 mcg in three studies (Dahl 2010; Donohue 2010 [INHANCE]; To 2011), one of which also used a higher dose of 600 mcg. Donohue 2010 [INHANCE] was conducted in two stages, and the data derived are for the four randomly assigned groups from stage 2.
2. Long‐acting muscarinic antagonists (LAMAs)
Thirty‐four LAMA treatment arms were included across 28 studies (n = 21,805). Most studies used tiotropium 18 mcg daily, delivered most often via the HandiHaler. Six studies included two arms that met criteria for inclusion in the LAMA category: Bateman 2010b used two tiotropium doses (5 and 10 mcg daily via Respimat), ATTAIN 2011 and Gelb 2012 used two aclidinium doses (200 and 400 mcg daily) and Bateman 2013 [SHINE], GLOW2 2012 and SPARK 2013 included both glycopyrronium 50 mcg and open‐label tiotropium. Two additional glycopyrronium studies used 50 mcg via the Breezhaler, and two other aclidinium studies used the lower of the two doses via the Genuair device. Two other tiotropium studies used the Respimat device to deliver 5 mcg daily (Abrahams 2013 and Bateman 2010a).
3. Inhaled corticosteroids (ICSs)
Twenty‐seven studies included an ICS arm (n = 6788), with two including two doses of the same drug that were relevant to the review (Calverley 2008; FLTA3025). Twelve studies (n = 3491) reported a fluticasone arm: two studies used 250 mcg twice daily, and the rest 500 mcg, delivered most often via the Diskus device. Twelve studies with around half as many people used budesonide (n = 1900): two at the higher dose of 800 mcg twice daily, and the rest at 400 mcg, with both doses delivered via dry powder inhalers. Mometasone was used in four studies (n = 1397) and was given as 400 mcg twice daily or 800 mcg once daily.
4. Long‐acting beta2‐agonist/inhaled corticosteroid combinations (LABA/ICS)
Thirty LABA/ICS treatment arms were identified in 25 studies (n = 9727). Three studies used two budesonide doses (160 mcg and 320 mcg; Rennard 2009; Sharafkhaneh 2012; Tashkin 2008 [SHINE]), and seven additional studies used only the higher dose (total N = 3221). Two identically designed studies included two formoterol/mometasone doses each, 200 and 400 mcg (n = 888). Sixteen studies had a salmeterol/fluticasone arm (n = 5618), six at the lower ICS dose of 50/250 mcg and 11 at the higher dose of 50/500 mcg. All LABA/ICS inhalers were prescribed for twice‐daily use and drugs were delivered by dry powder or pressurised metered‐dose inhalers.
5. Placebo
Most studies included a placebo control arm (n = 55), which consisted of a total of 19,476 people. Inhalers varied across studies depending on the device used to deliver the study drugs. Once‐daily and twice‐daily placebos were combined in the same node as the reference treatment to increase the number of comparisons that could be made.
Transitivity (similarity of participants, interventions and trial methodology)
-
Inclusion and exclusion criteria, as described above, did not vary systematically across classes; although variation in the allowed co‐medications and in the maximum allowed percentage predicted FEV1 was noted, these did not translate to systematic differences in the characteristics of the recruited population.
-
Baseline characteristics were varied between individual trials, but summary baseline characteristics were comparable across pair‐wise comparisons between classes for both outcome data sets (see above and Table 2; Table 3). Mean percentage predicted FEV1 was somewhat higher in the LABA versus LAMA comparisons conducted in two studies (55% vs 39% to 47% in the other comparisons).
-
Intervention characteristics introduced some potential sources of systematic variation between trials, notably as a result of the devices used and the dosing schedule. However, as all nodes showed variation in the delivery device used and in once‐daily and twice‐daily regimens, we did not consider these factors to violate assumptions needed for indirect comparisons. The placebo‐controlled trials used matching inhalers to control for bias at a trial level, and variation within classes was similar, so we considered a combined placebo class valid as the reference treatment (regardless of device or dosing regimen).
-
Methodology was similar across trials, and no issues with the comparability of trial duration arose, as we included only data relevant to the time points specified. Funding sources varied across classes, depending on the drug manufacturers, but this variability did not translate into systematic differences in the way that trials were conducted, nor in the populations recruited (i.e. similar inclusion criteria, baseline characteristics and study designs). Average sample size per class was higher in the LAMA trials (659 and 633 for SGRQ and FEV1, respectively) than in the four other classes (range 189 to 471 across both outcome data sets), but variation within the classes was comparable.
Outcomes and analysis structure
For both outcomes, the overall fit of the network meta‐analysis class model was compared with the fit of a class model without the consistency assumption (broadly equivalent to a pair‐wise meta‐analysis with random class effects), using the total residual deviance. Statistical inconsistency was not significant on SGRQ at 12 months nor on the FEV1 analyses (six and 12 months). However some evidence of inconsistency was noted in the network for SGRQ at six months. This was investigated further using the node‐split approach (Dias 2010), which found some evidence of inconsistency (P value 0.01, although multiple comparisons were made) in the direct evidence comparing indacaterol 150 mcg and tiotropium 18 mcg. We investigated the possible clinical explanation for this inconsistency and found that studies directly comparing these two treatments delivered tiotropium open‐label, which affected comparability with other tiotropium studies, and increased risk of bias (see sensitivity analyses). The dose was misclassified in one study comparing salmeterol versus salmeterol/fluticasone combination (salmeterol/fluticasone as 50/500 bid instead of 50/250). Because the study did not appear in the main six‐month results nor change the class comparisons, we did not rerun the analyses.
St George's Respiratory Questionnaire (SGRQ)
The SGRQ is a well‐validated and widely used measure of health status in patients with chronic airflow limitation; the total score ranges from zero (perfect health) to 100 (most severe status) and includes the three components of symptoms, activity and impacts.
In the main network of effects at six months, 18 of 25 possible treatments were represented across 72 treatment arms in 25 studies (n = 27,024). The fixed‐effect model was preferred, as statistical heterogeneity was not significant. We extracted and analysed data as change from baseline per arm and estimated population variance on the basis of data from studies reporting variance for change per arm (see Measures of treatment effect). The mean of SDs, weighted by sample size, was imputed as 14 when variance for change could not be obtained.
The 12‐month analysis contained slightly fewer data and had a broadly similar structure (containing data for 19 treatment comparisons in 24 studies). The fixed‐effect model was preferred, as with the six‐month analysis, but Calverley 2003 [TRISTAN] showed some lack of fit. Data from four studies were removed from the six‐month network in the blinding sensitivity analysis (Bateman 2013 [SHINE]; Donohue 2010 [INHANCE]; GLOW2 2012; SPARK 2013), and data from two studies were removed from the 12‐month network (GLOW2 2012; SPARK 2013).
The network structure for SGRQ at six months is shown in Figure 2.
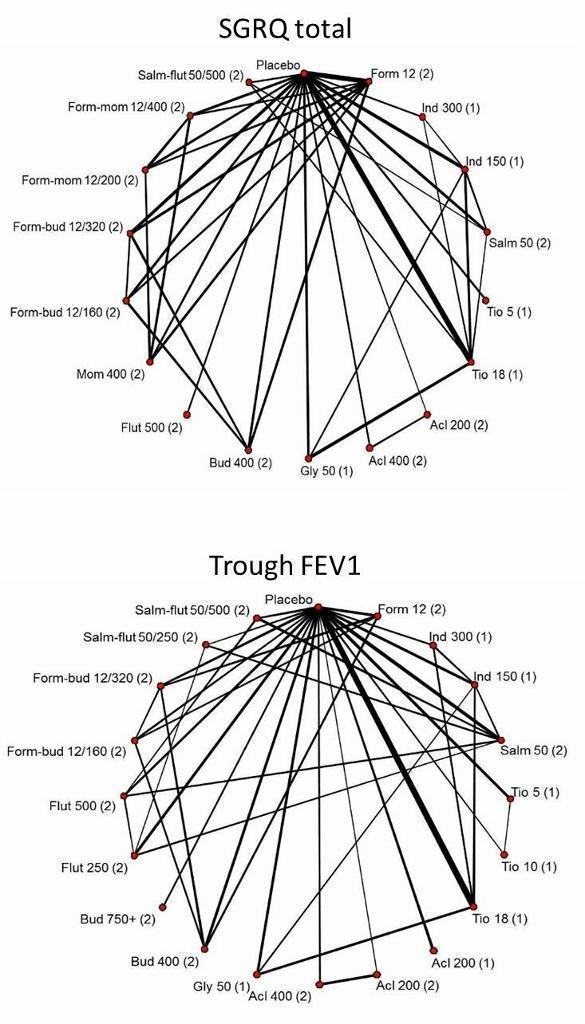
Network structures for both outcomes at six months.
Trough forced expiratory volume in one second (FEV1)
In the main network of effects at six months, 20 of 25 possible treatments were represented across 82 treatment arms in 31 studies (n = 29,271). A random‐effects model was preferred, as the fixed‐effect model has very poor fit. Data for eight studies were available only as treatment contrasts, and the rest were entered as change from baseline per arm, along with the associated variance. For trials reporting treatment contrasts, we included co‐variance, which was calculated as the variance of the mean in the control arm (placebo for all trials). For the rest of the trials, missing variance for change from baseline was imputed as 283 (mL) from the mean of available SDs weighted by sample size.
One very small trial was excluded from the six‐month analysis (SLMF4010, n = 34) because of the unusually high dropout from already very small groups (seven of 17 dropped out in both groups). The study showed very poor fit, even in random‐effects models, because the results contradicted all other trials.
The 12‐month analysis contained fewer data (19 treatments compared in 21 studies) but again had a structure broadly similar to the main six‐month analysis. As with the six‐month analysis, the random‐effects model was preferred, as the fixed‐effect model had very poor fit. Data from the same four studies were removed from the six‐month and 12‐month networks, as for the SGRQ sensitivity analyses (see Table 5).
| Study ID | Arm removed | Analyses affected |
| Tiotropium 18 mcg | SGRQ6m, FEV6m | |
| Tiotropium 18 mcg | SGRQ6m, FEV6m | |
| Tiotropium 18 mcg | SGRQ6m, FEV6m, SGRQ12m, FEV12m | |
| Whole study (2 arms) | SGRQ6m, FEV6m, SGRQ12m, FEV12m | |
| Tiotropium 18 mcg | Did not appear in analyses |
FEV = forced expiratory volume in one second
SGRQ = St George's Respiratory Questionnaire
6m = six month analysis
12m = 12 month analysis
The network structure for trough FEV1 at six months is shown in Figure 2.
Sensitivity analyses
Five studies included a randomly assigned group that received tiotropium as an open‐label treatment (Bateman 2013 [SHINE]; Donohue 2010 [INHANCE]; GLOW2 2012; SPARK 2013; Vogelmeier 2008). As this introduced the potential for performance and assessment bias, we removed these arms from the affected networks in a risk of bias sensitivity analysis, as detailed in Table 5. Blinding led to unclear or high risk of bias in four additional studies, mainly as the result of insufficient reporting, but none of the studies reported data that could be included in the networks (Fang 2008; Mahmud 2007; Ohar 2013; To 2011).
As stated in the protocol, we analysed separately data collected at six months and at 12 months.
Excluded studies
Sixty‐six studies were excluded from the 14 relevant Cochrane reviews, and five others that came up in the electronic database search are recorded in Characteristics of excluded studies. We did not record every reference excluded after the full‐text sift (n = 157), as review of the full paper revealed that most trials were apparently of less than six months' duration, or they compared treatments that were not within the scope of the study.
Risk of bias in included studies
Methodological quality of the included studies was generally good. Across all six domains, around 60% of judgements were 'low risk', and 13% were 'high' risk. It is unlikely that the evidence presented in this review is affected by biases associated with unacceptable sequence generation, and most trials were double‐blinded. The most common reasons for probable bias were attrition and selective reporting in the individual trials. A degree of uncertainly regarding the risk of bias associated with allocation concealment and blinding of outcome assessors was due mostly to insufficient reporting. Risk of bias judgements for all of the included studies are summarised in Figure 3
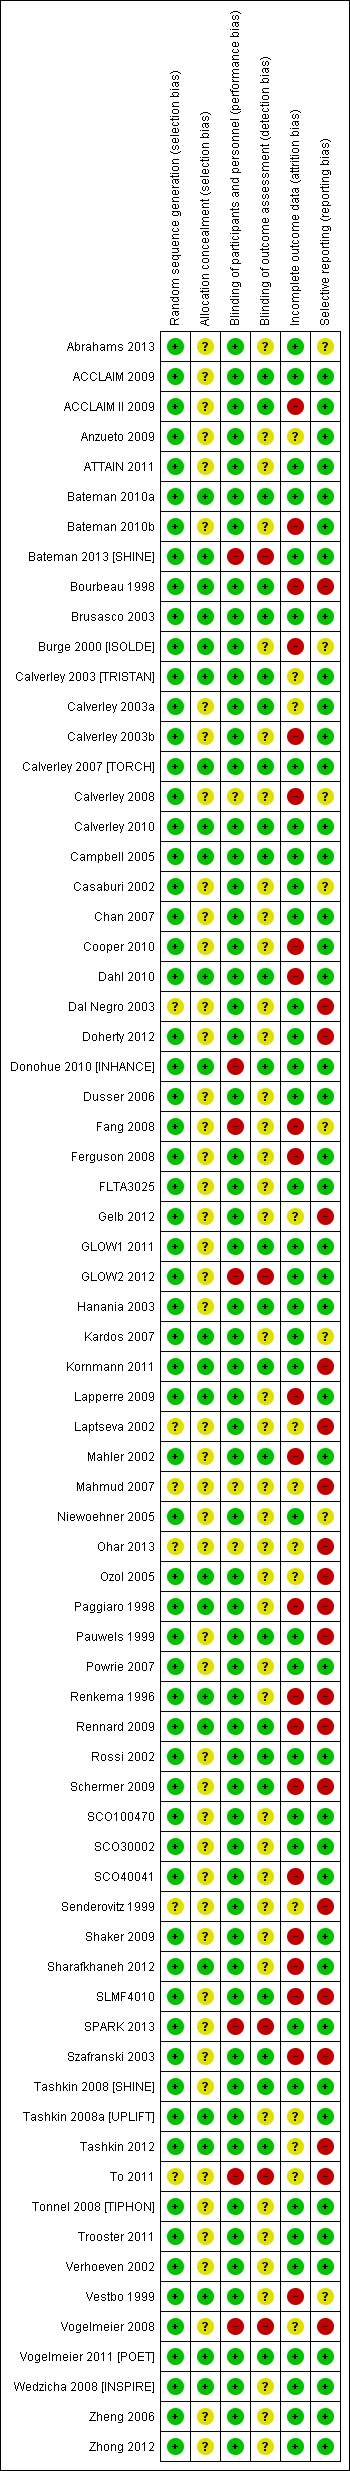
Risk of bias summary: review authors' judgements about each risk of bias item for each included study.
Allocation
Random sequence generation
All studies were randomised trials, and none were given high risk ratings for either of the selection bias domains. Most were funded by drug manufacturers with whom the authors had had previous contact to confirm methods of sequence generation. As such, all studies were considered to be at low risk of bias for this domain, with the exception of six studies for which only a conference abstract was available (rated unclear). Of these, none appeared in the SGRQ data set, and only two contributed FEV1 data.
Allocation concealment
A third of studies described methods of allocation concealment (interactive voice response system or sealed envelopes) and were rated as having low risk of bias (n = 24). The remaining studies did not explicitly describe their methods and were rated as unclear. This information is likely to be conservative given the high proportion of industry‐funded trials, which generally have rigorous controls for selection bias.
Blinding
Blinding of participants and personnel
A large majority of trials stated that they were double‐blind, which, unless otherwise stated, was understood to pertain to at least participants and personnel. For this reason, more than 85% of the trials were rated at low risk for performance bias. Seven trials (10%) were given a high risk of bias rating, which was due mostly to the fact that one arm of the trial was delivered open‐label. In these instances, treatment comparisons that did not involve the open‐label arm were not affected, and sensitivity analyses removing these arms assessed the effects of removing these high‐risk comparisons from the networks.
Blinding of outcome assessors
A third of trials gave enough detail to warrant a low risk of bias rating, which was usually obtained from the clinicaltrials.gov registration. Most trials did not describe how outcomes were assessed in sufficient detail to rule out bias associated with unblinded outcome assessors and hence were rated as unclear. As with allocation concealment, an unclear rating for studies not explicitly describing outcome assessor blinding is likely to be conservative. Five studies were rated as high risk for the same reasons outlined for the participant and personnel domain.
Incomplete outcome data
Around half the trials were judged to be at low risk of bias because the level of dropout was acceptable and balanced between groups, or because sufficient efforts were made to impute missing data. Twenty‐two trials were given a high risk rating, indicating a significant risk that unbalanced or especially high attrition may have compromised the validity of the results, and 13 were rated as unclear. However, several of the high risk ratings were given to the longer trials (two years or longer), in which a significant proportion of participants had dropped out by the end of the trial. By including data at the six‐month and 12‐month time points rather than at endpoint in these unusual trials, the risk from attrition may be reduced, as higher percentages of the randomly assigned populations were generally included in the earlier analyses.
Selective reporting
Most trials could be linked to a prospectively registered protocol for cross‐checking of reported outcomes (on clinicaltrials.gov or manufacturers' websites). Most reported the named outcomes well in published reports, and a subset had additionally posted results summaries on clinicaltrials.gov, warranting a low risk rating (n = 43). A third were judged to be at high risk of bias, usually because outcomes stated in the protocol or important study methods were missing from published reports, regardless of whether this directly affected our analyses. Some trials were rated at high risk of bias because SGRQ or FEV1 data were reported but not in an acceptable format to be combined in meta‐analysis. Although some early trials did not use the SGRQ or used a different FEV1 measurement for legitimate reasons, this fact and selective outcome reporting resulted in omission of a significant proportion of relevant trials from the SGRQ and FEV1 analyses. Eight were rated as unclear, usually because a protocol could not be located to confirm that all planned outcomes had been reported.
Effects of interventions
For each outcome, we presented six‐month data for the main analyses, along with the number of treatments included, the number of pair‐wise comparisons made and estimates of model fit and heterogeneity. Results are presented first as class effects and second for individual treatments. As the class analysis assumes that treatments within the same class are exchangeable and are distributed around a class mean, we have also outlined the effects of fitting the class model on individual treatment effects.
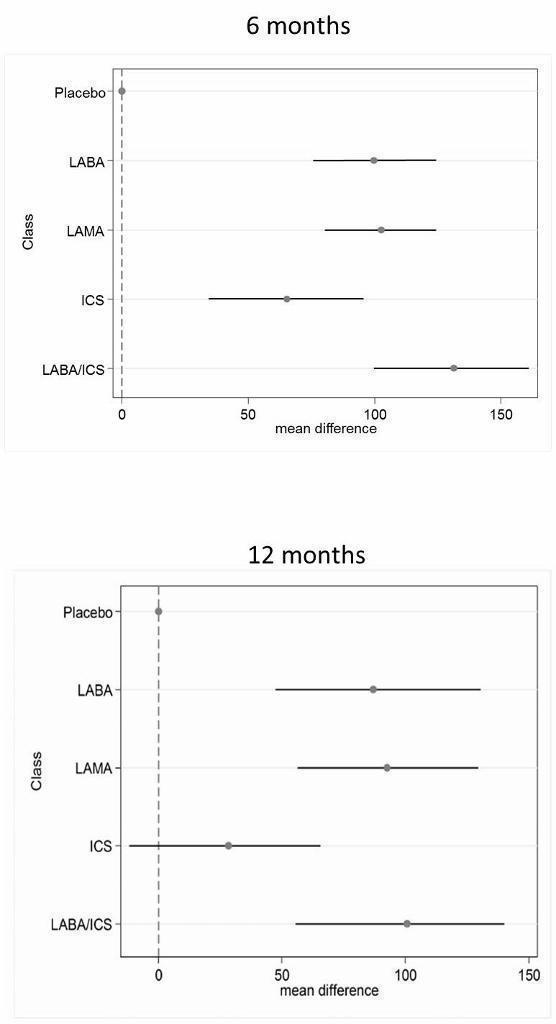
Results from the 12‐month networks for each outcome are also presented (shown graphically alongside the six‐month class results in Figure 4 and Figure 5), and sensitivity analyses for risk of bias (open‐label delivery) are presented for the six‐month class analyses.

St George's Respiratory Questionnaire (SGRQ) change from baseline—six‐month and 12‐month class results.
Trough forced expiratory volume in one second (FEV1) change from baseline—six‐month and 12‐month class results.
St George's Respiratory Questionnaire
Across six months and 12 months, 42 studies with 118 individual treatment nodes were included in the networks (n = 54,613).
Main analysis—six months
Eighteen treatments were compared over a total of 72 treatment arms in 25 studies (n = 27,024). Thirty‐nine pair‐wise comparisons were made, and the fixed‐effect model was preferred because statistical heterogeneity was not significant (DIC random = 214.9, fixed = 214.5).
Class effects
Table 6 shows each class effect relative to placebo (i.e. the combined treatment benefit over placebo), expressed as change from baseline. The classes are also ranked (mean and median) and are presented with estimates of the probability that each is the best class. Figure 4 displays class effects against the reference treatment (placebo), shown by the vertical dashed line on the right‐hand side of the graph.
| Effect vs placebo | Effect vs placebo | Rank | ||||||
| Class | Median | 95% CrI | Median | 95% CrI | Mean | Median | 95% CrI | Pr (best) |
| LABA/ICS | ‐3.89 | (‐4.70 to ‐2.97) | ‐3.89 | (‐4.66 to ‐3.05) | 1.0 | 1 | (1 to 2) | 0.96 |
| LAMA | ‐2.63 | (‐3.53 to ‐1.97) | ‐2.78 | (‐3.58 to ‐2.13) | 2.4 | 2 | (1 to 4) | 0.03 |
| LABA | ‐2.29 | (‐3.18 to ‐1.53) | ‐2.09 | (‐2.93 to ‐1.36) | 3.1 | 3 | (2 to 4) | 0.01 |
| ICS | ‐2.00 | (‐3.06 to ‐0.87) | ‐1.96 | (‐2.99 to ‐0.91) | 3.5 | 4 | (2 to 4) | 0.00 |
aFor effects versus placebo, smaller values indicate larger benefits of the active treatment; all doses are given in micrograms.
Crl = credible interval.
SGRQ = St George's Respiratory Questionnaire.
ICS = inhaled corticosteroid.
LABA = long‐acting beta2‐agonist.
LABA/ICS = long‐acting beta2‐agonist/inhaled corticosteroid.
LAMA = long‐acting antimuscarinic antagonist.
NWMA = network meta‐analysis.
Pr = probability.
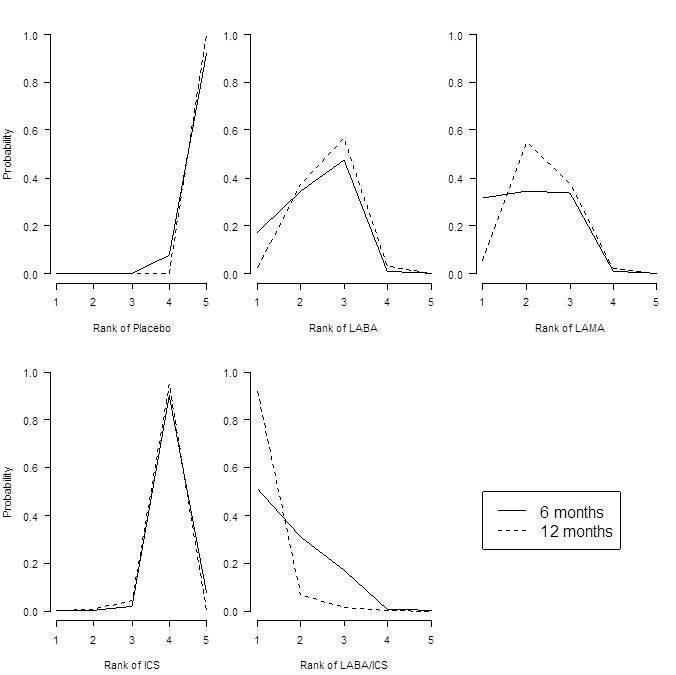
Combination LABA/ICS was the highest ranked treatment, with a mean improvement over placebo of 3.89 units (95% credible interval (CrI) ‐4.70 to ‐2.97). LAMAs and LABAs were ranked second and third, with mean differences of ‐2.63 (95% CrI ‐3.53 to ‐1.97) and ‐2.29 (95% CrI ‐3.18 to ‐1.53), respectively, but a large degree of overlap was noted between their credible intervals. Inhaled corticosteroids were the fourth ranked class but still showed a mean two‐unit benefit over placebo at six months (95% CrI ‐3.06 to ‐0.87). Figure 6 shows graphs of the probabilities that each class ranks in any one of the five possible positions. The median within‐class variance was 0.44 units (95% CrI 0.03 to 1.09).

St George's Respiratory Questionnaire (SGRQ) probability ranking diagrams—six months and 12 months.
Individual treatment effects
Effects relative to placebo are presented separately for each treatment in Table 7, along with ranks and estimates with and without the class model for comparison. The credible intervals for each treatment were wide and largely overlapping (for both ranks and mean differences from placebo).
| Rank (from class NWMA) | Effect vs placebo | Effect vs placebo | Rank (from class NWMA) | ||||||
| Class | Treatment (number daily doses) | Median | 95% CrI | Median | 95% CrI | Mean | Median | 95% CrI | Pr (best) |
| LABA | Form 12 (2) | ‐1.84 | (‐2.60 to ‐0.94) | ‐1.20 | (‐2.10 to ‐0.30) | 14.9 | 15 | (10 to 17) | 0.00 |
| Ind 300 (1) | ‐2.38 | (‐3.63 to ‐1.44) | ‐3.10 | (‐4.86 to ‐1.36) | 11.3 | 12 | (5 to 17) | 0.00 | |
| Ind 150 (1) | ‐2.75 | (‐3.95 to ‐1.85) | ‐3.67 | (‐4.76 to ‐2.58) | 8.7 | 8 | (3 to 16) | 0.01 | |
| Salm 50 (2) | ‐2.20 | (‐2.98 to ‐1.43) | ‐2.27 | (‐3.27 to ‐1.27) | 12.9 | 13 | (7 to 17) | 0.00 | |
| LAMA | Tio 5 (1) | ‐2.50 | (‐3.16 to ‐1.86) | ‐2.42 | (‐3.20 to ‐1.63) | 10.5 | 10 | (6 to 16) | 0.00 |
| Tio 18 (1) | ‐2.53 | (‐3.12 to ‐1.97) | ‐2.66 | (‐3.33 to ‐1.99) | 10.3 | 10 | (6 to 15) | 0.00 | |
| Acl 200 (2) | ‐2.66 | (‐4.04 to ‐1.70) | ‐3.79 | (‐6.14 to ‐1.45) | 9.1 | 9 | (2 to 16) | 0.01 | |
| Acl 400 (2) | ‐2.81 | (‐4.40 to ‐1.90) | ‐4.59 | (‐6.94 to ‐2.23) | 7.9 | 7 | (1 to 15) | 0.03 | |
| Gly 50 (1) | ‐2.63 | (‐3.42 to ‐1.94) | ‐2.83 | (‐3.74 to ‐1.91) | 9.5 | 9 | (5 to 15) | 0.00 | |
| ICS | Bud 400 (2) | ‐1.76 | (‐2.82 to ‐0.55) | ‐0.97 | (‐2.32 to 0.38) | 14.9 | 16 | (7 to 17) | 0.00 |
| Flut 500 (2) | ‐1.95 | (‐3.07 to ‐0.74) | ‐1.71 | (‐3.40 to ‐0.01) | 13.9 | 15 | (6 to 17) | 0.00 | |
| Mom 400 (2) | ‐2.28 | (‐3.51 to ‐1.19) | ‐2.77 | (‐4.47 to ‐1.09) | 11.9 | 13 | (5 to 17) | 0.00 | |
| LABA/ICS | Form‐bud 12/160 (2) | ‐4.04 | (‐4.91 to ‐3.15) | ‐3.85 | (‐4.99 to ‐2.70) | 2.6 | 2 | (1 to 6) | 0.29 |
| Form‐bud 12/320 (2) | ‐3.80 | (‐4.63 to ‐2.84) | ‐3.31 | (‐4.39 to ‐2.22) | 3.9 | 4 | (1 to 9) | 0.10 | |
| Form‐mom 12/200 (2) | ‐3.85 | (‐4.82 to ‐2.66) | ‐3.45 | (‐5.17 to ‐1.74) | 3.7 | 4 | (1 to 10) | 0.15 | |
| Form‐mom 12/400 (2) | ‐3.75 | (‐4.72 to ‐2.48) | ‐3.09 | (‐4.81 to ‐1.37) | 4.3 | 4 | (1 to 11) | 0.10 | |
| Salm‐flut 50/500 (2) | ‐4.05 | (‐4.97 to ‐3.18) | ‐4.36 | (‐5.60 to ‐3.12) | 2.6 | 2 | (1 to 6) | 0.31 | |
aFor effects versus placebo, smaller values indicate larger benefits of the active treatment; all doses are given in micrograms.
Crl = credible interval.
SGRQ = St George's Respiratory Questionnaire.
ICS = inhaled corticosteroid.
LABA = long‐acting beta2‐agonist.
LABA/ICS = long‐acting beta2‐agonist/inhaled corticosteroid.
LAMA = long‐acting antimuscarinic antagonist.
NWMA = network meta‐analysis.
Pr = probability.
Individual treatment effects of particular note within a class were associated with indacaterol and aclidinium for LABA and LAMA, respectively. Effects for both doses of each of these drugs were dampened by the class model in the six‐month SGRQ network (indacaterol by 0.72 and 0.92 for 300 mcg and 150 mcg, respectively, and aclidinium by 1.13 and 1.78 for 200 mcg and 400 mcg, respectively). Treatments of note for which estimates were inflated by fitting the class model were formoterol 12 mcg (by 0.64), budesonide 400 mcg (by 0.79) and formoterol/mometasone combination 2/400 mcg (by 0.66).
Additional analyses
12 months
Nineteen treatments were compared in 24 studies, but a dose comparison of aclidinium made in Gelb 2012 was disconnected from the rest of the network. These treatments can be used in class analysis, as they “borrow” the class effect. The fixed‐effect model was preferred.
In the class analysis (Appendix 4 and Figure 4), LABA/ICS combinations remained the highest ranked at 12 months, with only a slightly smaller mean effect over placebo than at six months (‐3.60, 95% CrI ‐4.63 to ‐2.34). Compared with the six‐month analysis, LABA, LAMA and ICS showed more similar benefits over placebo at 12 months, ranging between ‐2.34 and ‐2.55, with similar credible intervals. Within‐class variance was slightly larger than in the six‐month analysis (median 0.53, 95% CrI 0.04 to 1.27).
Individual treatment effects for the 12‐month analysis are presented in Appendix 5.
Sensitivity analysis—blinding
Table 6 shows how the six‐month effects were affected by removal of data at high risk of bias for blinding (see 'Effect vs placebo sensitivity analysis'). The difference between point estimates of LAMA over LABA was larger with less overlap in the credible intervals, and within‐class variance was smaller than in the main analysis (median 0.35, 95% CrI 0.02 to 0.98). Inconsistency associated with Donohue 2010 [INHANCE] was resolved by removing the open‐label tiotropium arm, but unexplained poor fit of three further trials remained (Kornmann 2011; Rennard 2009; Tashkin 2012). As all open‐label arms removed were given tiotropium, it is possible that the expected treatment benefit over placebo in these studies was reduced by lack of blinding for these comparisons, which dampened the overall treatment effect within the LAMA class.
Trough FEV1
Across six months and 12 months, 46 studies with 120 individual treatment nodes were included in the networks (n = 47,409).
Main analysis—six months
Twenty treatments were compared over a total of 82 treatment arms in 31 studies (n = 29,271). Forty‐one pair‐wise comparisons were made. The random‐effects model was preferred (DIC = 691), as the fixed‐effect model has very poor fit (DIC = 719.1).
Class effects
Table 8 shows each class effect relative to placebo. As for SGRQ, the classes are also ranked (mean and median) and are presented with estimates of the probability that each is the best. Figure 6 displays trough FEV1 class effects (mL) compared with placebo.
| Effect vs placebo | Effect vs placebo | Rank | ||||||
| Class | Median | 95% CrI | Median | 95% CrI | Mean | Median | 95% CrI | Pr (best) |
| LABA/ICS | 133.30 | (100.60 to 164.00) | 132.80 | (98.93 to 165.60) | 1.1 | 1 | (1 to 2) | 0.9 |
| LAMA | 103.50 | (81.78,124.90) | 103.60 | (79.01 to 126.60) | 2.4 | 2 | (1 to 3) | 0.1 |
| LABA | 99.44 | (71.98,127.80) | 99.86 | (70.41 to 130.50) | 2.6 | 3 | (1 to 4) | 0.0 |
| ICS | 65.36 | (33.06,96.91) | 65.52 | (31.23 to 97.16) | 3.9 | 4 | (3 to 4) | 0.0 |
aFor effects versus placebo, smaller values indicate larger benefits of the active treatment; all doses are given in micrograms.
Crl = credible interval.
FEV1 = forced expiratory volume in one second.
ICS = inhaled corticosteroid.
LABA = long‐acting beta2‐agonist.
LABA/ICS = long‐acting beta2‐agonist/inhaled corticosteroid.
LAMA = long‐acting antimuscarinic antagonist.
NWMA = network meta‐analysis.
Pr = probability.
Results at six months showed a similar pattern to the SGRQ analysis. Combination LABA/ICS was the highest ranked treatment, with a mean improvement over placebo of 133.3 mL (95% CrI 100.6 to 164.0) after six months. As was the case for quality of life, LAMAs and LABAs were ranked second and third, with mean differences of 103.5 (95% CrI 81.8 to 124.9) and 99.4 (95% CrI 72.0 to 127.8), respectively, but again a large degree of overlap was noted between the credible intervals. Inhaled corticosteroids were the fourth ranked class but still showed a mean 65.4 mL benefit over placebo at six months (95% CrI 33.1 to 96.9). The median within‐class variance was 9.04 mL (95% CrI 0.41 to 34.85). Figure 7 shows graphs of the probabilities that each class ranks in any one of the five possible positions.
Forced expiratory volume in one second (FEV1) probability ranking diagrams—six months and 12 months.
Individual treatment effects
Effects relative to placebo are presented separately for each treatment in Table 9, along with ranks and estimates with and without the class model for comparison.
| Effect vs placebo | Effect vs placebo | Rank (from class NWMA) | |||||||
| Class | Treatment (number daily doses) | Median | 95% CrI | Median | 95% CrI | Mean | Median | 95% CrI | Pr (best) |
| LABA | Form 12 (2) | 94.88 | (60.70 to 122.80) | 53.92 | (13.00 to 94.07) | 12.0 | 13 | (5 to 18) | 0.00 |
| Ind 300 (1) | 103.30 | (71.95 to 150.10) | 137.90 | (63.69 to 209.90) | 9.5 | 10 | (2 to 16) | 0.02 | |
| Ind 150 (1) | 99.53 | (72.32 to 127.20) | 100.70 | (65.74 to 133.80) | 10.8 | 12 | (4 to 16) | 0.00 | |
| Salm 50 (2) | 101.00 | (73.39 to 130.70) | 114.70 | (75.96 to 149.30) | 10.3 | 11 | (4 to 16) | 0.00 | |
| LAMA | Tio 5 (1) | 105.40 | (81.87 to 131.80) | 110.50 | (73.82 to 145.40) | 8.9 | 9 | (3 to 15) | 0.01 |
| Tio 10 (1) | 106.40 | (79.80 to 142.00) | 121.00 | (62.88 to 175.20) | 8.6 | 8 | (2 to 15) | 0.02 | |
| Tio 18 (1) | 105.20 | (85.54 to 125.50) | 107.00 | (82.93 to 129.50) | 9.0 | 9 | (4 to 15) | 0.00 | |
| Acl 200 (1) | 98.83 | (59.06 to 123.20) | 59.31 | (9.47 to 107.90) | 11.3 | 11 | (5 to 18) | 0.00 | |
| Acl 200 (2) | 100.60 | (65.20 to 127.10) | 74.82 | (11.81 to 134.20) | 10.7 | 11 | (4 to 17) | 0.00 | |
| Acl 400 (2) | 107.30 | (80.93 to 143.50) | 108.80 | (45.06 to 168.30) | 8.2 | 8 | (2 to 15) | 0.02 | |
| Gly 50 (1) | 103.60 | (79.83 to 127.50) | 101.50 | (67.86 to 133.40) | 9.5 | 10 | (3 to 15) | 0.00 | |
| ICS | Bud 400 (2) | 61.89 | (23.86 to 94.06) | 14.59 | (‐29.22 to 58.25) | 17.6 | 18 | (14 to 19) | 0.00 |
| Bud 750+ (2) | 63.10 | (14.75 to 99.65) | ‐2.26 | (‐95.77 to 91.34) | 17.3 | 18 | (12 to 19) | 0.00 | |
| Flut 250 (2) | 66.78 | (34.19 to 101.10) | 76.18 | (29.36 to 122.30) | 16.9 | 17 | (11 to 19) | 0.00 | |
| Flut 500 (2) | 72.16 | (40.20 to 109.80) | 97.04 | (54.90 to 138.40) | 15.9 | 16 | (8 to 19) | 0.00 | |
| LABA/ICS | Form‐bud 12/160 (2) | 131.10 | (91.65 to 164.00) | 80.84 | (26.99 to 132.70) | 3.9 | 3 | (1 to 13) | 0.16 |
| Form‐bud 12/320 (2) | 127.30 | (85.14 to 159.50) | 72.77 | (28.75 to 116.70) | 4.7 | 4 | (1 to 14) | 0.11 | |
| Salm‐flut 50/250 (2) | 139.70 | (106.20 to 182.90) | 173.00 | (116.20 to 226.40) | 2.4 | 2 | (1 to 8) | 0.39 | |
| Salm‐flut 50/500 (2) | 137.10 | (104.40 to 172.10) | 152.40 | (104.10 to 197.80) | 2.8 | 2 | (1 to 9) | 0.26 | |
aFor effects versus placebo, bigger values indicate larger benefits of the active treatment; all doses are given in micrograms.
Crl = credible interval.
FEV1 = forced expiratory volume in one second.
ICS = inhaled corticosteroid.
LABA = long‐acting beta2‐agonist.
LABA/ICS = long‐acting beta2‐agonist/inhaled corticosteroid.
LAMA = long‐acting antimuscarinic antagonist.
NWMA = network meta‐analysis.
Pr = probability.
The class model affected individual treatment effects to a lesser extent in the FEV1 network than in the SGRQ one, because less intra class variation was present. Several treatment effects that were higher than the class mean were dampened by the class model, including indacaterol 300 (by 34.6 mL) and salmeterol‐fluticasone 50/250 mcg combination therapy (by 33.3 mL). Effects for formoterol 12 mcg and both formoterol/budesonide combination doses were less favourable within their classes and were inflated by the class model (by 41.0 mL, and 50.3 and 54.5 mL, respectively). Although aclidinium was particularly effective in the SGRQ analysis, the relative effects for both lower doses on trough FEV1 appeared less favourable than other members of the LAMA class (MD 59.3 and 74.8 mL without the class model compared with the overall class mean of 103.5). Within the ICS class, the two budesonide doses showed less benefit over placebo than the two fluticasone doses. However, credible intervals for the individual treatment groups were wide and overlapping.
Additional analyses
12 months
Nineteen treatments were compared in 22 studies. As with the 12‐month SGRQ analysis, the dose comparison of aclidinium made in Gelb 2012 was disconnected from the rest of the network. The random‐effects model was preferred (DIC = 485.4), as the fixed‐effect model had very poor fit (DIC = 557.4).
In the class analysis (Appendix 6 and Figure 6), LABA/ICS remained the highest ranked treatment strategy, although the effect over placebo was lower than at six months (100 mL, 95% CrI 55.5 to 140.1). As with SGRQ, the benefit of LAMA over LABA was much less clear at 12 months, and their credible intervals showed a large degree of overlap with each other and with the LABA/ICS class. Within‐class variance was larger than in the six‐month analysis (median 18.02, 95% CrI 1.22 to 47.80).
Individual treatment effects for the 12‐month analysis are presented in Appendix 7.
Sensitivity analysis—blinding
Table 8 shows how the six‐month effects were influenced by removal of data at high risk of bias for blinding. Within‐class variance was similar to that in the main analysis (median 10.49, 95% CrI 0.54 to 37.66). The effects were very similar with and without the open‐label data, unlike in the SGRQ analysis. This may reflect the nature of the two measurements, with SGRQ perhaps more susceptible to performance or detection bias than measures of lung function.
Discusión
Resumen de los resultados principales
Los datos obtenidos de ensayos de buena calidad y similares apoyan el tratamiento de combinación con ABAP/CSI como la estrategia de tratamiento de mayor nivel en la clasificación para mejorar la calidad de vida y beneficiar la función pulmonar en los ensayos incluidos (principalmente con participantes en los que el VEF1 fue menor que el 50% teórico). El tratamiento de combinación proporcionó un beneficio promedio de 3,9 unidades sobre el placebo a los seis meses (ICr del 95%: ‐4,70 a ‐2,97). Los AMAP (DM ‐2,63; ICr del 95%: ‐3,53 a ‐1,97) se clasificaron segundos y los ABAP se clasificaron terceros a los seis meses (DM ‐2,29; ICr del 95%: ‐3,18 a ‐1,53), especialmente cuando no se incluyeron ensayos con riesgo alto de sesgo, aunque la diferencia entre estas clases fue pequeña y se observó un grado elevado de superposición en los cálculos.
La combinación de ABAP/CSI fue la clase clasificada como más alta para el VEF1 mínimo, con una mejoría media sobre el placebo de 133,3 ml a los seis meses (ICr del 95%: 100,6 a 164,0). Al igual que en el caso del SGRQ, los AMAP se clasificaron segundos (DM 103,5; ICr del 95%: 81,8 a 124,9) y los ABAP se clasificaron terceros (DM 99,4; ICr del 95%: 72,0 a 127,8) a los seis meses; los CSI fueron la cuarta clase en la clasificación (DM 65,4 mL, ICr del 95%: 33,1 a 96,9).
Para ambos resultados, los efectos de las monoterapias con ABAP y CSI parecieron ser aditivos a los seis meses, aunque las diferencias iniciales entre las clases de tratamiento fueron menos prominentes después de un año de tratamiento.
Compleción y aplicabilidad general de las pruebas
Los análisis del SGRQ demostraron que el tratamiento con una combinación de ABAP/CSI tuvo una diferencia de medias sobre el placebo de acuerdo con la diferencia mínima clínicamente importante (DMCI) de cuatro unidades, y las estimaciones puntuales y los intervalos de confianza del 95% de las otras clases fueron menores que cuatro unidades. Sin embargo, no es apropiado insinuar que los ABAP/CSI proporcionan un beneficio significativo en la calidad de vida mientras que las otras clases no lo hacen. Una revisión anterior demostró que un tratamiento que presenta una diferencia de medias e IC del 95% de menos de cuatro unidades en el SGRQ puede, sin embargo, dar lugar a un número significativamente mayor de pacientes que logran un cambio de cuatro unidades en el SGRQ en el grupo de tratamiento en comparación con el grupo de placebo (Karner 2012a). Para el VEF1, con la excepción de la monoterapia con CSI, las diferencias del tratamiento variaron de 99 a 133 ml, que está de acuerdo con el umbral de importancia clínica sugerido por Cazzola 2008 (100 a 140 ml).
Las guías nacionales recomiendan los tratamientos incluidos en esta revisión (ABAP, AMAP o ABAP/CSI) sobre los fármacos de acción corta habituales para los pacientes con exacerbaciones o disnea persistente (NICE 2011), a los que se hace referencia como pacientes con EPOC moderada (estadio II) o grave (estadio III) (GOLD). NICE 2011 recomienda el agregado de CSI en los pacientes que también presentan un VEF1. menor que el 50% teórico. Mediante la compilación de información acerca de los participantes incluidos en cada uno de los ensayos incluidos y la evaluación de la transitividad, fue posible tener seguridad acerca de los tipos de pacientes a los cuales se pueden aplicar las conclusiones de esta revisión. Aunque algunos ensayos individuales dentro de la red incluían a participantes que excedían o no cumplían con los criterios descritos en las guías, las estadísticas de resumen indican que los grupos de participantes de los ensayos se clasificaron en las categorías de enfermedad moderada y grave, y la mayoría de los participantes tenían un VEF1 de menos del 50% teórico. Como resultado, las pruebas no son aplicables a los pacientes con síntomas leves. De igual manera, debido a los criterios de exclusión comunes en los ensayos relacionados a las comorbilidades, y al asma en particular, estos hallazgos pueden no ser relevantes a algunos grupos de pacientes. Finalmente, debido a que se decidió no incluir algunos tratamientos y tratamientos de combinación más nuevos en la red, los resultados de la clase pueden no ser aplicables a los tratamientos emergentes.
Para complementar los hallazgos en cuanto a la eficacia, se procuró identificar pruebas del costo‐efectividad. Debido a que los ABAP/CSI fueron el tratamiento más efectivo para ambos resultados y es probable que sea la estrategia de tratamiento más costosa en muchos contextos, se procuró identificar los estudios que evaluaban el costo‐efectividad en comparación con otras opciones de tratamiento, y si la misma variaba en los pacientes con diferentes niveles de síntomas. Se encontraron tres estudios recientes basados en el reanálisis de los ensayos clínicos, de los cuales todos establecieron la conclusión de que los ABAP/CSI son una estrategia de tratamiento efectiva en función de los costos para la EPOC moderada a grave (Chuck 2008; Earnshaw 2007; Fattore 2005). Las pruebas indican que la reducción en el uso de recursos de asistencia sanitaria asociado con los ABAP/CSI en comparación con placebo o con los componentes individuales supera el costo adicional de los inhaladores de combinación. Un estudio (Chuck 2008) reveló que este beneficio fue más prominente en los pacientes con enfermedades graves ($39 000 por año de vida ajustado a la calidad [AVAC]) que en los pacientes con enfermedades moderadas y graves combinadas ($47 500 por AVAC).
Karner 2012a planteó inquietudes en cuanto a la seguridad del tiotropio al administrarlo con el inhalador Respimat, que surgieron de las comparaciones indirectas entre los ensayos que utilizaron los dispositivos Respimat y Handihaler. Las pruebas publicadas de un ensayo muy amplio de que los participantes asignados al azar al tiotropio administrado con Respimat o Handihaler no muestran un riesgo mayor de mortalidad al utilizar el inhalador Respimat (Wise 2013).
Calidad de la evidencia
Se evaluó la calidad metodológica de todos los estudios incluidos y se estableció la conclusión de que el riesgo de sesgo generalmente fue bajo en los cinco dominios. Las dudas asociadas con la ocultación de la asignación y el informe de resultado podrían haberse resuelto en parte al establecer contacto con los revisores, aunque debido a que la mayoría de los estudios incluidos ya estaban incluidos en otras revisiones Cochrane, es poco probable que lo anterior aumentara de manera significativa la confianza en los resultados, especialmente debido a que una gran mayoría de los ensayos fueron patrocinados por los fabricantes con los que se ha confirmado la adecuación de los métodos en el pasado. El análisis de sensibilidad con la eliminación de las comparaciones en riesgo alto de sesgo de realización o de detección aumentó aún más la confianza en los hallazgos.
La presuposición de transitividad se mantuvo a través de ambos grupos de datos de resultado. Los ensayos fueron similares en su realización, y cuando se observaron discrepancias (especialmente con la medicación concomitante permitida y los dispositivos de inhalación), las mismas no parecieron diferir sistemáticamente entre los nodos o las clases. Debido a la naturaleza de las comparaciones indirectas, la semejanza en las características iniciales y la metodología justificó el análisis de los ensayos en una red y aumentó la aplicabilidad de los resultados. Los participantes asignados al azar a los brazos de ABAP/CSI presentaban un deterioro levemente mayor de la función pulmonar que los asignados a las otras clases, aunque este hecho no se tradujo en diferencias reales al evaluar la transitividad a través de las comparaciones por pares entre las clases. La presencia de varios ensayos amplios con brazos múltiples permitió la combinación de las pruebas indirectas obtenidas a través de los comparadores comunes con una buena cantidad de datos de comparaciones directas dentro y a través de las clases, lo cual aumentó la confiabilidad de los hallazgos de la red.
Sesgos potenciales en el proceso de revisión
Al incluir estudios de revisiones Cochrane existentes y realizar búsquedas electrónicas adicionales, tanto para actualizar los datos como para llenar los vacíos no cubiertos por otras revisiones, es probable que la bibliografía relevante haya sido cubierta por esta revisión. Alrededor del 80% de los estudios incluidos en esta revisión ya habían estado incluidos en otra revisión Cochrane y por lo tanto el riesgo de sesgo ya había sido evaluado y los datos extraídos por dos revisores. No fue posible establecer contacto con los revisores para solicitar datos adicionales, aunque se pudieron extraer e incluir datos para la gran mayoría de los estudios que midieron los resultados.
Acuerdos y desacuerdos con otros estudios o revisiones
Se han publicado varios metanálisis de redes recientes de los tratamientos para la EPOC con diferentes criterios de inclusión y resultados. Decramer 2013 y Dong 2013 se centraron en los resultados de seguridad e incluyeron sólo los estudios a más largo plazo de al menos seis meses de duración. Decramer 2013 incluyó sólo el tratamiento con ABAP y no encontró ninguna asociación entre los ABAP y un aumento de los eventos adversos o la mortalidad relacionados con la EPOC. Además, el "tratamiento con ABAP generalmente se asoció con reducciones significativas o numéricas en las exacerbaciones de la EPOC en comparación con placebo," lo cual está de acuerdo con los efectos de los ABAP observados en la revisión. Dong 2013 tuvo criterios de inclusión muy similares a los de esta red y se centró en la mortalidad. Junto con los hallazgos sobre la eficacia aditiva de la combinación de ABAP/CSI, la red de Dong 2013 aportó pruebas de que "los ABAP‐CSI se asociaron con el menor riesgo de muerte entre todos los tratamientos" y de que "no se observó un exceso de riesgo para el HandiHaler con tiotropio o los ABAP". Estas revisiones aportan pruebas comparativas en relación con la seguridad, especialmente Dong 2013, que incluyó una red similar de tratamientos y enumeró criterios similares de inclusión a ensayos.
Cope 2012 incluyó una lista similar de tratamientos de la EPOC en su red y evaluó la eficacia mediante el uso de resultados similares en escalas de plazos más cortos (SGRQ y función pulmonar a los tres meses). Aunque se centró en el indacaterol, sus conclusiones con respecto a la eficacia en comparación con los ABAP más antiguos estuvieron en consonancia con los hallazgos. De igual manera, un metanálisis de redes posterior que incluyó el glicopirronio pero no las combinaciones de ABAP/CSI (Cope 2013) estableció la conclusión de que el indacaterol, el glicopirronio y el tiotropio fueron los broncodilatadores más favorables (sobre la base de las pruebas del SGRQ y el VEF1 a los tres meses y a los seis meses). Aunque estos tratamientos se encontraron entre los mejores ABAP y AMAP, las diferencias entre los dos metanálisis de redes (es decir la lista de tratamientos incluidos, los puntos temporales y el modelo de análisis) explican las discrepancias en las conclusiones.
Con respecto a otros resultados importantes, un metanálisis de redes de Puhan 2009 que se centra en las exacerbaciones y las mismas clases de tratamiento encontró que "no hubo pruebas de que un régimen con un único fármaco inhalado sea más efectivo que otro para reducir las exacerbaciones". Los autores también establecieron la conclusión de que los corticosteroides inhalados cuando se los agrega a los agonistas beta de acción prolongada reducen las exacerbaciones sólo en los pacientes con EPOC que presentan un VEF1 ≤ 40%." Debido a cuestiones relacionadas con la conectividad de la red, no se consideró razonable analizar los grupos de datos con gravedad inicial como una covariable, aunque Puhan 2009 plantea la pregunta de si determinados tratamientos pueden ser más beneficiosos o pueden causar diferentes efectos adversos para grupos de pacientes concretos.

Study flow diagram.
aAll 58 studies identified in the review search were also identified in the electronic database search.
Abbreviations: CDSR = Cochrane Database of Systematic Reviews.

Network structures for both outcomes at six months.

Risk of bias summary: review authors' judgements about each risk of bias item for each included study.
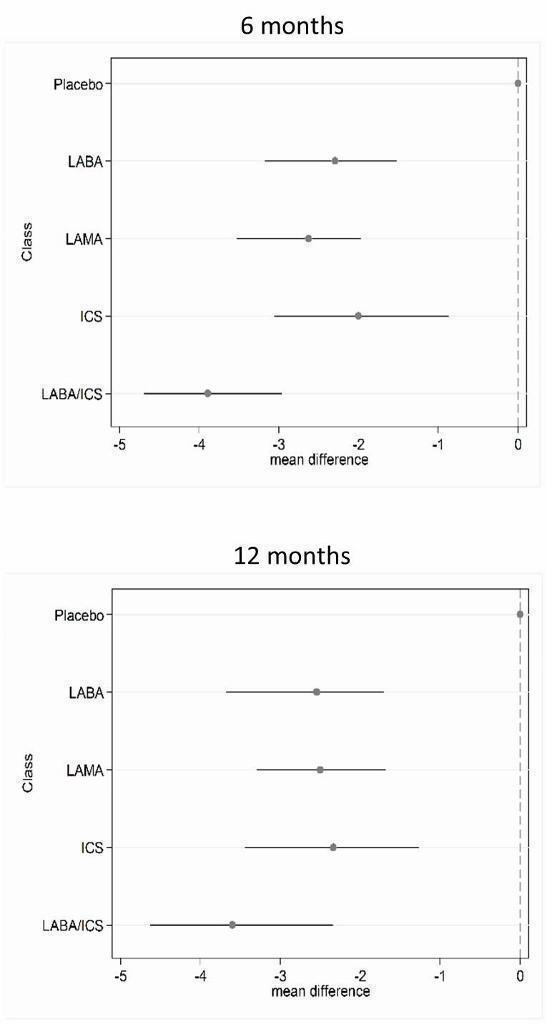
St George's Respiratory Questionnaire (SGRQ) change from baseline—six‐month and 12‐month class results.

Trough forced expiratory volume in one second (FEV1) change from baseline—six‐month and 12‐month class results.
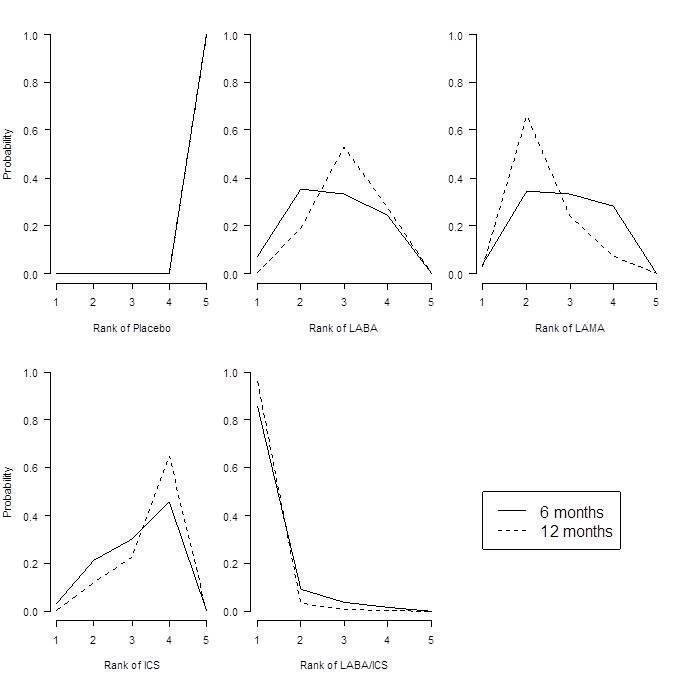
St George's Respiratory Questionnaire (SGRQ) probability ranking diagrams—six months and 12 months.

Forced expiratory volume in one second (FEV1) probability ranking diagrams—six months and 12 months.
| Study ID | Weeks | Arms includeda | N | Ageb | % male | % pred FEV1b | Pack‐yearsb |
| 24 | tiotropium, placebo | 856 | 64.2 | 64.9 | 43.3 | 46.9 | |
| 52 | aclidinium, placebo | 843 | 62.4 | 78.6 | 53.9 | 39.9 | |
| 52 | aclidinium, placebo | 804 | 65.1 | 63.0 | 50.3 | 57.9 | |
| 52 | salmeterol, salmeterol/fluticasone | 797 | 65.4 | 54 | 34.0 | 57.2 | |
| 24 | aclidinium (2), placebo | 828 | 62.4 | 67.4 | 52.5 | 40.2 | |
| 48 | tiotropium, placebo | 3991 | 64.8 | 77.6 | 39.9 | 46 | |
| 48 | tiotropium (2), placebo | 1990 | 65.0 | 74.2 | 37.7 | nr | |
| 26 | indacaterol, tiotropium, glycopyrronium, placebo | 1667 | 64.0 | 74.9 | 55.0 | nr | |
| 26 | budesonide, placebo | 79 | 66 | 78.6 | 36.5 | 51 | |
| 26 | salmeterol, tiotropium, placebo | 1207 | 64.2 | 76.3 | 38.5 | 43.8 | |
| 156 | fluticasone, placebo | 751 | 63.8 | 74.6 | 50.2 | 44 | |
| 52 | formoterol, budesonide, formoterol/budesonide, placebo | 1122 | 64 | 76 | 36 | 39 | |
| 52 | salmeterol, fluticasone, salmeterol/fluticasone, placebo | 1466 | 63.2 | 72.5 | 44.7 | 42.3 | |
| 52 | mometasone, placebo | 631 | nr | nr | 47 | nr | |
| 156 | salmeterol, fluticasone, salmeterol/fluticasone, placebo | 6185 | 65.0 | 75.8 | 44.0 | 48.5 | |
| 52 | mometasone (2), placebo | 911 | 65.1 | 68.3 | 42.3 | nr | |
| 48 | formoterol, formoterol/budesonide | 718 | 63.9 | 81.3 | 42.4 | 38.8 | |
| 26 | formoterol, placebo | 432 | 55 | 67 | 53.6 | 37 | |
| 52 | tiotropium, placebo | 921 | 65 | 65.0 | 38.7 | 61.4 | |
| 48 | tiotropium, placebo | 913 | 66.8 | 59.7 | 39.4 | 50.6 | |
| 104 | tiotropium, placebo | 519 | 64.6 | 77.3 | 38.2 | 51.7 | |
| 52 | formoterol, placebo | 867 | 63.5 | 31.9 | 51.7 | 40.8 | |
| 52 | salmeterol, salmeterol/fluticasone, placebo | 18 | nr | 83.3 | 50.0 | 41.4 | |
| 26 | formoterol, mometasone, formoterol/mometasone (2), placebo | 1196 | 59.7 | 75.2 | 38.6 | 45.1 | |
| 26 | indacaterol (2), tiotropium, placebo | 1683 | 63.6 | 62.8 | 55.6 | 49.7 | |
| 48 | tiotropium, placebo | 1010 | 64.7 | 88 | 47.9 | nr | |
| 52 | tiotropium, salmeterol/fluticasone | 126 | 62.5 | 73.8 | nr | nr | |
| 52 | salmeterol, salmeterol/fluticasone | 782 | 64.9 | 55 | 32.8 | 56.5 | |
| 26 | fluticasone (2), placebo | 640 | 64.4 | 68.8 | nr | nr | |
| 52 | aclidinium (2) | 605 | nr | nr | 46.5 | nr | |
| 26 | glycopyrronium, placebo | 822 | 63.9 | 81.8 | 54.6 | 44.8 | |
| 52 | glycopyrronium, tiotropium, placebo | 1066 | 63.6 | 64.2 | 56.0 | 49.1 | |
| 26 | salmeterol, fluticasone, salmeterol/fluticasone, placebo | 723 | 63.9 | 63.1 | 42 | 56.5 | |
| 43 | salmeterol, salmeterol/fluticasone | 994 | 63.9 | 75.8 | 40.4 | 36.9 | |
| 26 | salmeterol, placebo | 339 | 63.3 | 74.7 | 53.3 | 40.3 | |
| 130 | fluticasone (2), salmeterol/fluticasone, placebo | 114 | 61 | 86.6 | 55.3 | 44.3 | |
| 26 | budesonide, placebo | 49 | nr | nr | nr | nr | |
| 26 | salmeterol, fluticasone, salmeterol/fluticasone, placebo | 674 | 63.5 | 65.8 | 41 | 40.8 | |
| 26 | salmeterol, tiotropium | 90 | nr | 91 | nr | nr | |
| 26 | tiotropium, placebo | 1829 | 67.9 | 98.5 | 35.6 | 68.4 | |
| 26 | salmeterol, salmeterol/fluticasone | 639 | nr | nr | nr | nr | |
| 26 | budesonide, placebo | 26 | 65.4 | 69.2 | 59.2 | 45.0 | |
| 26 | fluticasone, placebo | 281 | 63 | 74 | 57 | nr | |
| 156 | budesonide, placebo | 1277 | 52.5 | 72.9 | 76.9 | 39.3 | |
| 52 | tiotropium, placebo | 142 | 66.4 | 62.9 | 50.0 | 55.2 | |
| 104 | budesonide, placebo | 39 | 55 | 100 | 63.5 | nr | |
| 52 | formoterol, budesonide, formoterol/budesonide, placebo | 1964 | 63.2 | 63.9 | 39.6 | 40 (med) | |
| 52 | formoterol (2), placebo | 645 | 62.7 | 83.3 | nr | nr | |
| 156 | fluticasone, placebo | 190 | 59.0 | 70.5 | 64.5 | 28.3 | |
| 26 | salmeterol, salmeterol/fluticasone | 1050 | 63.6 | 77.8 | nr | nr | |
| 52 | salmeterol/fluticasone, fluticasone, placebo | 387 | 64.8 | 82 | nr | nr | |
| 156 | salmeterol, salmeterol/fluticasone | 186 | 65.7 | 61.3 | nr | nr | |
| 26 | budesonide, placebo | 26 | 60.5 | 53.5 | nr | nr | |
| 104+ | budesonide, placebo | 254 | 63.6 | 58.3 | 52 | 56 | |
| 52 | formoterol, budesonide/formoterol (2) | 1219 | 63.0 | 62.0 | 37.7 | 44.3 | |
| 26 | salmeterol, placebo | 34 | 63.8 | 88.3 | nr | nr | |
| 64 | tiotropium (OL), glycopyrronium | 1483 | 63.4 | 74.1 | nr | nr | |
| 52 | formoterol, budesonide, formoterol/budesonide, placebo | 812 | 64 | 78.8 | 36.2 | 44.5 | |
| 26 | formoterol, budesonide, formoterol/budesonide (3), placebo | 1704 | 63.4 | 66.9 | 39.9 | 40 (med) | |
| 208 | tiotropium, placebo | 5993 | 64.5 | 74.7 | 39.4 | 48.7 | |
| 26 | formoterol, mometasone, formoterol/mometasone (2), placebo | 1055 | 59.8 | 77.5 | nr | 40.4 | |
| 52 | salmeterol, indacaterol | 186 | 69.1 | nr | 53 | nr | |
| 39 | tiotropium, placebo | 554 | 64.2 | 86.1 | 46.9 | 43.7 | |
| 24 | tiotropium, placebo | 457 | 61.8 | 68.4 | nr | nr | |
| 26 | fluticasone, placebo | 23 | 55 | 82.3 | 63.5 | 25.5 | |
| 156 | budesonide, placebo | 290 | 59.1 | 87.5 | 86.6 | nr | |
| 26 | formoterol, tiotropium, placebo | 640 | 62.6 | 77.5 | 51.4 | 38.0 | |
| 52 | salmeterol, tiotropium | 7384 | 62.9 | 74.7 | 49.3 | 38.3 | |
| 104 | tiotropium, salmeterol/fluticasone | 1323 | 64.5 | 82.5 | 39.3 | 40.4 | |
| 24 | salmeterol/fluticasone, placebo | 448 | 66.3 | 88.6 | nr | nr | |
| 24 | budesonide, formoterol/budesonide | 308 | 65.2 | 95.1 | 32.7 | nr | |
| aNumbers in parentheses indicate multiple doses of the same treatment. bAge, % predicted FEV1 and pack‐years smoked are reported as means unless otherwise stated. bid = twice daily. FEV1 = forced expiratory volume in one second. ICS = inhaled corticosteroid. LABA = long‐acting beta2‐agonist. LABA/ICS = long‐acting beta2‐agonist/inhaled corticosteroid combination therapy. LAMA = long‐acting muscarinic antagonist. nr = not reported. PBO = placebo inhaler. qd = once daily. | |||||||
| Comparison | Comparisons | N | Ageb | % male | % FEV1c | Packsd |
| LABA vs placebo | 16 | 13,808 | 62.9 | 74.7 | 46.2 | 42.5 |
| LAMA vs placebo | 15 | 22,406 | 64.2 | 71.3 | 47.1 | 47.5 |
| ICS vs placebo | 10 | 8153 | 63.4 | 74.9 | 41.7 | 42.7 |
| LABA/ICS vs placebo | 10 | 9097 | 63.1 | 75.3 | 39.7 | 42.4 |
| LABA vs LAMA | 2 | 2680 | 63.7 | 69.5 | 55.2 | 49.7 |
| LABA vs ICS | 7 | 6226 | 62.7 | 73.8 | 40.0 | 42.7 |
| LABA vs LABA/ICS | 13 | 12,505 | 63.1 | 71.0 | 38.8 | 43.9 |
| LAMA vs ICS | 0 | ‐ | ‐ | ‐ | ‐ | ‐ |
| LAMA vs LABA/ICS | 1 | 1323 | 64.5 | 82.5 | 39.3 | 40.4 |
| ICS vs LABA/ICS | 10 | 8721 | 62.9 | 75.3 | 38.8 | 42.9 |
| aSummary population data are for all study comparisons excluding those made in the 29 studies that could not be included in either the six‐month or the 12‐month SGRQ network. bAge = mean years. c% FEV1 = mean percentage predicted FEV1. dPacks = mean pack‐years. FEV1 = forced expiratory volume in one second. ICS = inhaled corticosteroid. LABA = long‐acting beta2‐agonist. LABA/ICS = long‐acting beta2‐agonist/inhaled corticosteroid combination therapy. LAMA = long‐acting muscarinic antagonist. SGRQ = St George's Respiratory Questionnaire. | ||||||
| Comparison | Comparisons | N | Ageb | % male | %FEV1c | Packsd |
| LABA vs Placebo | 13 | 8680 | 63.3 | 73.2 | 47.7 | 43.9 |
| LAMA vs Placebo | 16 | 23,111 | 64.3 | 72.2 | 47.6 | 48.9 |
| ICS vs Placebo | 12 | 4574 | 63.6 | 71.9 | 46.2 | 45.2 |
| LABA/ICS vs Placebo | 9 | 4978 | 63.9 | 73.5 | 41.6 | 44.4 |
| LABA vs LAMA | 2 | 2680 | 63.7 | 69.5 | 55.2 | 49.7 |
| LABA vs ICS | 5 | 2506 | 63.6 | 67.1 | 40.6 | 46.7 |
| LABA vs LABA/ICS | 12 | 8005 | 63.7 | 68.8 | 39.9 | 45.8 |
| LAMA vs ICS | 0 | ‐ | ‐ | ‐ | ‐ | ‐ |
| LAMA vs LABA/ICS | 0 | ‐ | ‐ | ‐ | ‐ | ‐ |
| ICS vs LABA/ICS | 8 | 4560 | 63.6 | 71.7 | 39.0 | 45.5 |
| aSummary population data are for all study comparisons excluding those made in the 23 studies that could not be included in either the six‐month or the 12‐month FEV1 network; all doses are given in micrograms. bAge = mean years. c% FEV1 = mean percentage predicted FEV1. dPacks = mean pack‐years. FEV1 = forced expiratory volume in one second. ICS = inhaled corticosteroid. LABA = long‐acting beta2‐agonist. LABA/ICS = long‐acting beta2‐agonist/inhaled corticosteroid combination therapy. LAMA = long‐acting muscarinic antagonist. | ||||||
| Study ID | Arm removed | Analyses affected |
| Tiotropium 18 mcg | SGRQ6m, FEV6m | |
| Tiotropium 18 mcg | SGRQ6m, FEV6m | |
| Tiotropium 18 mcg | SGRQ6m, FEV6m, SGRQ12m, FEV12m | |
| Whole study (2 arms) | SGRQ6m, FEV6m, SGRQ12m, FEV12m | |
| Tiotropium 18 mcg | Did not appear in analyses | |
| FEV = forced expiratory volume in one second SGRQ = St George's Respiratory Questionnaire 6m = six month analysis 12m = 12 month analysis | ||
| Effect vs placebo | Effect vs placebo | Rank | ||||||
| Class | Median | 95% CrI | Median | 95% CrI | Mean | Median | 95% CrI | Pr (best) |
| LABA/ICS | ‐3.89 | (‐4.70 to ‐2.97) | ‐3.89 | (‐4.66 to ‐3.05) | 1.0 | 1 | (1 to 2) | 0.96 |
| LAMA | ‐2.63 | (‐3.53 to ‐1.97) | ‐2.78 | (‐3.58 to ‐2.13) | 2.4 | 2 | (1 to 4) | 0.03 |
| LABA | ‐2.29 | (‐3.18 to ‐1.53) | ‐2.09 | (‐2.93 to ‐1.36) | 3.1 | 3 | (2 to 4) | 0.01 |
| ICS | ‐2.00 | (‐3.06 to ‐0.87) | ‐1.96 | (‐2.99 to ‐0.91) | 3.5 | 4 | (2 to 4) | 0.00 |
| aFor effects versus placebo, smaller values indicate larger benefits of the active treatment; all doses are given in micrograms. Crl = credible interval. SGRQ = St George's Respiratory Questionnaire. ICS = inhaled corticosteroid. LABA = long‐acting beta2‐agonist. LABA/ICS = long‐acting beta2‐agonist/inhaled corticosteroid. LAMA = long‐acting antimuscarinic antagonist. NWMA = network meta‐analysis. Pr = probability. | ||||||||
| Rank (from class NWMA) | Effect vs placebo | Effect vs placebo | Rank (from class NWMA) | ||||||
| Class | Treatment (number daily doses) | Median | 95% CrI | Median | 95% CrI | Mean | Median | 95% CrI | Pr (best) |
| LABA | Form 12 (2) | ‐1.84 | (‐2.60 to ‐0.94) | ‐1.20 | (‐2.10 to ‐0.30) | 14.9 | 15 | (10 to 17) | 0.00 |
| Ind 300 (1) | ‐2.38 | (‐3.63 to ‐1.44) | ‐3.10 | (‐4.86 to ‐1.36) | 11.3 | 12 | (5 to 17) | 0.00 | |
| Ind 150 (1) | ‐2.75 | (‐3.95 to ‐1.85) | ‐3.67 | (‐4.76 to ‐2.58) | 8.7 | 8 | (3 to 16) | 0.01 | |
| Salm 50 (2) | ‐2.20 | (‐2.98 to ‐1.43) | ‐2.27 | (‐3.27 to ‐1.27) | 12.9 | 13 | (7 to 17) | 0.00 | |
| LAMA | Tio 5 (1) | ‐2.50 | (‐3.16 to ‐1.86) | ‐2.42 | (‐3.20 to ‐1.63) | 10.5 | 10 | (6 to 16) | 0.00 |
| Tio 18 (1) | ‐2.53 | (‐3.12 to ‐1.97) | ‐2.66 | (‐3.33 to ‐1.99) | 10.3 | 10 | (6 to 15) | 0.00 | |
| Acl 200 (2) | ‐2.66 | (‐4.04 to ‐1.70) | ‐3.79 | (‐6.14 to ‐1.45) | 9.1 | 9 | (2 to 16) | 0.01 | |
| Acl 400 (2) | ‐2.81 | (‐4.40 to ‐1.90) | ‐4.59 | (‐6.94 to ‐2.23) | 7.9 | 7 | (1 to 15) | 0.03 | |
| Gly 50 (1) | ‐2.63 | (‐3.42 to ‐1.94) | ‐2.83 | (‐3.74 to ‐1.91) | 9.5 | 9 | (5 to 15) | 0.00 | |
| ICS | Bud 400 (2) | ‐1.76 | (‐2.82 to ‐0.55) | ‐0.97 | (‐2.32 to 0.38) | 14.9 | 16 | (7 to 17) | 0.00 |
| Flut 500 (2) | ‐1.95 | (‐3.07 to ‐0.74) | ‐1.71 | (‐3.40 to ‐0.01) | 13.9 | 15 | (6 to 17) | 0.00 | |
| Mom 400 (2) | ‐2.28 | (‐3.51 to ‐1.19) | ‐2.77 | (‐4.47 to ‐1.09) | 11.9 | 13 | (5 to 17) | 0.00 | |
| LABA/ICS | Form‐bud 12/160 (2) | ‐4.04 | (‐4.91 to ‐3.15) | ‐3.85 | (‐4.99 to ‐2.70) | 2.6 | 2 | (1 to 6) | 0.29 |
| Form‐bud 12/320 (2) | ‐3.80 | (‐4.63 to ‐2.84) | ‐3.31 | (‐4.39 to ‐2.22) | 3.9 | 4 | (1 to 9) | 0.10 | |
| Form‐mom 12/200 (2) | ‐3.85 | (‐4.82 to ‐2.66) | ‐3.45 | (‐5.17 to ‐1.74) | 3.7 | 4 | (1 to 10) | 0.15 | |
| Form‐mom 12/400 (2) | ‐3.75 | (‐4.72 to ‐2.48) | ‐3.09 | (‐4.81 to ‐1.37) | 4.3 | 4 | (1 to 11) | 0.10 | |
| Salm‐flut 50/500 (2) | ‐4.05 | (‐4.97 to ‐3.18) | ‐4.36 | (‐5.60 to ‐3.12) | 2.6 | 2 | (1 to 6) | 0.31 | |
| aFor effects versus placebo, smaller values indicate larger benefits of the active treatment; all doses are given in micrograms. Crl = credible interval. SGRQ = St George's Respiratory Questionnaire. ICS = inhaled corticosteroid. LABA = long‐acting beta2‐agonist. LABA/ICS = long‐acting beta2‐agonist/inhaled corticosteroid. LAMA = long‐acting antimuscarinic antagonist. NWMA = network meta‐analysis. Pr = probability. | |||||||||
| Effect vs placebo | Effect vs placebo | Rank | ||||||
| Class | Median | 95% CrI | Median | 95% CrI | Mean | Median | 95% CrI | Pr (best) |
| LABA/ICS | 133.30 | (100.60 to 164.00) | 132.80 | (98.93 to 165.60) | 1.1 | 1 | (1 to 2) | 0.9 |
| LAMA | 103.50 | (81.78,124.90) | 103.60 | (79.01 to 126.60) | 2.4 | 2 | (1 to 3) | 0.1 |
| LABA | 99.44 | (71.98,127.80) | 99.86 | (70.41 to 130.50) | 2.6 | 3 | (1 to 4) | 0.0 |
| ICS | 65.36 | (33.06,96.91) | 65.52 | (31.23 to 97.16) | 3.9 | 4 | (3 to 4) | 0.0 |
| aFor effects versus placebo, smaller values indicate larger benefits of the active treatment; all doses are given in micrograms. Crl = credible interval. FEV1 = forced expiratory volume in one second. ICS = inhaled corticosteroid. LABA = long‐acting beta2‐agonist. LABA/ICS = long‐acting beta2‐agonist/inhaled corticosteroid. LAMA = long‐acting antimuscarinic antagonist. NWMA = network meta‐analysis. Pr = probability. | ||||||||
| Effect vs placebo | Effect vs placebo | Rank (from class NWMA) | |||||||
| Class | Treatment (number daily doses) | Median | 95% CrI | Median | 95% CrI | Mean | Median | 95% CrI | Pr (best) |
| LABA | Form 12 (2) | 94.88 | (60.70 to 122.80) | 53.92 | (13.00 to 94.07) | 12.0 | 13 | (5 to 18) | 0.00 |
| Ind 300 (1) | 103.30 | (71.95 to 150.10) | 137.90 | (63.69 to 209.90) | 9.5 | 10 | (2 to 16) | 0.02 | |
| Ind 150 (1) | 99.53 | (72.32 to 127.20) | 100.70 | (65.74 to 133.80) | 10.8 | 12 | (4 to 16) | 0.00 | |
| Salm 50 (2) | 101.00 | (73.39 to 130.70) | 114.70 | (75.96 to 149.30) | 10.3 | 11 | (4 to 16) | 0.00 | |
| LAMA | Tio 5 (1) | 105.40 | (81.87 to 131.80) | 110.50 | (73.82 to 145.40) | 8.9 | 9 | (3 to 15) | 0.01 |
| Tio 10 (1) | 106.40 | (79.80 to 142.00) | 121.00 | (62.88 to 175.20) | 8.6 | 8 | (2 to 15) | 0.02 | |
| Tio 18 (1) | 105.20 | (85.54 to 125.50) | 107.00 | (82.93 to 129.50) | 9.0 | 9 | (4 to 15) | 0.00 | |
| Acl 200 (1) | 98.83 | (59.06 to 123.20) | 59.31 | (9.47 to 107.90) | 11.3 | 11 | (5 to 18) | 0.00 | |
| Acl 200 (2) | 100.60 | (65.20 to 127.10) | 74.82 | (11.81 to 134.20) | 10.7 | 11 | (4 to 17) | 0.00 | |
| Acl 400 (2) | 107.30 | (80.93 to 143.50) | 108.80 | (45.06 to 168.30) | 8.2 | 8 | (2 to 15) | 0.02 | |
| Gly 50 (1) | 103.60 | (79.83 to 127.50) | 101.50 | (67.86 to 133.40) | 9.5 | 10 | (3 to 15) | 0.00 | |
| ICS | Bud 400 (2) | 61.89 | (23.86 to 94.06) | 14.59 | (‐29.22 to 58.25) | 17.6 | 18 | (14 to 19) | 0.00 |
| Bud 750+ (2) | 63.10 | (14.75 to 99.65) | ‐2.26 | (‐95.77 to 91.34) | 17.3 | 18 | (12 to 19) | 0.00 | |
| Flut 250 (2) | 66.78 | (34.19 to 101.10) | 76.18 | (29.36 to 122.30) | 16.9 | 17 | (11 to 19) | 0.00 | |
| Flut 500 (2) | 72.16 | (40.20 to 109.80) | 97.04 | (54.90 to 138.40) | 15.9 | 16 | (8 to 19) | 0.00 | |
| LABA/ICS | Form‐bud 12/160 (2) | 131.10 | (91.65 to 164.00) | 80.84 | (26.99 to 132.70) | 3.9 | 3 | (1 to 13) | 0.16 |
| Form‐bud 12/320 (2) | 127.30 | (85.14 to 159.50) | 72.77 | (28.75 to 116.70) | 4.7 | 4 | (1 to 14) | 0.11 | |
| Salm‐flut 50/250 (2) | 139.70 | (106.20 to 182.90) | 173.00 | (116.20 to 226.40) | 2.4 | 2 | (1 to 8) | 0.39 | |
| Salm‐flut 50/500 (2) | 137.10 | (104.40 to 172.10) | 152.40 | (104.10 to 197.80) | 2.8 | 2 | (1 to 9) | 0.26 | |
| aFor effects versus placebo, bigger values indicate larger benefits of the active treatment; all doses are given in micrograms. Crl = credible interval. FEV1 = forced expiratory volume in one second. ICS = inhaled corticosteroid. LABA = long‐acting beta2‐agonist. LABA/ICS = long‐acting beta2‐agonist/inhaled corticosteroid. LAMA = long‐acting antimuscarinic antagonist. NWMA = network meta‐analysis. Pr = probability. | |||||||||