Tratamiento por inhalación de acción prolongada (agonistas beta, anticolinérgicos y esteroides) para la EPOC: un metanálisis de redes
Información
- DOI:
- https://doi.org/10.1002/14651858.CD010844.pub2Copiar DOI

- Base de datos:
-
- Cochrane Database of Systematic Reviews
- Versión publicada:
-
- 26 marzo 2014see what's new
- Tipo:
-
- Intervention
- Etapa:
-
- Review
- Grupo Editorial Cochrane:
-
Grupo Cochrane de Vías respiratorias
- Copyright:
-
- Copyright © 2014 The Cochrane Collaboration. Published by John Wiley & Sons, Ltd.
Cifras del artículo
Altmetric:
Citado por:
Autores
Contributions of authors
Kayleigh Kew extracted data, assessed trials for methodological quality and otherwise constructed the review. Sofia Dias conducted the network meta‐analyses and constructed figures. Chris Cates assisted with statistical issues and clinical interpretation of the results. All authors contributed to the writing of the review.
Sources of support
Internal sources
-
No sources of support supplied
External sources
-
Kayleigh Kew, UK.
NIHR, Programme grant funding
-
Christopher Cates, UK.
NIHR, Programme grant funding
Declarations of interest
None known.
Acknowledgements
We are grateful to Elizabeth Stovold for her help in designing the search strategy.
Milo Puhan was the Editor for this review and commented critically on the review.
CRG Funding Acknowledgement: The National Institute for Health Research (NIHR) is the largest single funder of the Cochrane Airways Group.
Disclaimer: The views and opinions expressed therein are those of the authors and do not necessarily reflect those of the NIHR, NHS or the Department of Health.
Version history
| Published | Title | Stage | Authors | Version |
| 2014 Mar 26 | Long‐acting inhaled therapy (beta‐agonists, anticholinergics and steroids) for COPD: a network meta‐analysis | Review | Kayleigh M Kew, Sofia Dias, Christopher J Cates | |
| 2013 Dec 02 | Long‐acting inhaled therapy (beta‐agonists, anticholinergics and steroids) for COPD: a network meta‐analysis | Protocol | Kayleigh M Kew, Tianjing Li | |
Differences between protocol and review
We did not perform a formal cost‐effectiveness analysis and instead presented a summary in the discussion. We did not systematically contact trial authors to ask for additional data or risk of bias, and two review authors did not independently extract data. So as not to delay publication, data and risk of bias were cross‐checked in studies with extraction in previous reviews by one review author (KMK), and discrepancies were resolved by a second review author (CJC). The objective "How does combining different pharmacological treatments affect the long‐term efficacy?" was not addressed and so was removed.
Keywords
MeSH
Medical Subject Headings (MeSH) Keywords
- Adrenal Cortex Hormones [therapeutic use];
- Adrenergic beta‐2 Receptor Agonists [therapeutic use];
- Cholinergic Antagonists [therapeutic use];
- DNA‐Binding Proteins;
- Delayed‐Action Preparations [administration & dosage];
- Muscarinic Antagonists [therapeutic use];
- Nuclear Proteins;
- Pulmonary Disease, Chronic Obstructive [*drug therapy];
- Randomized Controlled Trials as Topic;
- Transcription Factors;
Medical Subject Headings Check Words
Female; Humans; Male; Middle Aged;
PICO

Study flow diagram.
aAll 58 studies identified in the review search were also identified in the electronic database search.
Abbreviations: CDSR = Cochrane Database of Systematic Reviews.

Network structures for both outcomes at six months.
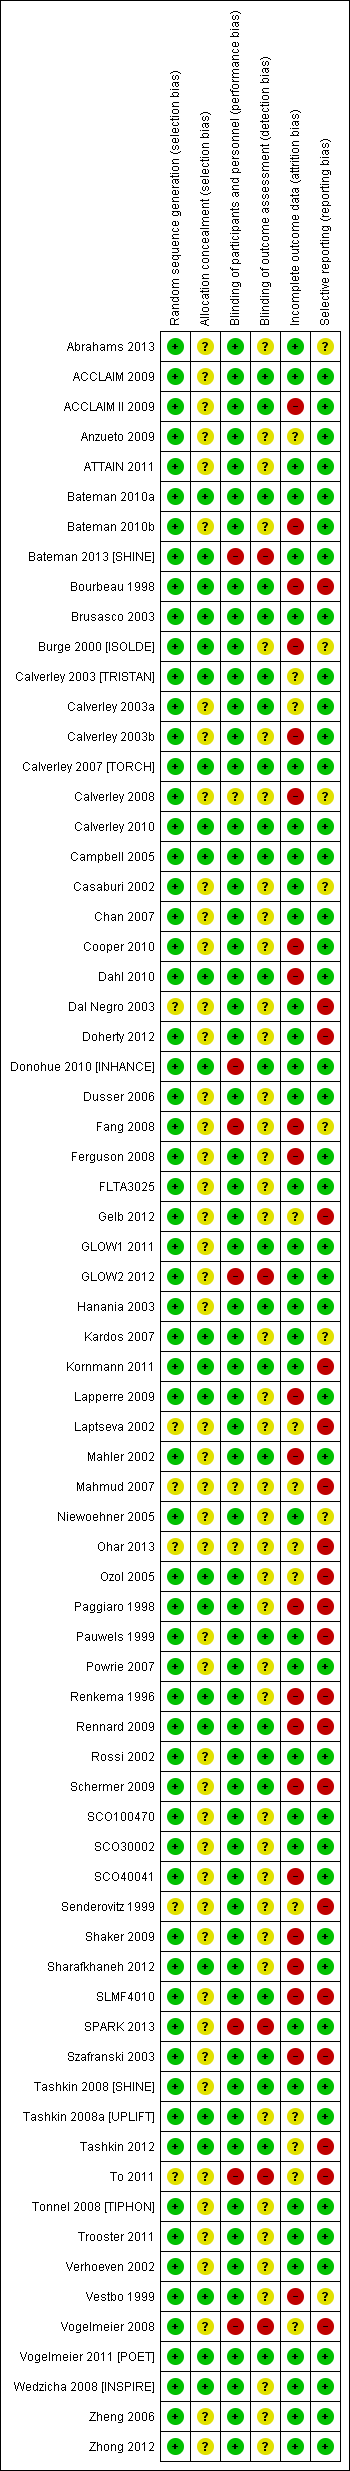
Risk of bias summary: review authors' judgements about each risk of bias item for each included study.
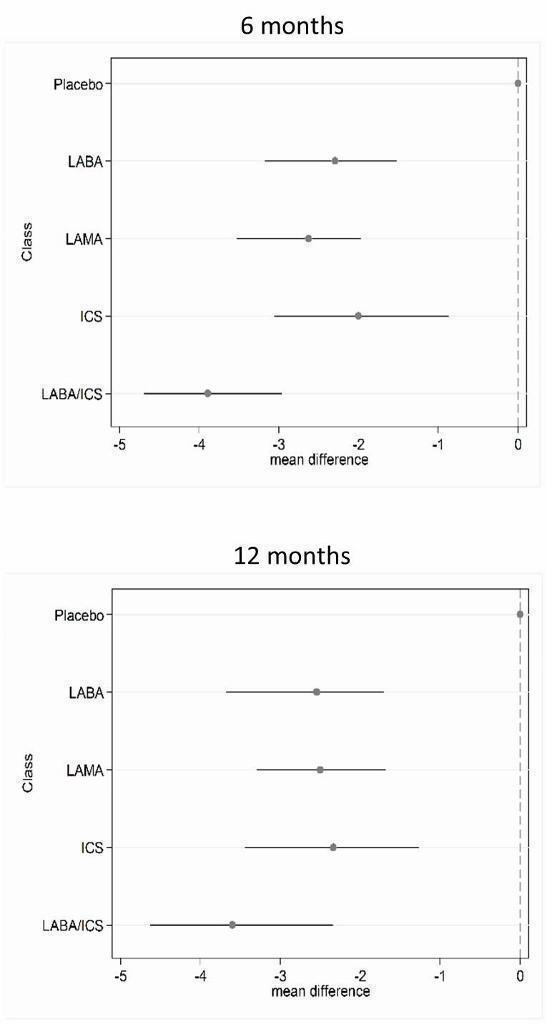
St George's Respiratory Questionnaire (SGRQ) change from baseline—six‐month and 12‐month class results.

Trough forced expiratory volume in one second (FEV1) change from baseline—six‐month and 12‐month class results.
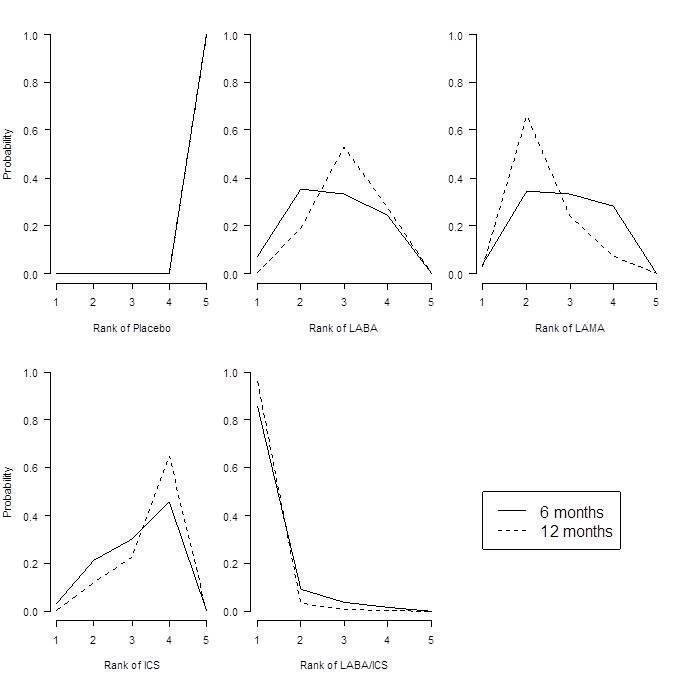
St George's Respiratory Questionnaire (SGRQ) probability ranking diagrams—six months and 12 months.
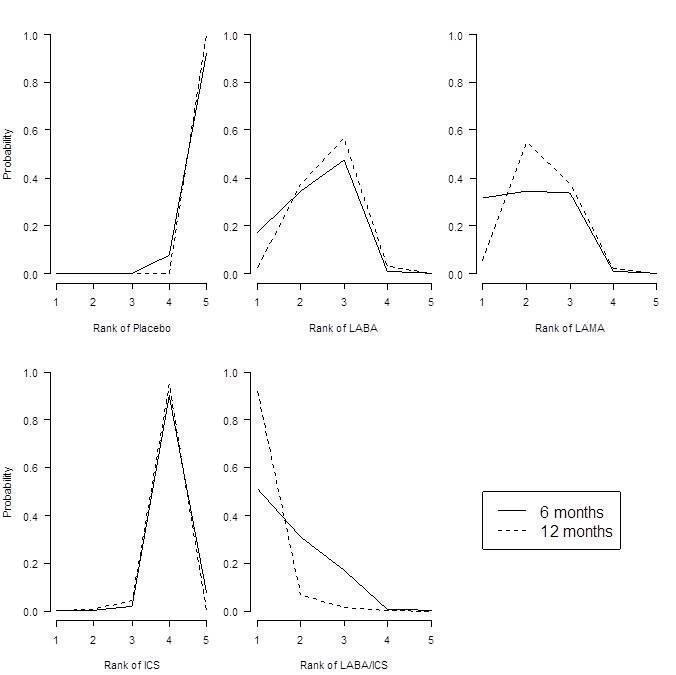
Forced expiratory volume in one second (FEV1) probability ranking diagrams—six months and 12 months.
| Study ID | Weeks | Arms includeda | N | Ageb | % male | % pred FEV1b | Pack‐yearsb |
| 24 | tiotropium, placebo | 856 | 64.2 | 64.9 | 43.3 | 46.9 | |
| 52 | aclidinium, placebo | 843 | 62.4 | 78.6 | 53.9 | 39.9 | |
| 52 | aclidinium, placebo | 804 | 65.1 | 63.0 | 50.3 | 57.9 | |
| 52 | salmeterol, salmeterol/fluticasone | 797 | 65.4 | 54 | 34.0 | 57.2 | |
| 24 | aclidinium (2), placebo | 828 | 62.4 | 67.4 | 52.5 | 40.2 | |
| 48 | tiotropium, placebo | 3991 | 64.8 | 77.6 | 39.9 | 46 | |
| 48 | tiotropium (2), placebo | 1990 | 65.0 | 74.2 | 37.7 | nr | |
| 26 | indacaterol, tiotropium, glycopyrronium, placebo | 1667 | 64.0 | 74.9 | 55.0 | nr | |
| 26 | budesonide, placebo | 79 | 66 | 78.6 | 36.5 | 51 | |
| 26 | salmeterol, tiotropium, placebo | 1207 | 64.2 | 76.3 | 38.5 | 43.8 | |
| 156 | fluticasone, placebo | 751 | 63.8 | 74.6 | 50.2 | 44 | |
| 52 | formoterol, budesonide, formoterol/budesonide, placebo | 1122 | 64 | 76 | 36 | 39 | |
| 52 | salmeterol, fluticasone, salmeterol/fluticasone, placebo | 1466 | 63.2 | 72.5 | 44.7 | 42.3 | |
| 52 | mometasone, placebo | 631 | nr | nr | 47 | nr | |
| 156 | salmeterol, fluticasone, salmeterol/fluticasone, placebo | 6185 | 65.0 | 75.8 | 44.0 | 48.5 | |
| 52 | mometasone (2), placebo | 911 | 65.1 | 68.3 | 42.3 | nr | |
| 48 | formoterol, formoterol/budesonide | 718 | 63.9 | 81.3 | 42.4 | 38.8 | |
| 26 | formoterol, placebo | 432 | 55 | 67 | 53.6 | 37 | |
| 52 | tiotropium, placebo | 921 | 65 | 65.0 | 38.7 | 61.4 | |
| 48 | tiotropium, placebo | 913 | 66.8 | 59.7 | 39.4 | 50.6 | |
| 104 | tiotropium, placebo | 519 | 64.6 | 77.3 | 38.2 | 51.7 | |
| 52 | formoterol, placebo | 867 | 63.5 | 31.9 | 51.7 | 40.8 | |
| 52 | salmeterol, salmeterol/fluticasone, placebo | 18 | nr | 83.3 | 50.0 | 41.4 | |
| 26 | formoterol, mometasone, formoterol/mometasone (2), placebo | 1196 | 59.7 | 75.2 | 38.6 | 45.1 | |
| 26 | indacaterol (2), tiotropium, placebo | 1683 | 63.6 | 62.8 | 55.6 | 49.7 | |
| 48 | tiotropium, placebo | 1010 | 64.7 | 88 | 47.9 | nr | |
| 52 | tiotropium, salmeterol/fluticasone | 126 | 62.5 | 73.8 | nr | nr | |
| 52 | salmeterol, salmeterol/fluticasone | 782 | 64.9 | 55 | 32.8 | 56.5 | |
| 26 | fluticasone (2), placebo | 640 | 64.4 | 68.8 | nr | nr | |
| 52 | aclidinium (2) | 605 | nr | nr | 46.5 | nr | |
| 26 | glycopyrronium, placebo | 822 | 63.9 | 81.8 | 54.6 | 44.8 | |
| 52 | glycopyrronium, tiotropium, placebo | 1066 | 63.6 | 64.2 | 56.0 | 49.1 | |
| 26 | salmeterol, fluticasone, salmeterol/fluticasone, placebo | 723 | 63.9 | 63.1 | 42 | 56.5 | |
| 43 | salmeterol, salmeterol/fluticasone | 994 | 63.9 | 75.8 | 40.4 | 36.9 | |
| 26 | salmeterol, placebo | 339 | 63.3 | 74.7 | 53.3 | 40.3 | |
| 130 | fluticasone (2), salmeterol/fluticasone, placebo | 114 | 61 | 86.6 | 55.3 | 44.3 | |
| 26 | budesonide, placebo | 49 | nr | nr | nr | nr | |
| 26 | salmeterol, fluticasone, salmeterol/fluticasone, placebo | 674 | 63.5 | 65.8 | 41 | 40.8 | |
| 26 | salmeterol, tiotropium | 90 | nr | 91 | nr | nr | |
| 26 | tiotropium, placebo | 1829 | 67.9 | 98.5 | 35.6 | 68.4 | |
| 26 | salmeterol, salmeterol/fluticasone | 639 | nr | nr | nr | nr | |
| 26 | budesonide, placebo | 26 | 65.4 | 69.2 | 59.2 | 45.0 | |
| 26 | fluticasone, placebo | 281 | 63 | 74 | 57 | nr | |
| 156 | budesonide, placebo | 1277 | 52.5 | 72.9 | 76.9 | 39.3 | |
| 52 | tiotropium, placebo | 142 | 66.4 | 62.9 | 50.0 | 55.2 | |
| 104 | budesonide, placebo | 39 | 55 | 100 | 63.5 | nr | |
| 52 | formoterol, budesonide, formoterol/budesonide, placebo | 1964 | 63.2 | 63.9 | 39.6 | 40 (med) | |
| 52 | formoterol (2), placebo | 645 | 62.7 | 83.3 | nr | nr | |
| 156 | fluticasone, placebo | 190 | 59.0 | 70.5 | 64.5 | 28.3 | |
| 26 | salmeterol, salmeterol/fluticasone | 1050 | 63.6 | 77.8 | nr | nr | |
| 52 | salmeterol/fluticasone, fluticasone, placebo | 387 | 64.8 | 82 | nr | nr | |
| 156 | salmeterol, salmeterol/fluticasone | 186 | 65.7 | 61.3 | nr | nr | |
| 26 | budesonide, placebo | 26 | 60.5 | 53.5 | nr | nr | |
| 104+ | budesonide, placebo | 254 | 63.6 | 58.3 | 52 | 56 | |
| 52 | formoterol, budesonide/formoterol (2) | 1219 | 63.0 | 62.0 | 37.7 | 44.3 | |
| 26 | salmeterol, placebo | 34 | 63.8 | 88.3 | nr | nr | |
| 64 | tiotropium (OL), glycopyrronium | 1483 | 63.4 | 74.1 | nr | nr | |
| 52 | formoterol, budesonide, formoterol/budesonide, placebo | 812 | 64 | 78.8 | 36.2 | 44.5 | |
| 26 | formoterol, budesonide, formoterol/budesonide (3), placebo | 1704 | 63.4 | 66.9 | 39.9 | 40 (med) | |
| 208 | tiotropium, placebo | 5993 | 64.5 | 74.7 | 39.4 | 48.7 | |
| 26 | formoterol, mometasone, formoterol/mometasone (2), placebo | 1055 | 59.8 | 77.5 | nr | 40.4 | |
| 52 | salmeterol, indacaterol | 186 | 69.1 | nr | 53 | nr | |
| 39 | tiotropium, placebo | 554 | 64.2 | 86.1 | 46.9 | 43.7 | |
| 24 | tiotropium, placebo | 457 | 61.8 | 68.4 | nr | nr | |
| 26 | fluticasone, placebo | 23 | 55 | 82.3 | 63.5 | 25.5 | |
| 156 | budesonide, placebo | 290 | 59.1 | 87.5 | 86.6 | nr | |
| 26 | formoterol, tiotropium, placebo | 640 | 62.6 | 77.5 | 51.4 | 38.0 | |
| 52 | salmeterol, tiotropium | 7384 | 62.9 | 74.7 | 49.3 | 38.3 | |
| 104 | tiotropium, salmeterol/fluticasone | 1323 | 64.5 | 82.5 | 39.3 | 40.4 | |
| 24 | salmeterol/fluticasone, placebo | 448 | 66.3 | 88.6 | nr | nr | |
| 24 | budesonide, formoterol/budesonide | 308 | 65.2 | 95.1 | 32.7 | nr | |
| aNumbers in parentheses indicate multiple doses of the same treatment. bAge, % predicted FEV1 and pack‐years smoked are reported as means unless otherwise stated. bid = twice daily. FEV1 = forced expiratory volume in one second. ICS = inhaled corticosteroid. LABA = long‐acting beta2‐agonist. LABA/ICS = long‐acting beta2‐agonist/inhaled corticosteroid combination therapy. LAMA = long‐acting muscarinic antagonist. nr = not reported. PBO = placebo inhaler. qd = once daily. | |||||||
| Comparison | Comparisons | N | Ageb | % male | % FEV1c | Packsd |
| LABA vs placebo | 16 | 13,808 | 62.9 | 74.7 | 46.2 | 42.5 |
| LAMA vs placebo | 15 | 22,406 | 64.2 | 71.3 | 47.1 | 47.5 |
| ICS vs placebo | 10 | 8153 | 63.4 | 74.9 | 41.7 | 42.7 |
| LABA/ICS vs placebo | 10 | 9097 | 63.1 | 75.3 | 39.7 | 42.4 |
| LABA vs LAMA | 2 | 2680 | 63.7 | 69.5 | 55.2 | 49.7 |
| LABA vs ICS | 7 | 6226 | 62.7 | 73.8 | 40.0 | 42.7 |
| LABA vs LABA/ICS | 13 | 12,505 | 63.1 | 71.0 | 38.8 | 43.9 |
| LAMA vs ICS | 0 | ‐ | ‐ | ‐ | ‐ | ‐ |
| LAMA vs LABA/ICS | 1 | 1323 | 64.5 | 82.5 | 39.3 | 40.4 |
| ICS vs LABA/ICS | 10 | 8721 | 62.9 | 75.3 | 38.8 | 42.9 |
| aSummary population data are for all study comparisons excluding those made in the 29 studies that could not be included in either the six‐month or the 12‐month SGRQ network. bAge = mean years. c% FEV1 = mean percentage predicted FEV1. dPacks = mean pack‐years. FEV1 = forced expiratory volume in one second. ICS = inhaled corticosteroid. LABA = long‐acting beta2‐agonist. LABA/ICS = long‐acting beta2‐agonist/inhaled corticosteroid combination therapy. LAMA = long‐acting muscarinic antagonist. SGRQ = St George's Respiratory Questionnaire. | ||||||
| Comparison | Comparisons | N | Ageb | % male | %FEV1c | Packsd |
| LABA vs Placebo | 13 | 8680 | 63.3 | 73.2 | 47.7 | 43.9 |
| LAMA vs Placebo | 16 | 23,111 | 64.3 | 72.2 | 47.6 | 48.9 |
| ICS vs Placebo | 12 | 4574 | 63.6 | 71.9 | 46.2 | 45.2 |
| LABA/ICS vs Placebo | 9 | 4978 | 63.9 | 73.5 | 41.6 | 44.4 |
| LABA vs LAMA | 2 | 2680 | 63.7 | 69.5 | 55.2 | 49.7 |
| LABA vs ICS | 5 | 2506 | 63.6 | 67.1 | 40.6 | 46.7 |
| LABA vs LABA/ICS | 12 | 8005 | 63.7 | 68.8 | 39.9 | 45.8 |
| LAMA vs ICS | 0 | ‐ | ‐ | ‐ | ‐ | ‐ |
| LAMA vs LABA/ICS | 0 | ‐ | ‐ | ‐ | ‐ | ‐ |
| ICS vs LABA/ICS | 8 | 4560 | 63.6 | 71.7 | 39.0 | 45.5 |
| aSummary population data are for all study comparisons excluding those made in the 23 studies that could not be included in either the six‐month or the 12‐month FEV1 network; all doses are given in micrograms. bAge = mean years. c% FEV1 = mean percentage predicted FEV1. dPacks = mean pack‐years. FEV1 = forced expiratory volume in one second. ICS = inhaled corticosteroid. LABA = long‐acting beta2‐agonist. LABA/ICS = long‐acting beta2‐agonist/inhaled corticosteroid combination therapy. LAMA = long‐acting muscarinic antagonist. | ||||||
| Study ID | Arm removed | Analyses affected |
| Tiotropium 18 mcg | SGRQ6m, FEV6m | |
| Tiotropium 18 mcg | SGRQ6m, FEV6m | |
| Tiotropium 18 mcg | SGRQ6m, FEV6m, SGRQ12m, FEV12m | |
| Whole study (2 arms) | SGRQ6m, FEV6m, SGRQ12m, FEV12m | |
| Tiotropium 18 mcg | Did not appear in analyses | |
| FEV = forced expiratory volume in one second SGRQ = St George's Respiratory Questionnaire 6m = six month analysis 12m = 12 month analysis | ||
| Effect vs placebo | Effect vs placebo | Rank | ||||||
| Class | Median | 95% CrI | Median | 95% CrI | Mean | Median | 95% CrI | Pr (best) |
| LABA/ICS | ‐3.89 | (‐4.70 to ‐2.97) | ‐3.89 | (‐4.66 to ‐3.05) | 1.0 | 1 | (1 to 2) | 0.96 |
| LAMA | ‐2.63 | (‐3.53 to ‐1.97) | ‐2.78 | (‐3.58 to ‐2.13) | 2.4 | 2 | (1 to 4) | 0.03 |
| LABA | ‐2.29 | (‐3.18 to ‐1.53) | ‐2.09 | (‐2.93 to ‐1.36) | 3.1 | 3 | (2 to 4) | 0.01 |
| ICS | ‐2.00 | (‐3.06 to ‐0.87) | ‐1.96 | (‐2.99 to ‐0.91) | 3.5 | 4 | (2 to 4) | 0.00 |
| aFor effects versus placebo, smaller values indicate larger benefits of the active treatment; all doses are given in micrograms. Crl = credible interval. SGRQ = St George's Respiratory Questionnaire. ICS = inhaled corticosteroid. LABA = long‐acting beta2‐agonist. LABA/ICS = long‐acting beta2‐agonist/inhaled corticosteroid. LAMA = long‐acting antimuscarinic antagonist. NWMA = network meta‐analysis. Pr = probability. | ||||||||
| Rank (from class NWMA) | Effect vs placebo | Effect vs placebo | Rank (from class NWMA) | ||||||
| Class | Treatment (number daily doses) | Median | 95% CrI | Median | 95% CrI | Mean | Median | 95% CrI | Pr (best) |
| LABA | Form 12 (2) | ‐1.84 | (‐2.60 to ‐0.94) | ‐1.20 | (‐2.10 to ‐0.30) | 14.9 | 15 | (10 to 17) | 0.00 |
| Ind 300 (1) | ‐2.38 | (‐3.63 to ‐1.44) | ‐3.10 | (‐4.86 to ‐1.36) | 11.3 | 12 | (5 to 17) | 0.00 | |
| Ind 150 (1) | ‐2.75 | (‐3.95 to ‐1.85) | ‐3.67 | (‐4.76 to ‐2.58) | 8.7 | 8 | (3 to 16) | 0.01 | |
| Salm 50 (2) | ‐2.20 | (‐2.98 to ‐1.43) | ‐2.27 | (‐3.27 to ‐1.27) | 12.9 | 13 | (7 to 17) | 0.00 | |
| LAMA | Tio 5 (1) | ‐2.50 | (‐3.16 to ‐1.86) | ‐2.42 | (‐3.20 to ‐1.63) | 10.5 | 10 | (6 to 16) | 0.00 |
| Tio 18 (1) | ‐2.53 | (‐3.12 to ‐1.97) | ‐2.66 | (‐3.33 to ‐1.99) | 10.3 | 10 | (6 to 15) | 0.00 | |
| Acl 200 (2) | ‐2.66 | (‐4.04 to ‐1.70) | ‐3.79 | (‐6.14 to ‐1.45) | 9.1 | 9 | (2 to 16) | 0.01 | |
| Acl 400 (2) | ‐2.81 | (‐4.40 to ‐1.90) | ‐4.59 | (‐6.94 to ‐2.23) | 7.9 | 7 | (1 to 15) | 0.03 | |
| Gly 50 (1) | ‐2.63 | (‐3.42 to ‐1.94) | ‐2.83 | (‐3.74 to ‐1.91) | 9.5 | 9 | (5 to 15) | 0.00 | |
| ICS | Bud 400 (2) | ‐1.76 | (‐2.82 to ‐0.55) | ‐0.97 | (‐2.32 to 0.38) | 14.9 | 16 | (7 to 17) | 0.00 |
| Flut 500 (2) | ‐1.95 | (‐3.07 to ‐0.74) | ‐1.71 | (‐3.40 to ‐0.01) | 13.9 | 15 | (6 to 17) | 0.00 | |
| Mom 400 (2) | ‐2.28 | (‐3.51 to ‐1.19) | ‐2.77 | (‐4.47 to ‐1.09) | 11.9 | 13 | (5 to 17) | 0.00 | |
| LABA/ICS | Form‐bud 12/160 (2) | ‐4.04 | (‐4.91 to ‐3.15) | ‐3.85 | (‐4.99 to ‐2.70) | 2.6 | 2 | (1 to 6) | 0.29 |
| Form‐bud 12/320 (2) | ‐3.80 | (‐4.63 to ‐2.84) | ‐3.31 | (‐4.39 to ‐2.22) | 3.9 | 4 | (1 to 9) | 0.10 | |
| Form‐mom 12/200 (2) | ‐3.85 | (‐4.82 to ‐2.66) | ‐3.45 | (‐5.17 to ‐1.74) | 3.7 | 4 | (1 to 10) | 0.15 | |
| Form‐mom 12/400 (2) | ‐3.75 | (‐4.72 to ‐2.48) | ‐3.09 | (‐4.81 to ‐1.37) | 4.3 | 4 | (1 to 11) | 0.10 | |
| Salm‐flut 50/500 (2) | ‐4.05 | (‐4.97 to ‐3.18) | ‐4.36 | (‐5.60 to ‐3.12) | 2.6 | 2 | (1 to 6) | 0.31 | |
| aFor effects versus placebo, smaller values indicate larger benefits of the active treatment; all doses are given in micrograms. Crl = credible interval. SGRQ = St George's Respiratory Questionnaire. ICS = inhaled corticosteroid. LABA = long‐acting beta2‐agonist. LABA/ICS = long‐acting beta2‐agonist/inhaled corticosteroid. LAMA = long‐acting antimuscarinic antagonist. NWMA = network meta‐analysis. Pr = probability. | |||||||||
| Effect vs placebo | Effect vs placebo | Rank | ||||||
| Class | Median | 95% CrI | Median | 95% CrI | Mean | Median | 95% CrI | Pr (best) |
| LABA/ICS | 133.30 | (100.60 to 164.00) | 132.80 | (98.93 to 165.60) | 1.1 | 1 | (1 to 2) | 0.9 |
| LAMA | 103.50 | (81.78,124.90) | 103.60 | (79.01 to 126.60) | 2.4 | 2 | (1 to 3) | 0.1 |
| LABA | 99.44 | (71.98,127.80) | 99.86 | (70.41 to 130.50) | 2.6 | 3 | (1 to 4) | 0.0 |
| ICS | 65.36 | (33.06,96.91) | 65.52 | (31.23 to 97.16) | 3.9 | 4 | (3 to 4) | 0.0 |
| aFor effects versus placebo, smaller values indicate larger benefits of the active treatment; all doses are given in micrograms. Crl = credible interval. FEV1 = forced expiratory volume in one second. ICS = inhaled corticosteroid. LABA = long‐acting beta2‐agonist. LABA/ICS = long‐acting beta2‐agonist/inhaled corticosteroid. LAMA = long‐acting antimuscarinic antagonist. NWMA = network meta‐analysis. Pr = probability. | ||||||||
| Effect vs placebo | Effect vs placebo | Rank (from class NWMA) | |||||||
| Class | Treatment (number daily doses) | Median | 95% CrI | Median | 95% CrI | Mean | Median | 95% CrI | Pr (best) |
| LABA | Form 12 (2) | 94.88 | (60.70 to 122.80) | 53.92 | (13.00 to 94.07) | 12.0 | 13 | (5 to 18) | 0.00 |
| Ind 300 (1) | 103.30 | (71.95 to 150.10) | 137.90 | (63.69 to 209.90) | 9.5 | 10 | (2 to 16) | 0.02 | |
| Ind 150 (1) | 99.53 | (72.32 to 127.20) | 100.70 | (65.74 to 133.80) | 10.8 | 12 | (4 to 16) | 0.00 | |
| Salm 50 (2) | 101.00 | (73.39 to 130.70) | 114.70 | (75.96 to 149.30) | 10.3 | 11 | (4 to 16) | 0.00 | |
| LAMA | Tio 5 (1) | 105.40 | (81.87 to 131.80) | 110.50 | (73.82 to 145.40) | 8.9 | 9 | (3 to 15) | 0.01 |
| Tio 10 (1) | 106.40 | (79.80 to 142.00) | 121.00 | (62.88 to 175.20) | 8.6 | 8 | (2 to 15) | 0.02 | |
| Tio 18 (1) | 105.20 | (85.54 to 125.50) | 107.00 | (82.93 to 129.50) | 9.0 | 9 | (4 to 15) | 0.00 | |
| Acl 200 (1) | 98.83 | (59.06 to 123.20) | 59.31 | (9.47 to 107.90) | 11.3 | 11 | (5 to 18) | 0.00 | |
| Acl 200 (2) | 100.60 | (65.20 to 127.10) | 74.82 | (11.81 to 134.20) | 10.7 | 11 | (4 to 17) | 0.00 | |
| Acl 400 (2) | 107.30 | (80.93 to 143.50) | 108.80 | (45.06 to 168.30) | 8.2 | 8 | (2 to 15) | 0.02 | |
| Gly 50 (1) | 103.60 | (79.83 to 127.50) | 101.50 | (67.86 to 133.40) | 9.5 | 10 | (3 to 15) | 0.00 | |
| ICS | Bud 400 (2) | 61.89 | (23.86 to 94.06) | 14.59 | (‐29.22 to 58.25) | 17.6 | 18 | (14 to 19) | 0.00 |
| Bud 750+ (2) | 63.10 | (14.75 to 99.65) | ‐2.26 | (‐95.77 to 91.34) | 17.3 | 18 | (12 to 19) | 0.00 | |
| Flut 250 (2) | 66.78 | (34.19 to 101.10) | 76.18 | (29.36 to 122.30) | 16.9 | 17 | (11 to 19) | 0.00 | |
| Flut 500 (2) | 72.16 | (40.20 to 109.80) | 97.04 | (54.90 to 138.40) | 15.9 | 16 | (8 to 19) | 0.00 | |
| LABA/ICS | Form‐bud 12/160 (2) | 131.10 | (91.65 to 164.00) | 80.84 | (26.99 to 132.70) | 3.9 | 3 | (1 to 13) | 0.16 |
| Form‐bud 12/320 (2) | 127.30 | (85.14 to 159.50) | 72.77 | (28.75 to 116.70) | 4.7 | 4 | (1 to 14) | 0.11 | |
| Salm‐flut 50/250 (2) | 139.70 | (106.20 to 182.90) | 173.00 | (116.20 to 226.40) | 2.4 | 2 | (1 to 8) | 0.39 | |
| Salm‐flut 50/500 (2) | 137.10 | (104.40 to 172.10) | 152.40 | (104.10 to 197.80) | 2.8 | 2 | (1 to 9) | 0.26 | |
| aFor effects versus placebo, bigger values indicate larger benefits of the active treatment; all doses are given in micrograms. Crl = credible interval. FEV1 = forced expiratory volume in one second. ICS = inhaled corticosteroid. LABA = long‐acting beta2‐agonist. LABA/ICS = long‐acting beta2‐agonist/inhaled corticosteroid. LAMA = long‐acting antimuscarinic antagonist. NWMA = network meta‐analysis. Pr = probability. | |||||||||