Tratamiento por inhalación de acción prolongada (agonistas beta, anticolinérgicos y esteroides) para la EPOC: un metanálisis de redes
Appendices
Appendix 1. The Cochrane Library search strategy
#1 MeSH descriptor: [Pulmonary Disease, Chronic Obstructive] explode all trees
#2 MeSH descriptor: [Lung Diseases, Obstructive] this term only
#3 COPD:ti
#4 (obstruct*) near/3 (pulmonary or lung* or airway* or airflow* or bronch* or respirat*):ti
#5 #1 or #2 or #3 or #4
#6 indacaterol
#7 salmeterol
#8 *formoterol
#9 long* near (beta* near agonist*)
#10 budesonide
#11 fluticasone
#12 mometasone
#13 inhal* near (corticosteroid* or steroid*)
#14 tiotropium
#15 aclidinium
#16 Glycopyrronium
#17 long* near muscarinic*
#18 umeclidinium
#19 vilanterol
#20 (LABA or LAMA or ICS):ti,ab
#21 {or #6‐#20}
#22 #5 and #21
Appendix 2. Sources and search methods for the Cochrane Airways Group Specialised Register (CAGR)
Electronic searches: core databases
| Database | Frequency of search |
| CENTRAL (The Cochrane Library) | Monthly |
| MEDLINE (Ovid) | Weekly |
| EMBASE (Ovid) | Weekly |
| PsycINFO (Ovid) | Monthly |
| CINAHL (EBSCO) | Monthly |
| AMED (EBSCO) | Monthly |
Handsearches: core respiratory conference abstracts
| Conference | Years searched |
| American Academy of Allergy, Asthma and Immunology (AAAAI) | 2001 onwards |
| American Thoracic Society (ATS) | 2001 onwards |
| Asia Pacific Society of Respirology (APSR) | 2004 onwards |
| British Thoracic Society Winter Meeting (BTS) | 2000 onwards |
| Chest Meeting | 2003 onwards |
| European Respiratory Society (ERS) | 1992, 1994, 2000 onwards |
| International Primary Care Respiratory Group Congress (IPCRG) | 2002 onwards |
| Thoracic Society of Australia and New Zealand (TSANZ) | 1999 onwards |
MEDLINE search strategy used to identify trials for the CAGR
COPD search
1. Lung Diseases, Obstructive/
2. exp Pulmonary Disease, Chronic Obstructive/
3. emphysema$.mp.
4. (chronic$ adj3 bronchiti$).mp.
5. (obstruct$ adj3 (pulmonary or lung$ or airway$ or airflow$ or bronch$ or respirat$)).mp.
6. COPD.mp.
7. COAD.mp.
8. COBD.mp.
9. AECB.mp.
10. or/1‐9
Filter to identify RCTs
1. exp "clinical trial [publication type]"/
2. (randomised or randomised).ab,ti.
3. placebo.ab,ti.
4. dt.fs.
5. randomly.ab,ti.
6. trial.ab,ti.
7. groups.ab,ti.
8. or/1‐7
9. Animals/
10. Humans/
11. 9 not (9 and 10)
12. 8 not 11
The MEDLINE strategy and the RCT filter are adapted to identify trials in other electronic databases
Appendix 3. Search to retrieve relevant trials from the CAGR
#1 MeSH DESCRIPTOR Pulmonary Disease, Chronic Obstructive Explode All
#2 MeSH DESCRIPTOR Bronchitis, Chronic
#3 (obstruct*) near3 (pulmonary or lung* or airway* or airflow* or bronch* or respirat*)
#4 COPD:MISC1
#5 (COPD OR COAD OR COBD):TI,AB,KW
#6 #1 OR #2 OR #3 OR #4 OR #5
#7 indacaterol or QAB149
#8 salmeterol
#9 *formoterol
#10 long* near (beta* near agonist*)
#11 budesonide
#12 fluticasone
#13 mometasone
#14 inhal* near (corticosteroid* or steroid*)
#15 tiotropium
#16 aclidinium or LAS34273
#17 Glycopyrronium or NVA237
#18 long* near muscarinic*
#19 umeclidinium or GSK573719
#20 vilanterol or GW642444
#21 (LABA or LAMA or ICS):TI,AB
#22 #7 or #8 or #9 or #10 or #11 or #12 or #13 or #14 or #15 or #16 or #17 or #18 or #19 or #20 or #21
#23 #6 and #22
[Note: in search line #4, MISC1 refers to the field in which the record has been coded for condition, in this case, COPD]
Appendix 4. SGRQ class effects versus placebo (12 months)a
| Effect vs placebo | Effect vs placebo | Rank | ||||||
| Class | Median | 95% CrI | Median | 95% CrI | Mean | Median | 95% CrI | Pr (best) |
| LABA/ICS | ‐3.60 | (‐4.63 to ‐2.34) | ‐3.53 | (‐4.69 to ‐2.15) | 1.2 | 1 | (1 to 3) | 0.86 |
| LAMA | ‐2.50 | (‐3.30 to ‐1.68) | ‐2.56 | (‐3.49 to ‐1.69) | 2.9 | 3 | (1 to 4) | 0.04 |
| LABA | ‐2.55 | (‐3.68 to ‐1.70) | ‐2.61 | (‐3.82 to ‐1.68) | 2.8 | 3 | (1 to 4) | 0.07 |
| ICS | ‐2.34 | (‐3.45 to ‐1.27) | ‐2.34 | (‐3.58 to ‐1.16) | 3.2 | 3 | (1 to 4) | 0.03 |
| aFor effects versus placebo, smaller values indicate larger benefits of the active treatment Crl = credible interval. SGRQ = St George's Respiratory Questionnaire. ICS = inhaled corticosteroid. LABA = long‐acting beta2‐agonist. LABA/ICS = long‐acting beta2‐agonist/inhaled corticosteroid. LAMA = long‐acting antimuscarinic antagonist. NWMA = network meta‐analysis. Pr = probability. | ||||||||
Appendix 5. SGRQ individual treatment effects versus placebo (12 months)a
| Effect vs placebo | Rank | ||||||
| Class | Treatment | Median | 95% CrI | Mean | Median | 95% CrI | Pr (best) |
| LABA | Form 12 (2) | ‐2.51 | (‐3.39 to ‐1.73) | 10.7 | 11 | (4 to 17) | 0.00 |
| Form 24 (2) | ‐2.71 | (‐4.43 to ‐1.60) | 8.8 | 8 | (1 to 18) | 0.05 | |
| Ind 300 (1) | ‐2.85 | (‐4.44 to ‐1.77) | 7.8 | 7 | (1 to 17) | 0.06 | |
| Ind 6000 (1) | ‐2.81 | (‐4.38 to ‐1.74) | 8.1 | 7 | (1 to 17) | 0.05 | |
| Salm 50 (2) | ‐1.81 | (‐2.62 to ‐0.92) | 16.0 | 17 | (9 to 18) | 0.00 | |
| LAMA | Tio 5 (1) | ‐2.77 | (‐3.50 to ‐2.08) | 8.1 | 8 | (3 to 15) | 0.00 |
| Tio 10 (1) | ‐2.83 | (‐4.04 to ‐1.92) | 7.6 | 7 | (1 to 16) | 0.03 | |
| Tio 18 (1) | ‐2.15 | (‐2.88 to ‐1.33) | 13.6 | 14 | (6 to 18) | 0.00 | |
| Acl 200 (1) | ‐2.33 | (‐3.28 to ‐1.16) | 12.0 | 12 | (4 to 18) | 0.00 | |
| Acl 200 (2) | ‐2.52 | (‐3.94 to ‐1.08) | 10.3 | 10 | (2 to 18) | 0.02 | |
| Acl 400 (2) | ‐2.49 | (‐3.89 to ‐1.04) | 10.5 | 11 | (2 to 18) | 0.02 | |
| Gly 50 (1) | ‐2.42 | (‐3.31 to ‐1.40) | 11.2 | 11 | (4 to 18) | 0.00 | |
| ICS | Bud 400 (2) | ‐2.33 | (‐3.48 to ‐1.21) | 12.0 | 12 | (4 to 18) | 0.00 |
| Flut 500 (2) | ‐2.16 | (‐2.89 to ‐1.41) | 13.5 | 14 | (6 to 18) | 0.00 | |
| Mom 400 (2) | ‐2.51 | (‐3.97 to ‐1.31) | 10.4 | 11 | (2 to 18) | 0.02 | |
| LABA/ICS | Form‐bud 12/160 (2) | ‐3.45 | (‐4.75 to ‐1.62) | 4.9 | 3 | (1 to 16) | 0.19 |
| Form‐bud 12/320 (2) | ‐3.74 | (‐4.80 to ‐2.70) | 2.6 | 2 | (1 to 8) | 0.35 | |
| Salm‐flut 50/500 (2) | ‐3.58 | (‐4.29 to ‐2.85) | 3.1 | 3 | (1 to 8) | 0.21 | |
| aFor effects versus placebo, smaller values indicate larger benefits of the active treatment. All doses are in micrograms Crl = credible interval. SGRQ = St George's Respiratory Questionnaire. ICS = inhaled corticosteroid. LABA = long‐acting beta2‐agonist. LABA/ICS = long‐acting beta2‐agonist/inhaled corticosteroid. LAMA = long‐acting antimuscarinic antagonist. NWMA = network meta‐analysis. Pr = probability. | |||||||
Appendix 6. FEV1 class effects versus placebo (12 months)a
| Effect vs placebo | Effect vs placebo | Rank | ||||||
| Class | Median | 95% CrI | Median | 95% CrI | Mean | Median | 95% CrI | Pr (best) |
| LABA/ICS | 100.80 | (55.50 to 140.10) | 100.00 | (53.77 to 141.50) | 1.7 | 1 | (1 to 3) | 0.5 |
| LAMA | 92.64 | (56.23 to 129.60) | 94.23 | (56.08 to 134.30) | 2.0 | 2 | (1 to 3) | 0.3 |
| LABA | 87.05 | (47.28 to 130.50) | 86.88 | (46.12 to 132.00) | 2.3 | 2 | (1 to 3) | 0.2 |
| ICS | 28.36 | (‐11.93 to 65.70) | 28.00 | (‐13.34 to 66.90) | 4.1 | 4 | (4 to 5) | 0.0 |
| aFor effects versus placebo, smaller values indicate larger benefits of the active treatment. Crl = credible interval. FEV1 = forced expiratory volume in one second. ICS = inhaled corticosteroid. LABA = long‐acting beta2‐agonist. LABA/ICS = long‐acting beta2‐agonist/inhaled corticosteroid. LAMA = long‐acting antimuscarinic antagonist. NWMA = network meta‐analysis. Pr = probability. | ||||||||
Appendix 7. FEV1 individual treatment effects versus placebo (12 months)a
| Effect vs placebo | Rank | ||||||
| Class | Treatment | Median | 95% CrI | Mean | Median | 95% CrI | Pr (best) |
| LABA | Form 12 (2) | 69.96 | (33.27 to 105.40) | 12.2 | 13 | (6 to 16) | 0.00 |
| Ind 300 (1) | 102.20 | (52.85 to 169.30) | 6.2 | 6 | (1 to 14) | 0.15 | |
| Ind 600 (1) | 99.22 | (51.43 to 162.50) | 6.7 | 6 | (1 to 14) | 0.10 | |
| Salm 50 (2) | 78.73 | (36.65 to 118.20) | 10.6 | 11 | (4 to 15) | 0.00 | |
| LAMA | Tio 5 (1) | 96.90 | (59.78 to 136.30) | 7.0 | 7 | (1 to 14) | 0.04 |
| Tio 10 (1) | 103.00 | (61.53 to 157.10) | 5.8 | 5 | (1 to 13) | 0.13 | |
| Tio 18 (1) | 82.37 | (50.63 to 114.10) | 9.9 | 10 | (3 to 15) | 0.01 | |
| Acl 200 (2) | 87.55 | (28.91 to 138.30) | 8.9 | 9 | (1 to 16) | 0.03 | |
| Acl 400 (2) | 97.26 | (48.15 to 159.00) | 6.8 | 6 | (1 to 14) | 0.10 | |
| Gly 50 (1) | 91.43 | (51.93 to 130.90) | 8.0 | 8 | (1 to 14) | 0.03 | |
| ICS | Bud 400 (2) | 25.02 | (‐23.30 to 66.78) | 16.7 | 17 | (13 to 19) | 0.00 |
| Bud 750+ (2) | 24.02 | (‐31.55 to 68.90) | 16.8 | 17 | (13 to 19) | 0.00 | |
| Flut 500 (2) | 27.04 | (‐9.27 to 61.93) | 16.5 | 17 | (14 to 19) | 0.00 | |
| Mom 400 (2) | 38.89 | (‐3.13 to 87.00) | 15.2 | 15 | (9 to 18) | 0.00 | |
| LABA/ICS | Form‐bud 12/160 (2) | 99.60 | (56.01 to 139.80) | 6.4 | 6 | (1 to 14) | 0.07 |
| Form‐bud 12/320 (2) | 105.00 | (66.88 to 141.80) | 5.3 | 5 | (1 to 12) | 0.11 | |
| Salm‐flut 50/250 (2) | 102.10 | (35.97 to 158.80) | 6.3 | 5 | (1 to 15) | 0.14 | |
| Salm‐flut 50/500 (2) | 100.50 | (59.29 to 138.70) | 6.2 | 6 | (1 to 13) | 0.08 | |
| aFor effects versus placebo, smaller values indicate larger benefits of the active treatment. All doses are in micrograms. Crl = credible interval. FEV1 = forced expiratory volume in one second. ICS = inhaled corticosteroid. LABA = long‐acting beta2‐agonist. LABA/ICS = long‐acting beta2‐agonist/inhaled corticosteroid. LAMA = long‐acting antimuscarinic antagonist. NWMA = network meta‐analysis. Pr = probability. | |||||||

Study flow diagram.
aAll 58 studies identified in the review search were also identified in the electronic database search.
Abbreviations: CDSR = Cochrane Database of Systematic Reviews.

Network structures for both outcomes at six months.
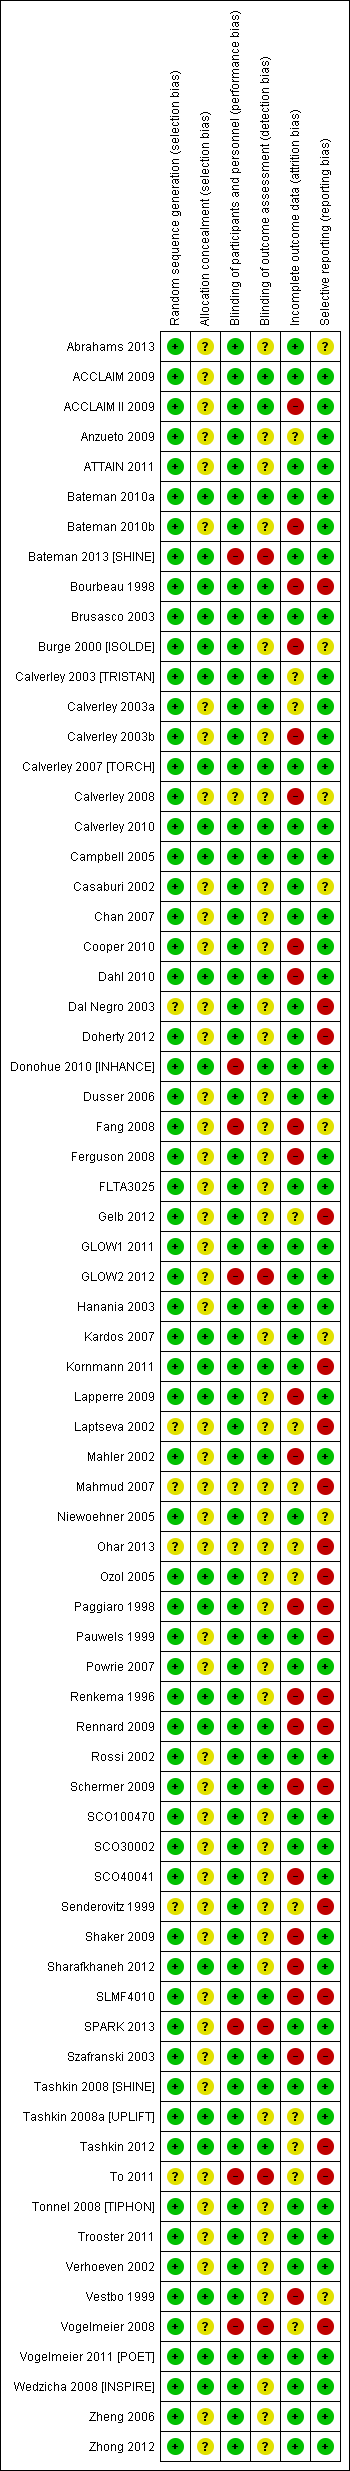
Risk of bias summary: review authors' judgements about each risk of bias item for each included study.
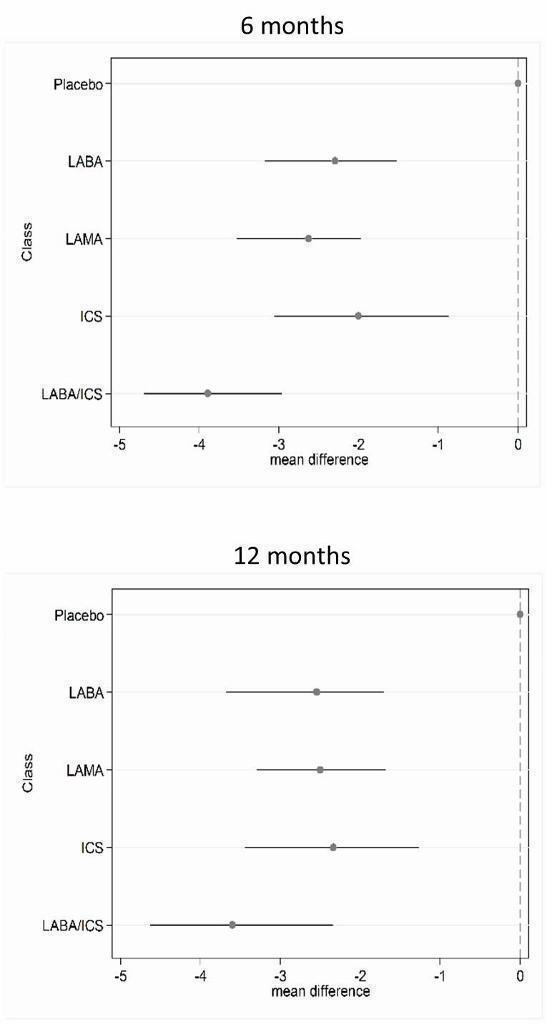
St George's Respiratory Questionnaire (SGRQ) change from baseline—six‐month and 12‐month class results.

Trough forced expiratory volume in one second (FEV1) change from baseline—six‐month and 12‐month class results.
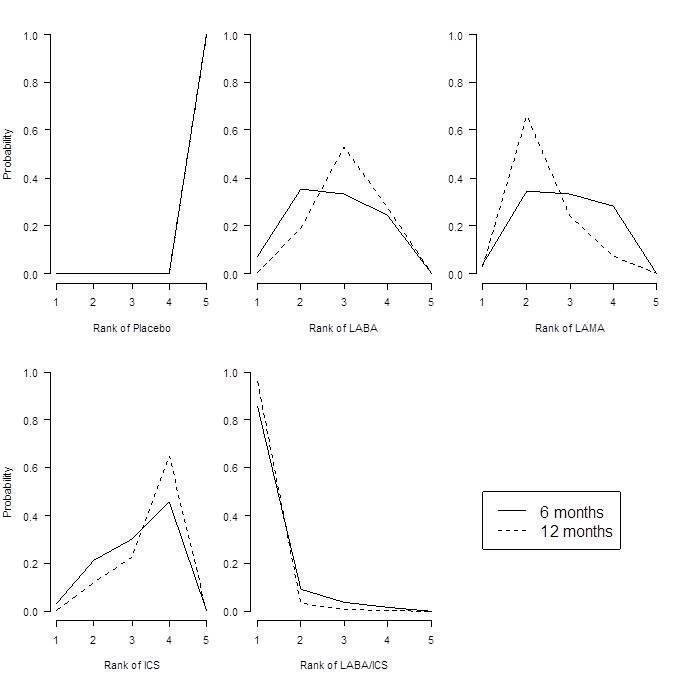
St George's Respiratory Questionnaire (SGRQ) probability ranking diagrams—six months and 12 months.
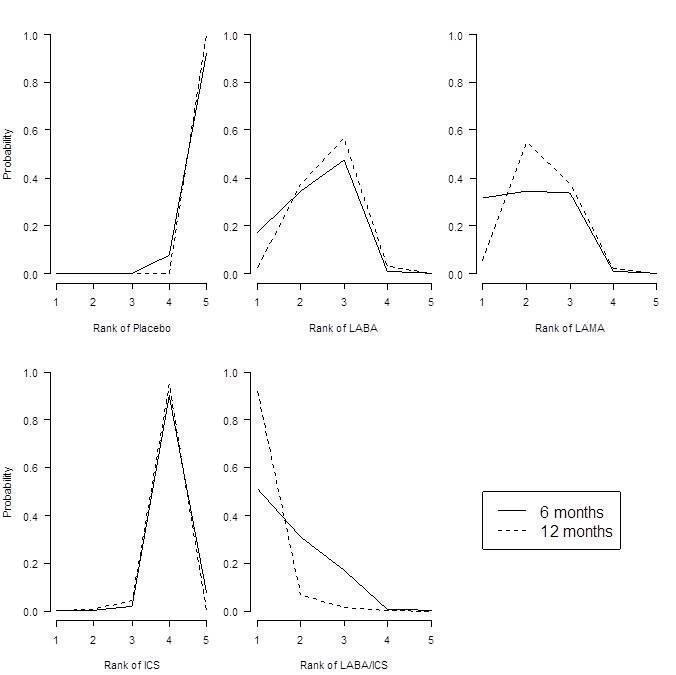
Forced expiratory volume in one second (FEV1) probability ranking diagrams—six months and 12 months.
| Study ID | Weeks | Arms includeda | N | Ageb | % male | % pred FEV1b | Pack‐yearsb |
| 24 | tiotropium, placebo | 856 | 64.2 | 64.9 | 43.3 | 46.9 | |
| 52 | aclidinium, placebo | 843 | 62.4 | 78.6 | 53.9 | 39.9 | |
| 52 | aclidinium, placebo | 804 | 65.1 | 63.0 | 50.3 | 57.9 | |
| 52 | salmeterol, salmeterol/fluticasone | 797 | 65.4 | 54 | 34.0 | 57.2 | |
| 24 | aclidinium (2), placebo | 828 | 62.4 | 67.4 | 52.5 | 40.2 | |
| 48 | tiotropium, placebo | 3991 | 64.8 | 77.6 | 39.9 | 46 | |
| 48 | tiotropium (2), placebo | 1990 | 65.0 | 74.2 | 37.7 | nr | |
| 26 | indacaterol, tiotropium, glycopyrronium, placebo | 1667 | 64.0 | 74.9 | 55.0 | nr | |
| 26 | budesonide, placebo | 79 | 66 | 78.6 | 36.5 | 51 | |
| 26 | salmeterol, tiotropium, placebo | 1207 | 64.2 | 76.3 | 38.5 | 43.8 | |
| 156 | fluticasone, placebo | 751 | 63.8 | 74.6 | 50.2 | 44 | |
| 52 | formoterol, budesonide, formoterol/budesonide, placebo | 1122 | 64 | 76 | 36 | 39 | |
| 52 | salmeterol, fluticasone, salmeterol/fluticasone, placebo | 1466 | 63.2 | 72.5 | 44.7 | 42.3 | |
| 52 | mometasone, placebo | 631 | nr | nr | 47 | nr | |
| 156 | salmeterol, fluticasone, salmeterol/fluticasone, placebo | 6185 | 65.0 | 75.8 | 44.0 | 48.5 | |
| 52 | mometasone (2), placebo | 911 | 65.1 | 68.3 | 42.3 | nr | |
| 48 | formoterol, formoterol/budesonide | 718 | 63.9 | 81.3 | 42.4 | 38.8 | |
| 26 | formoterol, placebo | 432 | 55 | 67 | 53.6 | 37 | |
| 52 | tiotropium, placebo | 921 | 65 | 65.0 | 38.7 | 61.4 | |
| 48 | tiotropium, placebo | 913 | 66.8 | 59.7 | 39.4 | 50.6 | |
| 104 | tiotropium, placebo | 519 | 64.6 | 77.3 | 38.2 | 51.7 | |
| 52 | formoterol, placebo | 867 | 63.5 | 31.9 | 51.7 | 40.8 | |
| 52 | salmeterol, salmeterol/fluticasone, placebo | 18 | nr | 83.3 | 50.0 | 41.4 | |
| 26 | formoterol, mometasone, formoterol/mometasone (2), placebo | 1196 | 59.7 | 75.2 | 38.6 | 45.1 | |
| 26 | indacaterol (2), tiotropium, placebo | 1683 | 63.6 | 62.8 | 55.6 | 49.7 | |
| 48 | tiotropium, placebo | 1010 | 64.7 | 88 | 47.9 | nr | |
| 52 | tiotropium, salmeterol/fluticasone | 126 | 62.5 | 73.8 | nr | nr | |
| 52 | salmeterol, salmeterol/fluticasone | 782 | 64.9 | 55 | 32.8 | 56.5 | |
| 26 | fluticasone (2), placebo | 640 | 64.4 | 68.8 | nr | nr | |
| 52 | aclidinium (2) | 605 | nr | nr | 46.5 | nr | |
| 26 | glycopyrronium, placebo | 822 | 63.9 | 81.8 | 54.6 | 44.8 | |
| 52 | glycopyrronium, tiotropium, placebo | 1066 | 63.6 | 64.2 | 56.0 | 49.1 | |
| 26 | salmeterol, fluticasone, salmeterol/fluticasone, placebo | 723 | 63.9 | 63.1 | 42 | 56.5 | |
| 43 | salmeterol, salmeterol/fluticasone | 994 | 63.9 | 75.8 | 40.4 | 36.9 | |
| 26 | salmeterol, placebo | 339 | 63.3 | 74.7 | 53.3 | 40.3 | |
| 130 | fluticasone (2), salmeterol/fluticasone, placebo | 114 | 61 | 86.6 | 55.3 | 44.3 | |
| 26 | budesonide, placebo | 49 | nr | nr | nr | nr | |
| 26 | salmeterol, fluticasone, salmeterol/fluticasone, placebo | 674 | 63.5 | 65.8 | 41 | 40.8 | |
| 26 | salmeterol, tiotropium | 90 | nr | 91 | nr | nr | |
| 26 | tiotropium, placebo | 1829 | 67.9 | 98.5 | 35.6 | 68.4 | |
| 26 | salmeterol, salmeterol/fluticasone | 639 | nr | nr | nr | nr | |
| 26 | budesonide, placebo | 26 | 65.4 | 69.2 | 59.2 | 45.0 | |
| 26 | fluticasone, placebo | 281 | 63 | 74 | 57 | nr | |
| 156 | budesonide, placebo | 1277 | 52.5 | 72.9 | 76.9 | 39.3 | |
| 52 | tiotropium, placebo | 142 | 66.4 | 62.9 | 50.0 | 55.2 | |
| 104 | budesonide, placebo | 39 | 55 | 100 | 63.5 | nr | |
| 52 | formoterol, budesonide, formoterol/budesonide, placebo | 1964 | 63.2 | 63.9 | 39.6 | 40 (med) | |
| 52 | formoterol (2), placebo | 645 | 62.7 | 83.3 | nr | nr | |
| 156 | fluticasone, placebo | 190 | 59.0 | 70.5 | 64.5 | 28.3 | |
| 26 | salmeterol, salmeterol/fluticasone | 1050 | 63.6 | 77.8 | nr | nr | |
| 52 | salmeterol/fluticasone, fluticasone, placebo | 387 | 64.8 | 82 | nr | nr | |
| 156 | salmeterol, salmeterol/fluticasone | 186 | 65.7 | 61.3 | nr | nr | |
| 26 | budesonide, placebo | 26 | 60.5 | 53.5 | nr | nr | |
| 104+ | budesonide, placebo | 254 | 63.6 | 58.3 | 52 | 56 | |
| 52 | formoterol, budesonide/formoterol (2) | 1219 | 63.0 | 62.0 | 37.7 | 44.3 | |
| 26 | salmeterol, placebo | 34 | 63.8 | 88.3 | nr | nr | |
| 64 | tiotropium (OL), glycopyrronium | 1483 | 63.4 | 74.1 | nr | nr | |
| 52 | formoterol, budesonide, formoterol/budesonide, placebo | 812 | 64 | 78.8 | 36.2 | 44.5 | |
| 26 | formoterol, budesonide, formoterol/budesonide (3), placebo | 1704 | 63.4 | 66.9 | 39.9 | 40 (med) | |
| 208 | tiotropium, placebo | 5993 | 64.5 | 74.7 | 39.4 | 48.7 | |
| 26 | formoterol, mometasone, formoterol/mometasone (2), placebo | 1055 | 59.8 | 77.5 | nr | 40.4 | |
| 52 | salmeterol, indacaterol | 186 | 69.1 | nr | 53 | nr | |
| 39 | tiotropium, placebo | 554 | 64.2 | 86.1 | 46.9 | 43.7 | |
| 24 | tiotropium, placebo | 457 | 61.8 | 68.4 | nr | nr | |
| 26 | fluticasone, placebo | 23 | 55 | 82.3 | 63.5 | 25.5 | |
| 156 | budesonide, placebo | 290 | 59.1 | 87.5 | 86.6 | nr | |
| 26 | formoterol, tiotropium, placebo | 640 | 62.6 | 77.5 | 51.4 | 38.0 | |
| 52 | salmeterol, tiotropium | 7384 | 62.9 | 74.7 | 49.3 | 38.3 | |
| 104 | tiotropium, salmeterol/fluticasone | 1323 | 64.5 | 82.5 | 39.3 | 40.4 | |
| 24 | salmeterol/fluticasone, placebo | 448 | 66.3 | 88.6 | nr | nr | |
| 24 | budesonide, formoterol/budesonide | 308 | 65.2 | 95.1 | 32.7 | nr | |
| aNumbers in parentheses indicate multiple doses of the same treatment. bAge, % predicted FEV1 and pack‐years smoked are reported as means unless otherwise stated. bid = twice daily. FEV1 = forced expiratory volume in one second. ICS = inhaled corticosteroid. LABA = long‐acting beta2‐agonist. LABA/ICS = long‐acting beta2‐agonist/inhaled corticosteroid combination therapy. LAMA = long‐acting muscarinic antagonist. nr = not reported. PBO = placebo inhaler. qd = once daily. | |||||||
| Comparison | Comparisons | N | Ageb | % male | % FEV1c | Packsd |
| LABA vs placebo | 16 | 13,808 | 62.9 | 74.7 | 46.2 | 42.5 |
| LAMA vs placebo | 15 | 22,406 | 64.2 | 71.3 | 47.1 | 47.5 |
| ICS vs placebo | 10 | 8153 | 63.4 | 74.9 | 41.7 | 42.7 |
| LABA/ICS vs placebo | 10 | 9097 | 63.1 | 75.3 | 39.7 | 42.4 |
| LABA vs LAMA | 2 | 2680 | 63.7 | 69.5 | 55.2 | 49.7 |
| LABA vs ICS | 7 | 6226 | 62.7 | 73.8 | 40.0 | 42.7 |
| LABA vs LABA/ICS | 13 | 12,505 | 63.1 | 71.0 | 38.8 | 43.9 |
| LAMA vs ICS | 0 | ‐ | ‐ | ‐ | ‐ | ‐ |
| LAMA vs LABA/ICS | 1 | 1323 | 64.5 | 82.5 | 39.3 | 40.4 |
| ICS vs LABA/ICS | 10 | 8721 | 62.9 | 75.3 | 38.8 | 42.9 |
| aSummary population data are for all study comparisons excluding those made in the 29 studies that could not be included in either the six‐month or the 12‐month SGRQ network. bAge = mean years. c% FEV1 = mean percentage predicted FEV1. dPacks = mean pack‐years. FEV1 = forced expiratory volume in one second. ICS = inhaled corticosteroid. LABA = long‐acting beta2‐agonist. LABA/ICS = long‐acting beta2‐agonist/inhaled corticosteroid combination therapy. LAMA = long‐acting muscarinic antagonist. SGRQ = St George's Respiratory Questionnaire. | ||||||
| Comparison | Comparisons | N | Ageb | % male | %FEV1c | Packsd |
| LABA vs Placebo | 13 | 8680 | 63.3 | 73.2 | 47.7 | 43.9 |
| LAMA vs Placebo | 16 | 23,111 | 64.3 | 72.2 | 47.6 | 48.9 |
| ICS vs Placebo | 12 | 4574 | 63.6 | 71.9 | 46.2 | 45.2 |
| LABA/ICS vs Placebo | 9 | 4978 | 63.9 | 73.5 | 41.6 | 44.4 |
| LABA vs LAMA | 2 | 2680 | 63.7 | 69.5 | 55.2 | 49.7 |
| LABA vs ICS | 5 | 2506 | 63.6 | 67.1 | 40.6 | 46.7 |
| LABA vs LABA/ICS | 12 | 8005 | 63.7 | 68.8 | 39.9 | 45.8 |
| LAMA vs ICS | 0 | ‐ | ‐ | ‐ | ‐ | ‐ |
| LAMA vs LABA/ICS | 0 | ‐ | ‐ | ‐ | ‐ | ‐ |
| ICS vs LABA/ICS | 8 | 4560 | 63.6 | 71.7 | 39.0 | 45.5 |
| aSummary population data are for all study comparisons excluding those made in the 23 studies that could not be included in either the six‐month or the 12‐month FEV1 network; all doses are given in micrograms. bAge = mean years. c% FEV1 = mean percentage predicted FEV1. dPacks = mean pack‐years. FEV1 = forced expiratory volume in one second. ICS = inhaled corticosteroid. LABA = long‐acting beta2‐agonist. LABA/ICS = long‐acting beta2‐agonist/inhaled corticosteroid combination therapy. LAMA = long‐acting muscarinic antagonist. | ||||||
| Study ID | Arm removed | Analyses affected |
| Tiotropium 18 mcg | SGRQ6m, FEV6m | |
| Tiotropium 18 mcg | SGRQ6m, FEV6m | |
| Tiotropium 18 mcg | SGRQ6m, FEV6m, SGRQ12m, FEV12m | |
| Whole study (2 arms) | SGRQ6m, FEV6m, SGRQ12m, FEV12m | |
| Tiotropium 18 mcg | Did not appear in analyses | |
| FEV = forced expiratory volume in one second SGRQ = St George's Respiratory Questionnaire 6m = six month analysis 12m = 12 month analysis | ||
| Effect vs placebo | Effect vs placebo | Rank | ||||||
| Class | Median | 95% CrI | Median | 95% CrI | Mean | Median | 95% CrI | Pr (best) |
| LABA/ICS | ‐3.89 | (‐4.70 to ‐2.97) | ‐3.89 | (‐4.66 to ‐3.05) | 1.0 | 1 | (1 to 2) | 0.96 |
| LAMA | ‐2.63 | (‐3.53 to ‐1.97) | ‐2.78 | (‐3.58 to ‐2.13) | 2.4 | 2 | (1 to 4) | 0.03 |
| LABA | ‐2.29 | (‐3.18 to ‐1.53) | ‐2.09 | (‐2.93 to ‐1.36) | 3.1 | 3 | (2 to 4) | 0.01 |
| ICS | ‐2.00 | (‐3.06 to ‐0.87) | ‐1.96 | (‐2.99 to ‐0.91) | 3.5 | 4 | (2 to 4) | 0.00 |
| aFor effects versus placebo, smaller values indicate larger benefits of the active treatment; all doses are given in micrograms. Crl = credible interval. SGRQ = St George's Respiratory Questionnaire. ICS = inhaled corticosteroid. LABA = long‐acting beta2‐agonist. LABA/ICS = long‐acting beta2‐agonist/inhaled corticosteroid. LAMA = long‐acting antimuscarinic antagonist. NWMA = network meta‐analysis. Pr = probability. | ||||||||
| Rank (from class NWMA) | Effect vs placebo | Effect vs placebo | Rank (from class NWMA) | ||||||
| Class | Treatment (number daily doses) | Median | 95% CrI | Median | 95% CrI | Mean | Median | 95% CrI | Pr (best) |
| LABA | Form 12 (2) | ‐1.84 | (‐2.60 to ‐0.94) | ‐1.20 | (‐2.10 to ‐0.30) | 14.9 | 15 | (10 to 17) | 0.00 |
| Ind 300 (1) | ‐2.38 | (‐3.63 to ‐1.44) | ‐3.10 | (‐4.86 to ‐1.36) | 11.3 | 12 | (5 to 17) | 0.00 | |
| Ind 150 (1) | ‐2.75 | (‐3.95 to ‐1.85) | ‐3.67 | (‐4.76 to ‐2.58) | 8.7 | 8 | (3 to 16) | 0.01 | |
| Salm 50 (2) | ‐2.20 | (‐2.98 to ‐1.43) | ‐2.27 | (‐3.27 to ‐1.27) | 12.9 | 13 | (7 to 17) | 0.00 | |
| LAMA | Tio 5 (1) | ‐2.50 | (‐3.16 to ‐1.86) | ‐2.42 | (‐3.20 to ‐1.63) | 10.5 | 10 | (6 to 16) | 0.00 |
| Tio 18 (1) | ‐2.53 | (‐3.12 to ‐1.97) | ‐2.66 | (‐3.33 to ‐1.99) | 10.3 | 10 | (6 to 15) | 0.00 | |
| Acl 200 (2) | ‐2.66 | (‐4.04 to ‐1.70) | ‐3.79 | (‐6.14 to ‐1.45) | 9.1 | 9 | (2 to 16) | 0.01 | |
| Acl 400 (2) | ‐2.81 | (‐4.40 to ‐1.90) | ‐4.59 | (‐6.94 to ‐2.23) | 7.9 | 7 | (1 to 15) | 0.03 | |
| Gly 50 (1) | ‐2.63 | (‐3.42 to ‐1.94) | ‐2.83 | (‐3.74 to ‐1.91) | 9.5 | 9 | (5 to 15) | 0.00 | |
| ICS | Bud 400 (2) | ‐1.76 | (‐2.82 to ‐0.55) | ‐0.97 | (‐2.32 to 0.38) | 14.9 | 16 | (7 to 17) | 0.00 |
| Flut 500 (2) | ‐1.95 | (‐3.07 to ‐0.74) | ‐1.71 | (‐3.40 to ‐0.01) | 13.9 | 15 | (6 to 17) | 0.00 | |
| Mom 400 (2) | ‐2.28 | (‐3.51 to ‐1.19) | ‐2.77 | (‐4.47 to ‐1.09) | 11.9 | 13 | (5 to 17) | 0.00 | |
| LABA/ICS | Form‐bud 12/160 (2) | ‐4.04 | (‐4.91 to ‐3.15) | ‐3.85 | (‐4.99 to ‐2.70) | 2.6 | 2 | (1 to 6) | 0.29 |
| Form‐bud 12/320 (2) | ‐3.80 | (‐4.63 to ‐2.84) | ‐3.31 | (‐4.39 to ‐2.22) | 3.9 | 4 | (1 to 9) | 0.10 | |
| Form‐mom 12/200 (2) | ‐3.85 | (‐4.82 to ‐2.66) | ‐3.45 | (‐5.17 to ‐1.74) | 3.7 | 4 | (1 to 10) | 0.15 | |
| Form‐mom 12/400 (2) | ‐3.75 | (‐4.72 to ‐2.48) | ‐3.09 | (‐4.81 to ‐1.37) | 4.3 | 4 | (1 to 11) | 0.10 | |
| Salm‐flut 50/500 (2) | ‐4.05 | (‐4.97 to ‐3.18) | ‐4.36 | (‐5.60 to ‐3.12) | 2.6 | 2 | (1 to 6) | 0.31 | |
| aFor effects versus placebo, smaller values indicate larger benefits of the active treatment; all doses are given in micrograms. Crl = credible interval. SGRQ = St George's Respiratory Questionnaire. ICS = inhaled corticosteroid. LABA = long‐acting beta2‐agonist. LABA/ICS = long‐acting beta2‐agonist/inhaled corticosteroid. LAMA = long‐acting antimuscarinic antagonist. NWMA = network meta‐analysis. Pr = probability. | |||||||||
| Effect vs placebo | Effect vs placebo | Rank | ||||||
| Class | Median | 95% CrI | Median | 95% CrI | Mean | Median | 95% CrI | Pr (best) |
| LABA/ICS | 133.30 | (100.60 to 164.00) | 132.80 | (98.93 to 165.60) | 1.1 | 1 | (1 to 2) | 0.9 |
| LAMA | 103.50 | (81.78,124.90) | 103.60 | (79.01 to 126.60) | 2.4 | 2 | (1 to 3) | 0.1 |
| LABA | 99.44 | (71.98,127.80) | 99.86 | (70.41 to 130.50) | 2.6 | 3 | (1 to 4) | 0.0 |
| ICS | 65.36 | (33.06,96.91) | 65.52 | (31.23 to 97.16) | 3.9 | 4 | (3 to 4) | 0.0 |
| aFor effects versus placebo, smaller values indicate larger benefits of the active treatment; all doses are given in micrograms. Crl = credible interval. FEV1 = forced expiratory volume in one second. ICS = inhaled corticosteroid. LABA = long‐acting beta2‐agonist. LABA/ICS = long‐acting beta2‐agonist/inhaled corticosteroid. LAMA = long‐acting antimuscarinic antagonist. NWMA = network meta‐analysis. Pr = probability. | ||||||||
| Effect vs placebo | Effect vs placebo | Rank (from class NWMA) | |||||||
| Class | Treatment (number daily doses) | Median | 95% CrI | Median | 95% CrI | Mean | Median | 95% CrI | Pr (best) |
| LABA | Form 12 (2) | 94.88 | (60.70 to 122.80) | 53.92 | (13.00 to 94.07) | 12.0 | 13 | (5 to 18) | 0.00 |
| Ind 300 (1) | 103.30 | (71.95 to 150.10) | 137.90 | (63.69 to 209.90) | 9.5 | 10 | (2 to 16) | 0.02 | |
| Ind 150 (1) | 99.53 | (72.32 to 127.20) | 100.70 | (65.74 to 133.80) | 10.8 | 12 | (4 to 16) | 0.00 | |
| Salm 50 (2) | 101.00 | (73.39 to 130.70) | 114.70 | (75.96 to 149.30) | 10.3 | 11 | (4 to 16) | 0.00 | |
| LAMA | Tio 5 (1) | 105.40 | (81.87 to 131.80) | 110.50 | (73.82 to 145.40) | 8.9 | 9 | (3 to 15) | 0.01 |
| Tio 10 (1) | 106.40 | (79.80 to 142.00) | 121.00 | (62.88 to 175.20) | 8.6 | 8 | (2 to 15) | 0.02 | |
| Tio 18 (1) | 105.20 | (85.54 to 125.50) | 107.00 | (82.93 to 129.50) | 9.0 | 9 | (4 to 15) | 0.00 | |
| Acl 200 (1) | 98.83 | (59.06 to 123.20) | 59.31 | (9.47 to 107.90) | 11.3 | 11 | (5 to 18) | 0.00 | |
| Acl 200 (2) | 100.60 | (65.20 to 127.10) | 74.82 | (11.81 to 134.20) | 10.7 | 11 | (4 to 17) | 0.00 | |
| Acl 400 (2) | 107.30 | (80.93 to 143.50) | 108.80 | (45.06 to 168.30) | 8.2 | 8 | (2 to 15) | 0.02 | |
| Gly 50 (1) | 103.60 | (79.83 to 127.50) | 101.50 | (67.86 to 133.40) | 9.5 | 10 | (3 to 15) | 0.00 | |
| ICS | Bud 400 (2) | 61.89 | (23.86 to 94.06) | 14.59 | (‐29.22 to 58.25) | 17.6 | 18 | (14 to 19) | 0.00 |
| Bud 750+ (2) | 63.10 | (14.75 to 99.65) | ‐2.26 | (‐95.77 to 91.34) | 17.3 | 18 | (12 to 19) | 0.00 | |
| Flut 250 (2) | 66.78 | (34.19 to 101.10) | 76.18 | (29.36 to 122.30) | 16.9 | 17 | (11 to 19) | 0.00 | |
| Flut 500 (2) | 72.16 | (40.20 to 109.80) | 97.04 | (54.90 to 138.40) | 15.9 | 16 | (8 to 19) | 0.00 | |
| LABA/ICS | Form‐bud 12/160 (2) | 131.10 | (91.65 to 164.00) | 80.84 | (26.99 to 132.70) | 3.9 | 3 | (1 to 13) | 0.16 |
| Form‐bud 12/320 (2) | 127.30 | (85.14 to 159.50) | 72.77 | (28.75 to 116.70) | 4.7 | 4 | (1 to 14) | 0.11 | |
| Salm‐flut 50/250 (2) | 139.70 | (106.20 to 182.90) | 173.00 | (116.20 to 226.40) | 2.4 | 2 | (1 to 8) | 0.39 | |
| Salm‐flut 50/500 (2) | 137.10 | (104.40 to 172.10) | 152.40 | (104.10 to 197.80) | 2.8 | 2 | (1 to 9) | 0.26 | |
| aFor effects versus placebo, bigger values indicate larger benefits of the active treatment; all doses are given in micrograms. Crl = credible interval. FEV1 = forced expiratory volume in one second. ICS = inhaled corticosteroid. LABA = long‐acting beta2‐agonist. LABA/ICS = long‐acting beta2‐agonist/inhaled corticosteroid. LAMA = long‐acting antimuscarinic antagonist. NWMA = network meta‐analysis. Pr = probability. | |||||||||