Traitement inhalé à action prolongée (bêta‐agonistes, anticholinergiques et stéroïdes) pour la BPCO : une méta‐analyse en réseau
Résumé scientifique
Contexte
Le traitement pharmacologique de la bronchopneumopathie chronique obstructive (BPCO) vise à soulager les symptômes, améliorer la qualité de vie et prévenir ou traiter les exacerbations.
Le traitement tend à commencer avec un seul inhalateur, d'autres traitements sont par la suite introduits en cas de besoin. Pour des symptômes persistants ou s'aggravants, les médicaments inhalés à action prolongée administrés une ou deux fois par jour sont préférés à ceux avec une courte durée d'action. Plusieurs revues Cochrane ont examiné les risques et les bénéfices des traitements inhalés à action prolongée par rapport à un placebo ou à d'autres traitements. Cependant, pour les patients et les cliniciens, il est important de comprendre les effets bénéfiques de ces traitements par rapport aux autres, et si un type particulier de traitement inhalé est plus bénéfique que les autres.
Objectifs
Évaluer l'efficacité des options de traitement chez les patients dont la maladie pulmonaire obstructive chronique ne peut être contrôlée uniquement par des thérapies à courte durée d'action. La revue n'étudiera pas les traitements combinés généralement considérés plus tardivement dans le traitement de la maladie.
Dans le cadre de cette méta‐analyse en réseau, nous traiterons les questions suivantes.
1. Comment l'efficacité à long terme est‐elle comparée entre les différents traitements pharmacologiques pour la BPCO ?
2. Est‐ce qu'il y a des limitations dans la base de preuves actuelles qui pourraient compromettre les conclusions apportées par cette méta‐analyse en réseau ? Si oui, quelles sont les implications pour les recherches futures ?
Stratégie de recherche documentaire
Nous avons identifié des essais contrôlés randomisés (ECR) dans des revues Cochrane existantes par une recherche dans la base des revues systématiques Cochrane (CDSR). Nous avons également effectué une recherche exhaustive de références bibliographiques dans le registre d'essais du groupe Cochrane sur les voies respiratoires (CAGR) et vérifié les sites Internet des fabricants et les références bibliographiques des revues. Les recherches les plus récentes ont été effectuées en septembre 2013.
Critères de sélection
Nous avons inclus des ECR en groupes parallèles d'une durée d'au moins 6 mois portant sur des patients atteints de BPCO. Les études étaient incluses si elles comparaient l'un des traitements suivants par rapport à un autre : les bêta 2‐agonistes à action prolongée (BALA – le formotérol, l'indacatérol, le salmétérol); les antagonistes muscariniques à action prolongée (AMAL –l'aclidinium, le glycopyrronium, le tiotropium); les corticoïdes inhalés (CI – le budésonide, la fluticasone, le mométasone) ; la combinaison de bêta 2‐agonistes à action prolongée et de corticoïdes inhalés (BALA / CI – le formotérol / le budésonide, le formotérol / le mométasone, le salmétérol / la fluticasone); et un placebo.
Recueil et analyse des données
Nous avons réalisé une méta‐analyse en réseau à l'aide de la méthode de Monte Carlo par chaîne de Markov pour deux critères de jugement d'efficacité : le score total du Questionnaire Respiratoire St George (SGRQ) et le volume expiratoire maximal en une seconde (FEV 1). Nous avons modélisé l'efficacité relative de chacun des deux traitements comme une fonction de chaque traitement par rapport au traitement de référence (placebo). Nous avons assumé que les effets du traitement étaient similaires parmi les classifications de traitement (BALA, AMAL, IC, BALA / CI). Nous présentons les estimations des effets, la variabilité entre les traitements dans chaque classification et les effets du traitement individuel par rapport à tous les autres.
Pour justifier les analyses, nous avons évalué les essais pour la transitivité clinique et méthodologique parmi les comparaisons. Nous avons testé la robustesse de nos analyses par la réalisation d'analyses de sensibilité pour l'absence d'assignation en aveugle et en prenant séparément en compte les données de 6 et 12 mois.
Résultats principaux
Nous avons identifié 71 ECR attribuant de façon aléatoire 73 062 patients souffrant de BPCO dans 184 groupes de traitement. Les essais étaient similaires en ce qui concerne la méthodologie, les critères d'inclusion et d'exclusion et les principales caractéristiques de référence. Les participants étaient le plus souvent de sexe masculin, ayant la soixantaine, avec un FEV 1 prédit comme normal entre 40 et 50 % et fumant depuis longtemps (plus de 40 paquets par an). Le risque de biais était généralement faible, bien que du fait d'informations manquantes, il était difficile d'évaluer le risque de biais de sélection et la notification sélective de résultats. Les effets fixes étaient utilisés pour les analyses du QRSG, et les effets aléatoires pour les analyses de FEV 1, basés sur les statistiques d'un modèle ajusté et le critère d'information de déviance (CID).
QRSG
Les données du QRSG étaient disponibles dans 42 études (n = 54 613). À six mois, 39 comparaisons par paire ont été réalisées entre 18 traitements dans 25 études (n = 27 024). La combinaison BALA / CI représentait le meilleur classement, avec une amélioration moyenne par rapport au placebo de ‐3,89 unités à six mois (intervalle de confiance (IC) à 95%, de ‐4,70 à ‐2,97) et de ‐3,60 à 12 mois (IC à 95%, de ‐4,63 à ‐2,34). Les AMAL et les BALA étaient classés en deuxième et troisième position à six mois, avec des différences moyennes de ‐2,63 (IC à 95 % ‐3,53 à ‐1,97) et de ‐2,29 (IC à 95 % ‐3,18 à ‐1,53), respectivement. Les corticostéroïdes inhalés étaient classés en quatrième position (DM de ‐2,00, IC à 95 % de ‐3,06 à ‐0,87). La différence de classe entre les BALA, les AMAL et les CI était moins importante à 12 mois. L'indacatérol et l'aclidinium étaient à un niveau moins élevé que d'autres membres de leur classification, et le formotérol à 12 mcg, le budésonide à 400 mcg et la combinaison de formotérol / mométasone étaient à un niveau moins élevé dans leur classification. Un chevauchement important était observé au niveau des intervalles de crédibilité et des classements pour les classifications et les traitements individuels.
FEV 1
Les données FEV 1 étaient disponibles dans 46 études (n = 47 409). À six mois, 41 comparaisons par paire ont été réalisées entre 20 traitements dans 31 études (n = 29 271). Comme pour le QRSG, la combinaison BALA / CI était la mieux classée, avec une amélioration moyenne par rapport au placebo de 133,3 ml à six mois (IC à 95% de 100,6 à 164,0) et légèrement plus faible à 12 mois (différence moyenne (DM) 100, IC à 95 % de 55,5 à 140,1). Les AMAL (DM 103,5, IC à 95 % de 81,8 à 124,9) et les BALA (DM 99,4, IC à 95 % de 72,0 à 127,8) ont montré des résultats à peu près équivalents à six mois, et les CI étaient classés en quatrième position (DM de 65,4, IC à 95 % de 33,1 à 96,9). Comme avec le QRSG, les différences initiales entre les classifications n'étaient pas aussi proéminentes à 12 mois. L'indacatérol et le salmétérol / fluticasone étaient légèrement mieux classés que d'autres dans leur classification, et le formotérol 12, l'aclidinium, le budésonide et la combinaison budésonide / formotérol étaient de niveau plus faible dans leur classification. Tous les intervalles de confiance pour le classement individuel étaient larges.
Conclusions des auteurs
Cette méta‐analyse en réseau compare quatre différentes classes d'inhalateurs à action prolongée chez les patients souffrant de BPCO et nécessitant plus que des bronchodilatateurs à courte durée d'action. La qualité de vie et la fonction pulmonaire s'amélioraient plus significativement avec des inhalateurs combinés (BALA + CI) et moins significativement avec les CI seuls à 6 et à 12 mois. Dans l'ensemble, les inhalateurs AMAL et BALA présentaient des effets similaires, en particulier à 12 mois. Le réseau a démontré le bénéfice des IC lorsqu'ils étaient ajoutés aux BALA pour ces critères de jugement chez les participants qui, pour la plupart, avaient une FEV 1 prédite inférieure à 50 %, mais le coût supplémentaire des inhalateurs combinés et tout effet indésirable potentiel (qui a été démontré par d'autres revues) devaient être considérés. Nos résultats sont conformes aux directives du National Institute for Health and Care Excellence (NICE).
PICOs
Résumé simplifié
Quels médicaments inhalés à action prolongée, utilisés seuls ou combinés, sont les plus efficaces chez les patients souffrant de BPCO ?
Pourquoi cette question est‐elle importante ?
Les médicaments inhalés pour le traitement de la BPCO ont démontré soulager les symptômes, améliorer la qualité de vie et prévenir ou traiter les poussées. Le traitement avec ces médicaments inhalés tend à commencer avec un seul inhalateur, d'autres traitements sont introduits par la suite en cas de besoin. Pour des symptômes persistants ou s'aggravants, les médicaments inhalés à action prolongée administrés une ou deux fois par jour sont préférés à ceux avec courte durée d'action. Plusieurs revues Cochrane ont examiné les risques et les bénéfices des traitements inhalés à action prolongée par rapport à un placebo ou à d'autres traitements. Cependant, pour les patients et les cliniciens, il est important de comprendre les effets bénéfiques de ces traitements par rapport aux autres, et si un type particulier de traitement inhalé est plus bénéfique que les autres.
Comment avons‐nous répondu à la question ?
Nous avons recherché des études dans des revues Cochrane existantes et effectué des recherches électroniques jusqu'en septembre 2013. Les études étaient incluses lorsqu'elles duraient au moins six mois et comparaient l'un des traitements suivants par rapport à un autre chez les patients souffrant de BPCO : les bêta 2‐agonistes à action prolongée (BALA – le formotérol, l'indacatérol, le salmétérol); les antagonistes muscariniques à action prolongée (AMAL –l'aclidinium, le glycopyrronium, le tiotropium); les corticoïdes inhalés (CI – le budésonide, la fluticasone, le mométasone) ; la combinaison de bêta 2‐agonistes à action prolongée et de corticoïdes inhalés (BALA / CI – le formotérol / le budésonide, le formotérol / le mométasone, le salmétérol / la fluticasone); et un placebo.
Nous avons réalisé une méta‐analyse de réseau pour évaluer les bénéfices de chaque type de traitement (par exemple, les bêta 2‐agonistes à action prolongée) par rapport aux autres sur la qualité de vie et la fonction pulmonaire. Nous avons également examiné la variation de chaque traitement (par exemple, quelle était la différence entre les trois stéroïdes inhalés ?) et si certains traitements étaient plus efficaces que d'autres. Nous avons évalué les données séparément à 6 mois et à 12 mois, et rendu compte des principaux résultats comme étant à 6 mois.
Qu'avons‐nous trouvé ?
Nous avons trouvé 71 études pertinentes, mais certaines ne mesuraient pas les critères de jugement qui nous intéressaient. Quarante‐deux études ont été incluses dans les analyses sur la qualité de vie (mesurées avec le Questionnaire Respiratoire St George ‐ QRSG), et 46 ont été incluses dans les analyses sur la fonction pulmonaire.
Des preuves de bonne qualité et des essais similaires indiquaient que la combinaison BALA / CI était la stratégie de traitement la plus susceptible d'apporter la meilleure amélioration sur la qualité de vie et la fonction pulmonaire. À six mois, le traitement combiné apportait un bénéfice moyen de 3,9 unités par rapport au placebo. Les AMAL et les BALA étaient classés en deuxième et troisième position à six mois (‐2,63 et ‐2,29 unités, respectivement), en particulier lorsque des essais peu fiables n'étaient pas inclus, mais un large degré de chevauchement dans les estimations était observé.
La combinaison BALA / CI représentait le meilleur classement pour le volume expiratoire maximal en une seconde (FEV 1), avec une amélioration moyenne par rapport au placebo de 133 ml à six mois (intervalle de confiance (IC) à 95%, de 101 à 164). Tout comme pour le QRSG, les AMAL (différence moyenne (DM) de 104, IC à 95% de 82 à 125) ont été classés correctement juste devant les BALA (DM de 99, IC à 95% de 72 à 128) à six mois, et les CI étaient le moins bien classés (DM de 65, IC à 95% de 33 à 97).
Pour les deux critères de jugement, les effets de la combinaison BALA + IC utilisée seule semblaient augmenter lorsqu'elle était utilisée pendant six mois, mais les différences initiales entre les classifications de traitement étaient moins visibles après un an de traitement.
Conclusion
La qualité de vie et la fonction pulmonaire s'amélioraient plus significativement avec les inhalateurs combinés (BALA + IC) et moins significativement avec les IC seuls à 6 et à 12 mois. Dans l'ensemble, les inhalateurs AMAL et BALA présentaient des effets similaires, en particulier à 12 mois. Le réseau a démontré le bénéfice des IC lorsqu'ils étaient ajoutés aux BALA pour ces critères de jugement chez les participants qui, pour la plupart, avaient une FEV 1 prédite inférieure à 50 %, mais le coût supplémentaire des inhalateurs combinés et tout effet indésirable potentiel (qui a été démontré par d'autres revues) devaient être considérés. Nos résultats sont conformes aux directives du National Institute for Health and Care Excellence (NICE).
Authors' conclusions
Background
Description of the condition
Chronic obstructive pulmonary disease (COPD) is a respiratory disease characterised by chronic and progressive breathlessness, cough, sputum production and airflow obstruction, all of which lead to restricted activity and poor quality of life (GOLD). The World Health Organization (WHO) has estimated that COPD is the fourth or fifth most common single cause of death worldwide, and the treatment and management costs present a significant burden to public health. In the UK, the annual cost of COPD to the National Health Service (NHS) is estimated to be £1.3 million per 100,000 people (NICE 2011). Furthermore, because of slow onset and under‐recognition of the disease, it is heavily under‐diagnosed (GOLD). COPD comprises a combination of bronchitis and emphysema and involves chronic inflammation and structural changes in the lung. Cigarette smoking is the most important risk factor; however, air pollution and occupational dust and chemicals can also increase the risk of developing the disease. COPD is a progressive disease that leads to decreased lung function over time, even with the best available care. Currently no cure for COPD is known, although it is both preventable and treatable. Management of the disease is multifaceted and includes interventions for smoking cessation (van der Meer 2001), pharmacological treatments (GOLD), education (Effing 2007) and pulmonary rehabilitation (Lacasse 2006; Puhan 2011). Pharmacological therapy is aimed at relieving symptoms, improving exercise tolerance and quality of life, slowing decline and even improving lung function and preventing and treating exacerbations. COPD exacerbations impair patients' quality of life (GOLD), and a large part of the economic burden of COPD is attributed to the cost of managing exacerbations, particularly those resulting in use of acute care services or hospitalisation (Hutchinson 2010). In the UK, one in eight emergency admissions to hospital is for COPD, and it is one of the most costly conditions treated by the NHS (NICE 2011). Appropriate pharmacological management of the disease is therefore important, particularly for reducing and preventing exacerbations.
Description of the interventions
Pharmacological management of COPD tends to begin with one treatment, and additional therapies are introduced as necessary to control symptoms and reduce the frequency and severity of exacerbations (GOLD). The first step is often a short‐acting bronchodilator for control of breathlessness when needed: either a short‐acting beta2‐agonist (SABA; e.g. salbutamol) or the short‐acting muscarinic antagonist (SAMA) ipratropium. Both bronchodilators have a duration of action of four to six hours (Beeh 2010), and they improve lung function and breathlessness (Appleton 2006; Sestini 2009). For persistent or worsening breathlessness associated with lung function decline, long‐acting bronchodilators may be introduced (GOLD). These comprise long‐acting beta2‐agonists, such as salmeterol or formoterol (LABAs; duration of action 12 hours) and indacaterol (duration of action 24 hours), and long‐acting anticholinergic agents, such as tiotropium (duration of action 24 hours) and more recently aclidinium bromide and glycopyrronium bromide. Regular treatment with long‐acting bronchodilators is preferred over treatment with regular short‐acting bronchodilators on the basis of efficacy and adverse effects (Beeh 2010; GOLD). An alternative when bronchodilators are not available or affordable is theophylline, an oral phosphodiesterase (PDE) inhibitor. However, theophylline is less effective and is less well tolerated than inhaled long‐acting bronchodilators. For patients with severe or very severe COPD (forced expiratory volume in one second (FEV1) < 50% predicted) with repeated exacerbations, GOLD recommends the addition of inhaled corticosteroids (ICSs) to bronchodilator treatment. ICSs are anti‐inflammatory drugs that are licensed as combination inhalers with LABAs. The most common combinations of ICS and LABA in combination inhalers are fluticasone and salmeterol, and budesonide and formoterol. The most severely ill group of patients with advanced COPD may also benefit from treatment with the PDE4 inhibitor roflumilast, which may reduce the risk of exacerbations (GOLD), alongside other beta2‐agonists or anticholinergic agents and ICS, but these combinations are not considered in this review.
How the interventions might work
Long‐acting beta2‐agonists
Inhaled long‐acting beta2‐agonists (LABAs) activate beta2‐receptors in the smooth muscle of the airway, leading to a cascade of reactions that result in bronchodilation. Commonly used LABAs include salmeterol, formoterol and indacaterol. The duration of action for salmeterol and formoterol is approximately 12 hours; therefore they are usually taken twice daily. Indacaterol has a duration of action of 24 hours and therefore can be taken once daily. As with long‐acting muscarinic antagonists (LAMAs), LABAs are commonly used to control symptoms and reduce exacerbations in stable COPD (Moen 2010; Rodrigo 2008). Possible side effects of LABAs include cardiac effects such as arrhythmia and palpitations, muscle tremors, headache and dry mouth (Berger 2008).
Inhaled corticosteroids
Inhaled corticosteroids (ICSs) are anti‐inflammatory drugs. ICSs are licensed as combination inhalers with LABA. The most common combinations of ICS and LABA in combination inhalers are fluticasone and salmeterol, and budesonide and formoterol. Combination inhalers have similar effects to LABA alone, reducing exacerbation rates and improving patients' quality of life. However, some have argued that the difference is small (Rodrigo 2009), and ICS therapy, alone or in combination with beta2‐agonists, is associated with increased risk of pneumonia and osteoporotic fracture (GOLD; Loke 2011; Singh 2010).
Long‐acting muscarinic antagonists
Long‐acting muscarinic antagonists (LAMAs) are anticholinergic agents that block the action of the neurotransmitter acetylcholine. The LAMA tiotropium has gained widespread acceptance as once‐daily maintenance therapy in stable COPD for its effects on symptoms and exacerbations (Barr 2005; GOLD). Two newer LAMAs that can be taken once daily—aclidinium bromide and glycopyrronium bromide—have recently been licensed for the maintenance treatment of people with COPD. Anticholinergic adverse effects that may occur include dry mouth, constipation and tachycardia (Tashkin 2008).
Why it is important to do this review
Several systematic reviews have looked at the risks and benefits of specific inhaled therapies compared with placebo or other inhaled therapies. However for patients or for clinicians facing patients, the question is often this: Which of the long‐acting therapy options is the most beneficial treatment option for patients no longer obtaining symptom relief from short‐acting therapies, but for whom PDE4 inhibitors or other additional therapies are not yet necessary? Two recent network meta‐analyses have focused primarily on safety outcomes (Decramer 2013; Dong 2013).
Objectives
To assess the efficacy of treatment options for patients whose chronic obstructive pulmonary disease cannot be controlled by short‐acting therapies alone. The review will not look at combination therapies usually considered later in the course of the disease.
As part of this network meta‐analysis, we will address the following issues:
-
How does long‐term efficacy compare between different pharmacological treatments for COPD?
-
Are there limitations in the current evidence base that may compromise the conclusions drawn by this network meta‐analysis? If so, what are the implications for future research?
Methods
Criteria for considering studies for this review
Types of studies
We included randomised control trials (RCTs) with a parallel‐group design of at least 24 weeks' duration. Cross‐over trials were not included, as the pharmaceutical treatments under study can have long‐acting effects.
Types of participants
We included RCTs that recruited participants with a clinical diagnosis of COPD, such as ATS/ERS 2004. We looked for the following inclusion criteria.
-
Forced expiratory volume in one second (FEV1)/forced vital capacity (FVC) ratio < 0.7, which confirms the presence of persistent airflow limitation.
-
One or more of the following key indicators.
-
Progressive and/or persistent dyspnoea.
-
Chronic cough.
-
Chronic sputum production.
-
History of exposure to risk factors (tobacco smoke, smoke from home cooking and heating fuels, occupational dusts and chemicals).
-
Types of interventions
We included studies that compared any of the following therapies versus any other.
-
LABA (formoterol, salmeterol, indacaterol).
-
LAMA (tiotropium, aclidinium bromide, glycopyrronium bromide).
-
ICS (budesonide, fluticasone, mometasone).
-
LABA/ICS combination (formoterol/budesonide, formoterol/mometasone, salmeterol/fluticasone).
-
Placebo.
Treatment classes and individual treatments were compared versus every other using a class‐model network meta‐analysis. The list of included treatments comprised commonly used agents within each class.
Participants were allowed other concomitant COPD medications as prescribed by their healthcare practitioner, provided these medications were not part of the trial treatment under study.
Types of outcome measures
For studies of six months' duration, we used end of study as time of analysis for all outcomes. For longer studies, we extracted data reported at six‐month and 12‐month intervals when available. Two measures of efficacy were chosen as outcomes because previous network meta‐analyses have primarily assessed safety outcomes (mortality, Dong 2013; exacerbations and adverse events, Decramer 2013).
Primary outcomes
-
Quality of life (measured as change from baseline assessed with St George's Respiratory Questionnaire (SGRQ)).
-
Trough FEV1 (change in mL from baseline).
Cost‐effectiveness
We did not carry out a formal cost‐effectiveness analysis, but we sought to identify economic evaluations that have compared the included interventions to supplement the main systematic review of effects. These are summarised in a short commentary in the discussion.
Search methods for identification of studies
Electronic searches
To avoid duplication of effort, we first identified RCTs for inclusion by searching for relevant Cochrane systematic reviews. Cochrane systematic reviews use extensive search strategies that include several databases, manufacturers' websites and handsearching of conference abstracts. We searched the Cochrane Database of Systematic Reviews (CDSR) in The Cochrane Library (2013, Issue 7) to look for all Cochrane systematic reviews on COPD, using the search strategy provided in Appendix 1, and from those, we handpicked the reviews that included relevant comparisons. From these reviews, we identified individual RCTs that met our inclusion criteria.
In addition, we ran a search on the Cochrane Airways Group Register (CAGR) of trials (see Appendix 2 for details of the Register) to find studies that may have been missed in the review search (e.g. because of discrepancies in inclusion criteria between individual reviews and this network, as a result of review searches more than 12 months out of date or when no reviews existed for a particular comparison). The search was done according to guidance provided in the Cochrane Handbook for Systematic Reviews of Interventions (Higgins 2011) and in consultation with an information specialist (see Appendix 3 for the search strategy). No date or language restrictions were applied. We searched NHS Economic Evaluation Database (EED) and Health Economic Evaluations Database (HEED) for economic evaluations using the strategy provided in Appendix 1, adapted as appropriate.
Data collection and analysis
Selection of studies
One review author assessed for inclusion all potentially eligible reviews retrieved through the search and assessed all potentially eligible RCTs within these reviews (KMK). The CAGR database search was sifted by the same review author, and uncertainties were resolved by discussion with a second review author (CJC).
Data extraction and management
For the following characteristics, one review author extracted information for all included RCTs from their published reports (KMK) if they were already included in a Cochrane review.
-
Individual trial study characteristics (design, duration, location, participant inclusion/exclusion criteria, funding).
-
Trial arms of interest (drug, dose, inhaler type, allowed co‐medications).
-
Individual trial population details: mean baseline lung function, pack‐years, age and % male.
-
Individual trial outcome data.
Information from studies identified in other reviews was subsequently cross‐checked (data in each of the existing reviews were extracted and verified by at least two review authors). Inconsistencies and uncertainties were resolved by consultation with a second review author (CJC).
Assessing transitivity (similarity of participants, interventions and trial methodology)
The sets of trials for each treatment must be similar in their distribution of effect modifiers to permit conclusions based on a network meta‐analysis combining direct and indirect evidence (Cipriani 2013). We constructed summary tables organised by class pair‐wise comparisons (e.g. LABA vs ICS, LAMA vs placebo) to assess clinical and methodological similarities of the trials and their populations.
Assessment of risk of bias in included studies
Although existing reviews were used to identify RCTs, data and methodological quality were dealt with at an individual trial level. One review author extracted information related to risk of bias for all trials and subsequently cross‐checked judgements from existing reviews, standardising ratings across them for consistency. Judgements were made for the following domains in each study in accordance with recommendations provided in Chapter 8 of the Cochrane Handbook for Systematic Reviews of Interventions (Higgins 2012).
-
Random sequence generation (selection bias).
-
Allocation concealment (selection bias).
-
Blinding (performance bias and detection bias).
-
Incomplete outcome data (attrition bias).
-
Selective reporting.
We did not exclude trials on the basis of risk of bias but conducted sensitivity analyses to explore the effects of including unblinded study comparisons.
Measures of treatment effect
Direct pairwise meta‐analysis
We analysed data for the two continuous outcomes as fixed‐effect mean differences (MDs) with 95% confidence intervals (CIs) and a fixed‐effect model. The fixed‐effect model assumes that each study is estimating exactly the same intervention effect, and the random‐effects model assumes that estimated intervention effects are not all the same but follow a normal distribution across studies.
Data were extracted and analysed as change from baseline in all studies, and this was extracted from text or tables or was calculated from figures when necessary. Associated variance for change per arm was not always available (or could not be derived from the presented information), and in these cases we used available data from other trials to estimate a population variance. For SGRQ and trough FEV1, we calculated the mean of available standard deviations (SDs) for change scores, which was weighted by sample size.
Network meta‐analysis
We conducted a network meta‐analysis (NMA) to estimate the effect for each class and for each individual intervention using Markov chain Monte Carlo methods implemented in WinBUGS 1.4.3. Analyses were based on a class model, which assumes that effects of individual treatments within a class are exchangeable and are distributed around a class mean (Cooper 2009). Correlations in multiarm trials were accounted for in the model, which was adapted from Dias 2013. Non‐informative normal priors were used for class effects, and Uniform (0,5) and (0,100) prior distributions were used for between‐trials and between‐classes heterogeneity SDs for SGRQ and FEV1, respectively. Three chains with different initial values were run simultaneously to assess convergence using Brooks‐Gelman–Rubin diagnostic plots. The first 20,000 (fixed‐effect models) or 40,000 iterations (random‐effects models) were discarded, and 50,000 further iterations were run, on which all estimates are based. We decided whether to use a fixed‐effect or a random‐effects approach on the basis of model fit statistics and deviance information criteria (DIC) (Dias 2013; Spiegelhalter 2002), as well as the amount of heterogeneity present in the pair‐wise meta‐analyses. The model with lower values on the DIC was preferred, with differences of three or more units considered meaningful. If two models had similar DIC, the simplest model (i.e. fixed‐effect) was preferred.
Unit of analysis issues
No unit of analysis issues were noted, as we did not analyse any dichotomous data.
Dealing with missing data
When data or study characteristics were not reported in the primary publication, we searched clinical trial reports, trial registries and drug company websites to look for additional data. When possible, we used data from intention‐to‐treat (ITT) analyses from all randomly assigned participants.
Assessment of heterogeneity
In the presence of statistical heterogeneity (I2 > 30%) in the direct pair‐wise meta‐analysis, we analysed data using a random‐effects model and investigated possible sources. They could be of a clinical and methodological nature (i.e. differences between individual studies) in study design (inclusion/exclusion criteria, study duration), participants' baseline characteristics (disease severity, co‐morbidities, age, gender), risk of bias (open vs blinded studies) or study sponsorship. The extent of heterogeneity observed informed our decision of whether to use fixed‐effect or random‐effects models for the network meta‐analysis.
For the network meta‐analysis, we assessed the extent to which direct evidence and indirect evidence were consistent both qualitatively and statistically (Dias 2013a; Lu 2006). Consistency refers to the agreement between direct and one or more indirect sources of evidence in a “closed loop” of trials (i.e. a path by which three or more trials are connected, starting and ending with the same node) (Lu 2006). We assessed consistency by comparing model fit from a consistency and 'independent mean effects' model and by informally comparing output from the NMA versus estimates from the pair‐wise meta‐analyses. We used this global test to determine the presence of inconsistency and to locate areas in the network at which large inconsistencies were present. The output from the network meta‐analysis was informally compared with estimates from the pair‐wise meta‐analyses to check for broad agreement. When evidence of inconsistency was found, we further investigated potential sources of inconsistency using the node‐split approach (Dias 2010), as this was most appropriate given the structure of the networks. In cases in which substantial inconsistency was identified, we explored factors, including participant and design characteristics, that might contribute to inconsistency, and we restricted our analysis to a subset of trials for which the evidence might be more comparable.
Assessment of reporting biases
We tried to minimise reporting bias from non‐publication of studies or selective outcome reporting by using a broad search strategy, and by checking references of included studies and relevant systematic reviews. For each outcome, we commented on the proportion of studies contributing data to the analysis.
Data synthesis
Using a class‐model network meta‐analysis, we modelled the relative effectiveness of any two classes as a function of each class relative to a reference treatment (placebo). We prespecified five unique classes of interventions (or nodes) in the network: LABA (salmeterol, formoterol and indacaterol), LAMA (tiotropium, aclidinium bromide and glycopyrronium bromide), ICS (fluticasone, budesonide and mometasone), LABA/ICS (salmeterol/fluticasone, formoterol/budesonide and formoterol/mometasone) and placebo. We estimated the probability that each class ranks at one of the five possible positions (e.g. the best, second best, third best). We obtained estimates of each overall class effect, as well as of the effects of each treatment within the class compared with every other. Estimates for within‐class variability in treatment effects, as well as for between‐class variability in treatment effects, are presented, as are ranking probabilities, in tables and figures as appropriate.
Subgroup analysis and investigation of heterogeneity
We planned to perform subgroup analyses based on baseline disease severity and dose, provided that treatments could be compared indirectly with other trial comparisons through one or more common comparators (i.e. the networks remained 'connected'). However, differences in individual doses were built into the network structure, and baseline disease severity was assessed across nodes as part of the transitivity assessment.
For the network meta‐analysis, available data were insufficient to include baseline severity as a co‐variate as a way of exploring subgroup effects. We extracted key severity criteria for each trial individually, and we summarised the data across pair‐wise comparisons to investigate potential differences.
Sensitivity analysis
We assessed the robustness of our analyses by performing sensitivity analyses, excluding studies from the overall analysis of high risk of bias due to lack of blinding (participants and personnel and/or outcome assessors), and by considering separately studies of different duration.
Results
Description of studies
Basic study characteristics, including duration, intervention details and population characteristics, are summarised in Table 1, and full details of each included study can be found in Characteristics of included studies.
| Study ID | Weeks | Arms includeda | N | Ageb | % male | % pred FEV1b | Pack‐yearsb |
| 24 | tiotropium, placebo | 856 | 64.2 | 64.9 | 43.3 | 46.9 | |
| 52 | aclidinium, placebo | 843 | 62.4 | 78.6 | 53.9 | 39.9 | |
| 52 | aclidinium, placebo | 804 | 65.1 | 63.0 | 50.3 | 57.9 | |
| 52 | salmeterol, salmeterol/fluticasone | 797 | 65.4 | 54 | 34.0 | 57.2 | |
| 24 | aclidinium (2), placebo | 828 | 62.4 | 67.4 | 52.5 | 40.2 | |
| 48 | tiotropium, placebo | 3991 | 64.8 | 77.6 | 39.9 | 46 | |
| 48 | tiotropium (2), placebo | 1990 | 65.0 | 74.2 | 37.7 | nr | |
| 26 | indacaterol, tiotropium, glycopyrronium, placebo | 1667 | 64.0 | 74.9 | 55.0 | nr | |
| 26 | budesonide, placebo | 79 | 66 | 78.6 | 36.5 | 51 | |
| 26 | salmeterol, tiotropium, placebo | 1207 | 64.2 | 76.3 | 38.5 | 43.8 | |
| 156 | fluticasone, placebo | 751 | 63.8 | 74.6 | 50.2 | 44 | |
| 52 | formoterol, budesonide, formoterol/budesonide, placebo | 1122 | 64 | 76 | 36 | 39 | |
| 52 | salmeterol, fluticasone, salmeterol/fluticasone, placebo | 1466 | 63.2 | 72.5 | 44.7 | 42.3 | |
| 52 | mometasone, placebo | 631 | nr | nr | 47 | nr | |
| 156 | salmeterol, fluticasone, salmeterol/fluticasone, placebo | 6185 | 65.0 | 75.8 | 44.0 | 48.5 | |
| 52 | mometasone (2), placebo | 911 | 65.1 | 68.3 | 42.3 | nr | |
| 48 | formoterol, formoterol/budesonide | 718 | 63.9 | 81.3 | 42.4 | 38.8 | |
| 26 | formoterol, placebo | 432 | 55 | 67 | 53.6 | 37 | |
| 52 | tiotropium, placebo | 921 | 65 | 65.0 | 38.7 | 61.4 | |
| 48 | tiotropium, placebo | 913 | 66.8 | 59.7 | 39.4 | 50.6 | |
| 104 | tiotropium, placebo | 519 | 64.6 | 77.3 | 38.2 | 51.7 | |
| 52 | formoterol, placebo | 867 | 63.5 | 31.9 | 51.7 | 40.8 | |
| 52 | salmeterol, salmeterol/fluticasone, placebo | 18 | nr | 83.3 | 50.0 | 41.4 | |
| 26 | formoterol, mometasone, formoterol/mometasone (2), placebo | 1196 | 59.7 | 75.2 | 38.6 | 45.1 | |
| 26 | indacaterol (2), tiotropium, placebo | 1683 | 63.6 | 62.8 | 55.6 | 49.7 | |
| 48 | tiotropium, placebo | 1010 | 64.7 | 88 | 47.9 | nr | |
| 52 | tiotropium, salmeterol/fluticasone | 126 | 62.5 | 73.8 | nr | nr | |
| 52 | salmeterol, salmeterol/fluticasone | 782 | 64.9 | 55 | 32.8 | 56.5 | |
| 26 | fluticasone (2), placebo | 640 | 64.4 | 68.8 | nr | nr | |
| 52 | aclidinium (2) | 605 | nr | nr | 46.5 | nr | |
| 26 | glycopyrronium, placebo | 822 | 63.9 | 81.8 | 54.6 | 44.8 | |
| 52 | glycopyrronium, tiotropium, placebo | 1066 | 63.6 | 64.2 | 56.0 | 49.1 | |
| 26 | salmeterol, fluticasone, salmeterol/fluticasone, placebo | 723 | 63.9 | 63.1 | 42 | 56.5 | |
| 43 | salmeterol, salmeterol/fluticasone | 994 | 63.9 | 75.8 | 40.4 | 36.9 | |
| 26 | salmeterol, placebo | 339 | 63.3 | 74.7 | 53.3 | 40.3 | |
| 130 | fluticasone (2), salmeterol/fluticasone, placebo | 114 | 61 | 86.6 | 55.3 | 44.3 | |
| 26 | budesonide, placebo | 49 | nr | nr | nr | nr | |
| 26 | salmeterol, fluticasone, salmeterol/fluticasone, placebo | 674 | 63.5 | 65.8 | 41 | 40.8 | |
| 26 | salmeterol, tiotropium | 90 | nr | 91 | nr | nr | |
| 26 | tiotropium, placebo | 1829 | 67.9 | 98.5 | 35.6 | 68.4 | |
| 26 | salmeterol, salmeterol/fluticasone | 639 | nr | nr | nr | nr | |
| 26 | budesonide, placebo | 26 | 65.4 | 69.2 | 59.2 | 45.0 | |
| 26 | fluticasone, placebo | 281 | 63 | 74 | 57 | nr | |
| 156 | budesonide, placebo | 1277 | 52.5 | 72.9 | 76.9 | 39.3 | |
| 52 | tiotropium, placebo | 142 | 66.4 | 62.9 | 50.0 | 55.2 | |
| 104 | budesonide, placebo | 39 | 55 | 100 | 63.5 | nr | |
| 52 | formoterol, budesonide, formoterol/budesonide, placebo | 1964 | 63.2 | 63.9 | 39.6 | 40 (med) | |
| 52 | formoterol (2), placebo | 645 | 62.7 | 83.3 | nr | nr | |
| 156 | fluticasone, placebo | 190 | 59.0 | 70.5 | 64.5 | 28.3 | |
| 26 | salmeterol, salmeterol/fluticasone | 1050 | 63.6 | 77.8 | nr | nr | |
| 52 | salmeterol/fluticasone, fluticasone, placebo | 387 | 64.8 | 82 | nr | nr | |
| 156 | salmeterol, salmeterol/fluticasone | 186 | 65.7 | 61.3 | nr | nr | |
| 26 | budesonide, placebo | 26 | 60.5 | 53.5 | nr | nr | |
| 104+ | budesonide, placebo | 254 | 63.6 | 58.3 | 52 | 56 | |
| 52 | formoterol, budesonide/formoterol (2) | 1219 | 63.0 | 62.0 | 37.7 | 44.3 | |
| 26 | salmeterol, placebo | 34 | 63.8 | 88.3 | nr | nr | |
| 64 | tiotropium (OL), glycopyrronium | 1483 | 63.4 | 74.1 | nr | nr | |
| 52 | formoterol, budesonide, formoterol/budesonide, placebo | 812 | 64 | 78.8 | 36.2 | 44.5 | |
| 26 | formoterol, budesonide, formoterol/budesonide (3), placebo | 1704 | 63.4 | 66.9 | 39.9 | 40 (med) | |
| 208 | tiotropium, placebo | 5993 | 64.5 | 74.7 | 39.4 | 48.7 | |
| 26 | formoterol, mometasone, formoterol/mometasone (2), placebo | 1055 | 59.8 | 77.5 | nr | 40.4 | |
| 52 | salmeterol, indacaterol | 186 | 69.1 | nr | 53 | nr | |
| 39 | tiotropium, placebo | 554 | 64.2 | 86.1 | 46.9 | 43.7 | |
| 24 | tiotropium, placebo | 457 | 61.8 | 68.4 | nr | nr | |
| 26 | fluticasone, placebo | 23 | 55 | 82.3 | 63.5 | 25.5 | |
| 156 | budesonide, placebo | 290 | 59.1 | 87.5 | 86.6 | nr | |
| 26 | formoterol, tiotropium, placebo | 640 | 62.6 | 77.5 | 51.4 | 38.0 | |
| 52 | salmeterol, tiotropium | 7384 | 62.9 | 74.7 | 49.3 | 38.3 | |
| 104 | tiotropium, salmeterol/fluticasone | 1323 | 64.5 | 82.5 | 39.3 | 40.4 | |
| 24 | salmeterol/fluticasone, placebo | 448 | 66.3 | 88.6 | nr | nr | |
| 24 | budesonide, formoterol/budesonide | 308 | 65.2 | 95.1 | 32.7 | nr |
aNumbers in parentheses indicate multiple doses of the same treatment.
bAge, % predicted FEV1 and pack‐years smoked are reported as means unless otherwise stated.
bid = twice daily.
FEV1 = forced expiratory volume in one second.
ICS = inhaled corticosteroid.
LABA = long‐acting beta2‐agonist.
LABA/ICS = long‐acting beta2‐agonist/inhaled corticosteroid combination therapy.
LAMA = long‐acting muscarinic antagonist.
nr = not reported.
PBO = placebo inhaler.
qd = once daily.
Results of the search
Results of the search are presented in Figure 1, broken down by the search for Cochrane reviews on the left and the electronic database search on the right.
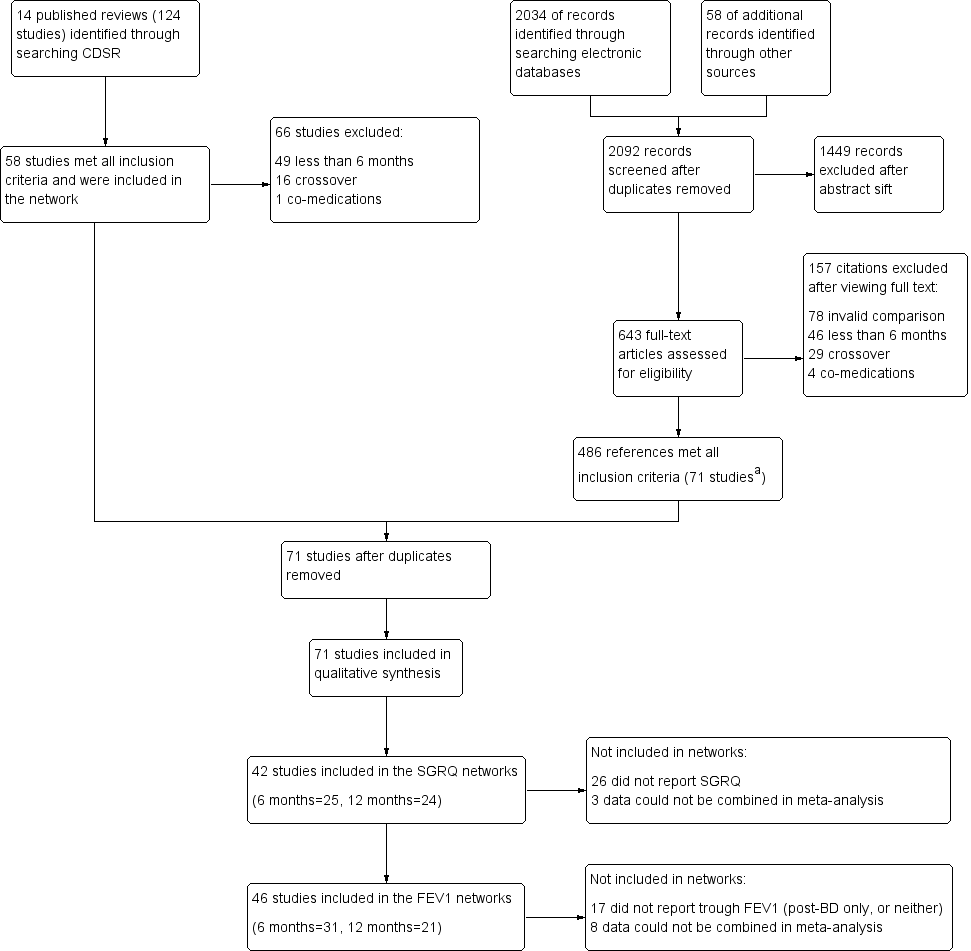
Study flow diagram.
aAll 58 studies identified in the review search were also identified in the electronic database search.
Abbreviations: CDSR = Cochrane Database of Systematic Reviews.
Fourteen relevant Cochrane reviews were identified (Chong 2012; Geake 2012; Karner 2011; Karner 2011a; Karner 2012; Karner 2012a; Kew 2013; Kew 2014; Nannini 2012; Nannini 2013; Nannini 2013a; Spencer 2011; Welsh 2013; Yang 2012a), including a total of 124 studies. Sixty‐six studies were excluded because of differences in the reviews' inclusion criteria, most commonly, 'duration less than six months' (n = 49), and 'cross‐over design' (n = 16). The remaining 58 studies were included in the review.
Searching the CAGR of trials returned 2034 references, and 58 additional references were identified by searching reference lists and drug company websites. We excluded 1449 references after sifting titles and abstracts, and we reviewed full texts after studification for the remaining 643. Four hundred eighty‐six references met all inclusion criteria, most of which related to the 58 studies identified from the review search. The remaining references were collated into 13 additional studies that met the inclusion criteria. The most common reasons for excluding citations after viewing full texts were 'invalid comparison for this review' (n = 78), 'duration less than six months' (n = 46) and 'cross‐over design' (n = 29).
Included studies
Seventy‐one studies met the inclusion criteria, randomly assigning 73,062 people with a diagnosis of COPD to 184 treatment arms of interest (including placebo). The number of participants included in the trials ranged from 18 (Dal Negro 2003) to 7384 (Vogelmeier 2011 [POET]); the mean number per arm of a trial was 397. Table 1 lists all 71 studies that met the inclusion criteria, along with their total duration, treatment arms relevant to the network and summary characteristics for each study population. Table 2 and Table 3 present pooled characteristics for each class and for individual nodes within them for studies contributing data to the SGRQ and trough FEV1 data sets, respectively.
| Comparison | Comparisons | N | Ageb | % male | % FEV1c | Packsd |
| LABA vs placebo | 16 | 13,808 | 62.9 | 74.7 | 46.2 | 42.5 |
| LAMA vs placebo | 15 | 22,406 | 64.2 | 71.3 | 47.1 | 47.5 |
| ICS vs placebo | 10 | 8153 | 63.4 | 74.9 | 41.7 | 42.7 |
| LABA/ICS vs placebo | 10 | 9097 | 63.1 | 75.3 | 39.7 | 42.4 |
| LABA vs LAMA | 2 | 2680 | 63.7 | 69.5 | 55.2 | 49.7 |
| LABA vs ICS | 7 | 6226 | 62.7 | 73.8 | 40.0 | 42.7 |
| LABA vs LABA/ICS | 13 | 12,505 | 63.1 | 71.0 | 38.8 | 43.9 |
| LAMA vs ICS | 0 | ‐ | ‐ | ‐ | ‐ | ‐ |
| LAMA vs LABA/ICS | 1 | 1323 | 64.5 | 82.5 | 39.3 | 40.4 |
| ICS vs LABA/ICS | 10 | 8721 | 62.9 | 75.3 | 38.8 | 42.9 |
aSummary population data are for all study comparisons excluding those made in the 29 studies that could not be included in either the six‐month or the 12‐month SGRQ network.
bAge = mean years.
c% FEV1 = mean percentage predicted FEV1.
dPacks = mean pack‐years.
FEV1 = forced expiratory volume in one second.
ICS = inhaled corticosteroid.
LABA = long‐acting beta2‐agonist.
LABA/ICS = long‐acting beta2‐agonist/inhaled corticosteroid combination therapy.
LAMA = long‐acting muscarinic antagonist.
SGRQ = St George's Respiratory Questionnaire.
| Comparison | Comparisons | N | Ageb | % male | %FEV1c | Packsd |
| LABA vs Placebo | 13 | 8680 | 63.3 | 73.2 | 47.7 | 43.9 |
| LAMA vs Placebo | 16 | 23,111 | 64.3 | 72.2 | 47.6 | 48.9 |
| ICS vs Placebo | 12 | 4574 | 63.6 | 71.9 | 46.2 | 45.2 |
| LABA/ICS vs Placebo | 9 | 4978 | 63.9 | 73.5 | 41.6 | 44.4 |
| LABA vs LAMA | 2 | 2680 | 63.7 | 69.5 | 55.2 | 49.7 |
| LABA vs ICS | 5 | 2506 | 63.6 | 67.1 | 40.6 | 46.7 |
| LABA vs LABA/ICS | 12 | 8005 | 63.7 | 68.8 | 39.9 | 45.8 |
| LAMA vs ICS | 0 | ‐ | ‐ | ‐ | ‐ | ‐ |
| LAMA vs LABA/ICS | 0 | ‐ | ‐ | ‐ | ‐ | ‐ |
| ICS vs LABA/ICS | 8 | 4560 | 63.6 | 71.7 | 39.0 | 45.5 |
aSummary population data are for all study comparisons excluding those made in the 23 studies that could not be included in either the six‐month or the 12‐month FEV1 network; all doses are given in micrograms.
bAge = mean years.
c% FEV1 = mean percentage predicted FEV1.
dPacks = mean pack‐years.
FEV1 = forced expiratory volume in one second.
ICS = inhaled corticosteroid.
LABA = long‐acting beta2‐agonist.
LABA/ICS = long‐acting beta2‐agonist/inhaled corticosteroid combination therapy.
LAMA = long‐acting muscarinic antagonist.
Design and duration
All of the studies were parallel‐group, randomised controlled trials, and most were conducted at multiple centres in several countries. A vast majority were double‐blind; five included one open‐label treatment (see sensitivity analyses), a subset were double‐blind and double‐dummy and blinding was unclear in four others.
All studies had a randomly assigned treatment period of at least 24 weeks. Similar numbers of six‐month and 12‐month studies were identified (n = 30 and n = 29, respectively), but six‐month data were available in a number of the longer trials. Twelve studies lasted between two and four years (Burge 2000 [ISOLDE]; Calverley 2007 [TORCH]; Cooper 2010; Lapperre 2009; Pauwels 1999; Renkema 1996; Schermer 2009; SCO40041; Shaker 2009; Tashkin 2008a [UPLIFT]; Vestbo 1999; Wedzicha 2008 [INSPIRE]). For these studies, we used data measured and reported for six and 12 months in the NMA, rather than endpoint. Data entered in the six‐month analysis were reported between 24 and 32 weeks, and data included in the 12‐month networks were measured between 44 and 56 weeks in the individual studies.
Participant inclusion and exclusion criteria
The trials were relatively consistent in their key inclusion and exclusion criteria. All studies required a clinical diagnosis of COPD, and most specified that this was in accordance with recent guidelines (usually ATS/ERS 2004 or GOLD). The cutoff for forced expiratory volume in one second (FEV1) expressed as the percentage predicted normal value ranged from 50% to 80%. Additional inclusion criteria that were common across trials were these: smokers or ex‐smokers with a smoking history of at least 10 pack‐years, 40 years of age or older and FEV1/FVC ratio less than 70%.
Exclusion criteria that were common across most trials were these: history of asthma or other respiratory disease, any significant disease other than COPD and the need for supplemental oxygen. Patients who had a COPD exacerbation or upper respiratory tract infection in the run up to screening (usually within four to six weeks) were usually excluded. Trials often listed additional exclusion criteria specific to the drugs under study, such as sensitivities to active ingredients, or medical conditions that might be affected by known adverse effects.
Baseline characteristics of participants in the trials
Baseline characteristics are presented for all included studies in Table 1, and for the subsets of studies contributing data to the SGRQ and FEV1 analyses in Table 2 and Table 3, respectively.
In the SGRQ data set, the overall mean age per class was very similar, ranging from 62.9 to 64.5 years. In the FEV1 data set, the overall mean age for each comparison was also very similar, ranging from 63.3 to 64.3. Both data sets consistently included more men than women, and the means of trial percentages were similar between and within comparisons (SGRQ range 69.5% to 82.5%, FEV1 range 67.1% to 73.2%). As might be expected from variation in inclusion criteria, greater variability was noted in the summary statistics for percentage predicted FEV1, with the LABA versus LAMA comparison having somewhat higher scores in both data sets than the other classes (both means around 55% compared with 39% to 47% in the other comparisons). Overall, most population means for percentage predicted FEV1 were less than 50% predicted. Mean pack‐years were between 40 and 50 for all comparisons in both data sets. In general, the data indicated a fairly consistent moderate to severe population across both outcome data sets and across direct between‐class comparisons, which satisfied the transitivity assumption.
Characteristics of the interventions
Table 4 shows the distribution of treatment arms across all 71 included studies, organised by the five prespecified treatment classes. The text below summarises information about all 71 included studies. Table 2 and Table 3 show the number of studies making each class comparison represented in the SGRQ or FEV1 analyses, respectively.
aStudies not contributing data to either outcome.
bid = twice daily.
ICS = inhaled corticosteroid.
LABA = long‐acting beta2‐agonist.
LABA/ICS = long‐acting beta2‐agonist/inhaled corticosteroid combination therapy.
LAMA = long‐acting muscarinic antagonist.
PBO = placebo inhaler.
qd = once daily.
Lists of allowed co‐medications varied between studies, but participants were always allowed a short‐acting beta‐agonist reliever inhaler and short‐term treatment for exacerbations during the randomised period (course of oral corticosteroids or antibiotics).
1. Long‐acting beta2‐agonists (LABAs)
Thirty‐seven LABA treatment arms were identified across 30 studies (n = 15,266). Twelve studies included a formoterol arm with treatment given at 12 mcg twice daily, and Rossi 2002 also randomly assigned participants to a higher dose of twice‐daily 24 mcg. Formoterol was most commonly given via a dry powder inhaler but sometimes via a metered‐dose inhaler (to retain blinding in the newer multiarm mometasone studies). Salmeterol was given at 50 mcg twice daily in 17 studies (n = 9019), primarily via the Diskus device. Indacaterol, a once‐daily preparation, was given as 150 mcg in three studies (Bateman 2013 [SHINE]; Donohue 2010 [INHANCE]; Kornmann 2011) and as 300 mcg in three studies (Dahl 2010; Donohue 2010 [INHANCE]; To 2011), one of which also used a higher dose of 600 mcg. Donohue 2010 [INHANCE] was conducted in two stages, and the data derived are for the four randomly assigned groups from stage 2.
2. Long‐acting muscarinic antagonists (LAMAs)
Thirty‐four LAMA treatment arms were included across 28 studies (n = 21,805). Most studies used tiotropium 18 mcg daily, delivered most often via the HandiHaler. Six studies included two arms that met criteria for inclusion in the LAMA category: Bateman 2010b used two tiotropium doses (5 and 10 mcg daily via Respimat), ATTAIN 2011 and Gelb 2012 used two aclidinium doses (200 and 400 mcg daily) and Bateman 2013 [SHINE], GLOW2 2012 and SPARK 2013 included both glycopyrronium 50 mcg and open‐label tiotropium. Two additional glycopyrronium studies used 50 mcg via the Breezhaler, and two other aclidinium studies used the lower of the two doses via the Genuair device. Two other tiotropium studies used the Respimat device to deliver 5 mcg daily (Abrahams 2013 and Bateman 2010a).
3. Inhaled corticosteroids (ICSs)
Twenty‐seven studies included an ICS arm (n = 6788), with two including two doses of the same drug that were relevant to the review (Calverley 2008; FLTA3025). Twelve studies (n = 3491) reported a fluticasone arm: two studies used 250 mcg twice daily, and the rest 500 mcg, delivered most often via the Diskus device. Twelve studies with around half as many people used budesonide (n = 1900): two at the higher dose of 800 mcg twice daily, and the rest at 400 mcg, with both doses delivered via dry powder inhalers. Mometasone was used in four studies (n = 1397) and was given as 400 mcg twice daily or 800 mcg once daily.
4. Long‐acting beta2‐agonist/inhaled corticosteroid combinations (LABA/ICS)
Thirty LABA/ICS treatment arms were identified in 25 studies (n = 9727). Three studies used two budesonide doses (160 mcg and 320 mcg; Rennard 2009; Sharafkhaneh 2012; Tashkin 2008 [SHINE]), and seven additional studies used only the higher dose (total N = 3221). Two identically designed studies included two formoterol/mometasone doses each, 200 and 400 mcg (n = 888). Sixteen studies had a salmeterol/fluticasone arm (n = 5618), six at the lower ICS dose of 50/250 mcg and 11 at the higher dose of 50/500 mcg. All LABA/ICS inhalers were prescribed for twice‐daily use and drugs were delivered by dry powder or pressurised metered‐dose inhalers.
5. Placebo
Most studies included a placebo control arm (n = 55), which consisted of a total of 19,476 people. Inhalers varied across studies depending on the device used to deliver the study drugs. Once‐daily and twice‐daily placebos were combined in the same node as the reference treatment to increase the number of comparisons that could be made.
Transitivity (similarity of participants, interventions and trial methodology)
-
Inclusion and exclusion criteria, as described above, did not vary systematically across classes; although variation in the allowed co‐medications and in the maximum allowed percentage predicted FEV1 was noted, these did not translate to systematic differences in the characteristics of the recruited population.
-
Baseline characteristics were varied between individual trials, but summary baseline characteristics were comparable across pair‐wise comparisons between classes for both outcome data sets (see above and Table 2; Table 3). Mean percentage predicted FEV1 was somewhat higher in the LABA versus LAMA comparisons conducted in two studies (55% vs 39% to 47% in the other comparisons).
-
Intervention characteristics introduced some potential sources of systematic variation between trials, notably as a result of the devices used and the dosing schedule. However, as all nodes showed variation in the delivery device used and in once‐daily and twice‐daily regimens, we did not consider these factors to violate assumptions needed for indirect comparisons. The placebo‐controlled trials used matching inhalers to control for bias at a trial level, and variation within classes was similar, so we considered a combined placebo class valid as the reference treatment (regardless of device or dosing regimen).
-
Methodology was similar across trials, and no issues with the comparability of trial duration arose, as we included only data relevant to the time points specified. Funding sources varied across classes, depending on the drug manufacturers, but this variability did not translate into systematic differences in the way that trials were conducted, nor in the populations recruited (i.e. similar inclusion criteria, baseline characteristics and study designs). Average sample size per class was higher in the LAMA trials (659 and 633 for SGRQ and FEV1, respectively) than in the four other classes (range 189 to 471 across both outcome data sets), but variation within the classes was comparable.
Outcomes and analysis structure
For both outcomes, the overall fit of the network meta‐analysis class model was compared with the fit of a class model without the consistency assumption (broadly equivalent to a pair‐wise meta‐analysis with random class effects), using the total residual deviance. Statistical inconsistency was not significant on SGRQ at 12 months nor on the FEV1 analyses (six and 12 months). However some evidence of inconsistency was noted in the network for SGRQ at six months. This was investigated further using the node‐split approach (Dias 2010), which found some evidence of inconsistency (P value 0.01, although multiple comparisons were made) in the direct evidence comparing indacaterol 150 mcg and tiotropium 18 mcg. We investigated the possible clinical explanation for this inconsistency and found that studies directly comparing these two treatments delivered tiotropium open‐label, which affected comparability with other tiotropium studies, and increased risk of bias (see sensitivity analyses). The dose was misclassified in one study comparing salmeterol versus salmeterol/fluticasone combination (salmeterol/fluticasone as 50/500 bid instead of 50/250). Because the study did not appear in the main six‐month results nor change the class comparisons, we did not rerun the analyses.
St George's Respiratory Questionnaire (SGRQ)
The SGRQ is a well‐validated and widely used measure of health status in patients with chronic airflow limitation; the total score ranges from zero (perfect health) to 100 (most severe status) and includes the three components of symptoms, activity and impacts.
In the main network of effects at six months, 18 of 25 possible treatments were represented across 72 treatment arms in 25 studies (n = 27,024). The fixed‐effect model was preferred, as statistical heterogeneity was not significant. We extracted and analysed data as change from baseline per arm and estimated population variance on the basis of data from studies reporting variance for change per arm (see Measures of treatment effect). The mean of SDs, weighted by sample size, was imputed as 14 when variance for change could not be obtained.
The 12‐month analysis contained slightly fewer data and had a broadly similar structure (containing data for 19 treatment comparisons in 24 studies). The fixed‐effect model was preferred, as with the six‐month analysis, but Calverley 2003 [TRISTAN] showed some lack of fit. Data from four studies were removed from the six‐month network in the blinding sensitivity analysis (Bateman 2013 [SHINE]; Donohue 2010 [INHANCE]; GLOW2 2012; SPARK 2013), and data from two studies were removed from the 12‐month network (GLOW2 2012; SPARK 2013).
The network structure for SGRQ at six months is shown in Figure 2.
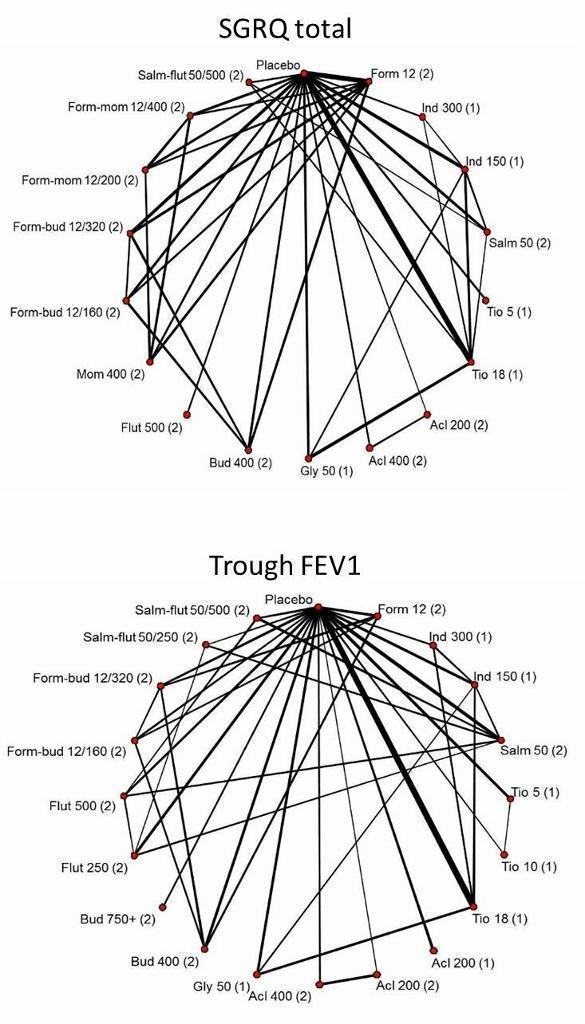
Network structures for both outcomes at six months.
Trough forced expiratory volume in one second (FEV1)
In the main network of effects at six months, 20 of 25 possible treatments were represented across 82 treatment arms in 31 studies (n = 29,271). A random‐effects model was preferred, as the fixed‐effect model has very poor fit. Data for eight studies were available only as treatment contrasts, and the rest were entered as change from baseline per arm, along with the associated variance. For trials reporting treatment contrasts, we included co‐variance, which was calculated as the variance of the mean in the control arm (placebo for all trials). For the rest of the trials, missing variance for change from baseline was imputed as 283 (mL) from the mean of available SDs weighted by sample size.
One very small trial was excluded from the six‐month analysis (SLMF4010, n = 34) because of the unusually high dropout from already very small groups (seven of 17 dropped out in both groups). The study showed very poor fit, even in random‐effects models, because the results contradicted all other trials.
The 12‐month analysis contained fewer data (19 treatments compared in 21 studies) but again had a structure broadly similar to the main six‐month analysis. As with the six‐month analysis, the random‐effects model was preferred, as the fixed‐effect model had very poor fit. Data from the same four studies were removed from the six‐month and 12‐month networks, as for the SGRQ sensitivity analyses (see Table 5).
| Study ID | Arm removed | Analyses affected |
| Tiotropium 18 mcg | SGRQ6m, FEV6m | |
| Tiotropium 18 mcg | SGRQ6m, FEV6m | |
| Tiotropium 18 mcg | SGRQ6m, FEV6m, SGRQ12m, FEV12m | |
| Whole study (2 arms) | SGRQ6m, FEV6m, SGRQ12m, FEV12m | |
| Tiotropium 18 mcg | Did not appear in analyses |
FEV = forced expiratory volume in one second
SGRQ = St George's Respiratory Questionnaire
6m = six month analysis
12m = 12 month analysis
The network structure for trough FEV1 at six months is shown in Figure 2.
Sensitivity analyses
Five studies included a randomly assigned group that received tiotropium as an open‐label treatment (Bateman 2013 [SHINE]; Donohue 2010 [INHANCE]; GLOW2 2012; SPARK 2013; Vogelmeier 2008). As this introduced the potential for performance and assessment bias, we removed these arms from the affected networks in a risk of bias sensitivity analysis, as detailed in Table 5. Blinding led to unclear or high risk of bias in four additional studies, mainly as the result of insufficient reporting, but none of the studies reported data that could be included in the networks (Fang 2008; Mahmud 2007; Ohar 2013; To 2011).
As stated in the protocol, we analysed separately data collected at six months and at 12 months.
Excluded studies
Sixty‐six studies were excluded from the 14 relevant Cochrane reviews, and five others that came up in the electronic database search are recorded in Characteristics of excluded studies. We did not record every reference excluded after the full‐text sift (n = 157), as review of the full paper revealed that most trials were apparently of less than six months' duration, or they compared treatments that were not within the scope of the study.
Risk of bias in included studies
Methodological quality of the included studies was generally good. Across all six domains, around 60% of judgements were 'low risk', and 13% were 'high' risk. It is unlikely that the evidence presented in this review is affected by biases associated with unacceptable sequence generation, and most trials were double‐blinded. The most common reasons for probable bias were attrition and selective reporting in the individual trials. A degree of uncertainly regarding the risk of bias associated with allocation concealment and blinding of outcome assessors was due mostly to insufficient reporting. Risk of bias judgements for all of the included studies are summarised in Figure 3
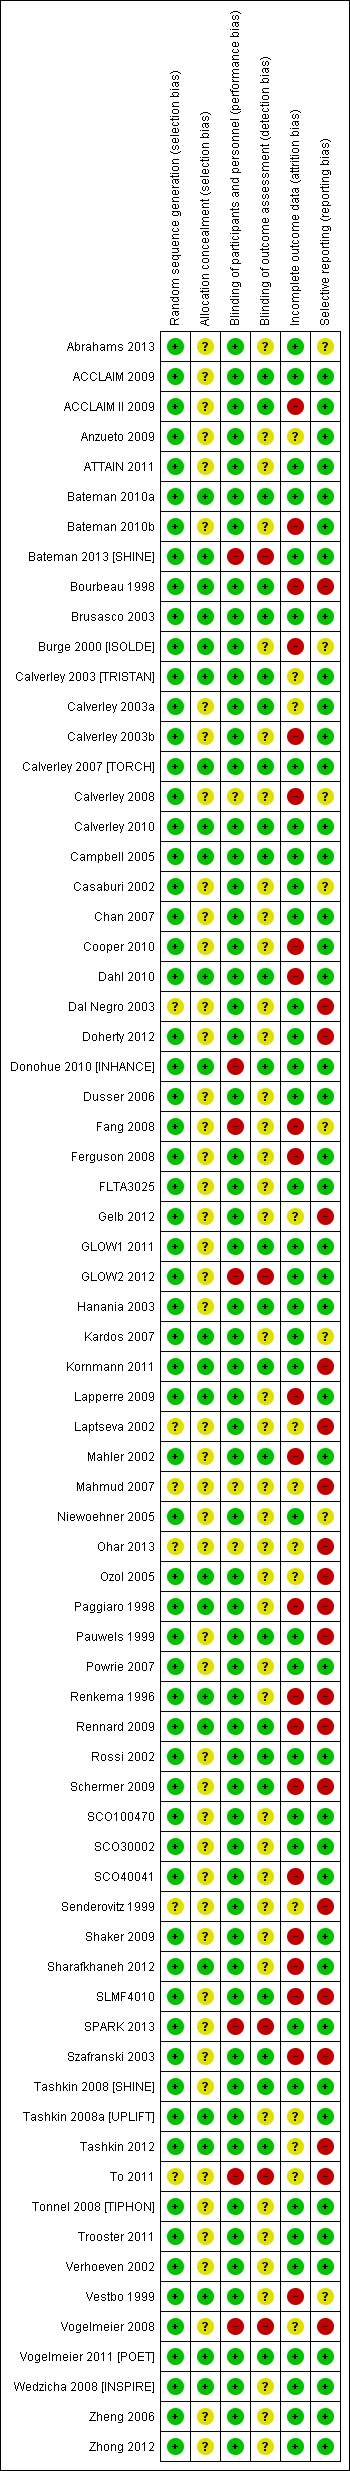
Risk of bias summary: review authors' judgements about each risk of bias item for each included study.
Allocation
Random sequence generation
All studies were randomised trials, and none were given high risk ratings for either of the selection bias domains. Most were funded by drug manufacturers with whom the authors had had previous contact to confirm methods of sequence generation. As such, all studies were considered to be at low risk of bias for this domain, with the exception of six studies for which only a conference abstract was available (rated unclear). Of these, none appeared in the SGRQ data set, and only two contributed FEV1 data.
Allocation concealment
A third of studies described methods of allocation concealment (interactive voice response system or sealed envelopes) and were rated as having low risk of bias (n = 24). The remaining studies did not explicitly describe their methods and were rated as unclear. This information is likely to be conservative given the high proportion of industry‐funded trials, which generally have rigorous controls for selection bias.
Blinding
Blinding of participants and personnel
A large majority of trials stated that they were double‐blind, which, unless otherwise stated, was understood to pertain to at least participants and personnel. For this reason, more than 85% of the trials were rated at low risk for performance bias. Seven trials (10%) were given a high risk of bias rating, which was due mostly to the fact that one arm of the trial was delivered open‐label. In these instances, treatment comparisons that did not involve the open‐label arm were not affected, and sensitivity analyses removing these arms assessed the effects of removing these high‐risk comparisons from the networks.
Blinding of outcome assessors
A third of trials gave enough detail to warrant a low risk of bias rating, which was usually obtained from the clinicaltrials.gov registration. Most trials did not describe how outcomes were assessed in sufficient detail to rule out bias associated with unblinded outcome assessors and hence were rated as unclear. As with allocation concealment, an unclear rating for studies not explicitly describing outcome assessor blinding is likely to be conservative. Five studies were rated as high risk for the same reasons outlined for the participant and personnel domain.
Incomplete outcome data
Around half the trials were judged to be at low risk of bias because the level of dropout was acceptable and balanced between groups, or because sufficient efforts were made to impute missing data. Twenty‐two trials were given a high risk rating, indicating a significant risk that unbalanced or especially high attrition may have compromised the validity of the results, and 13 were rated as unclear. However, several of the high risk ratings were given to the longer trials (two years or longer), in which a significant proportion of participants had dropped out by the end of the trial. By including data at the six‐month and 12‐month time points rather than at endpoint in these unusual trials, the risk from attrition may be reduced, as higher percentages of the randomly assigned populations were generally included in the earlier analyses.
Selective reporting
Most trials could be linked to a prospectively registered protocol for cross‐checking of reported outcomes (on clinicaltrials.gov or manufacturers' websites). Most reported the named outcomes well in published reports, and a subset had additionally posted results summaries on clinicaltrials.gov, warranting a low risk rating (n = 43). A third were judged to be at high risk of bias, usually because outcomes stated in the protocol or important study methods were missing from published reports, regardless of whether this directly affected our analyses. Some trials were rated at high risk of bias because SGRQ or FEV1 data were reported but not in an acceptable format to be combined in meta‐analysis. Although some early trials did not use the SGRQ or used a different FEV1 measurement for legitimate reasons, this fact and selective outcome reporting resulted in omission of a significant proportion of relevant trials from the SGRQ and FEV1 analyses. Eight were rated as unclear, usually because a protocol could not be located to confirm that all planned outcomes had been reported.
Effects of interventions
For each outcome, we presented six‐month data for the main analyses, along with the number of treatments included, the number of pair‐wise comparisons made and estimates of model fit and heterogeneity. Results are presented first as class effects and second for individual treatments. As the class analysis assumes that treatments within the same class are exchangeable and are distributed around a class mean, we have also outlined the effects of fitting the class model on individual treatment effects.
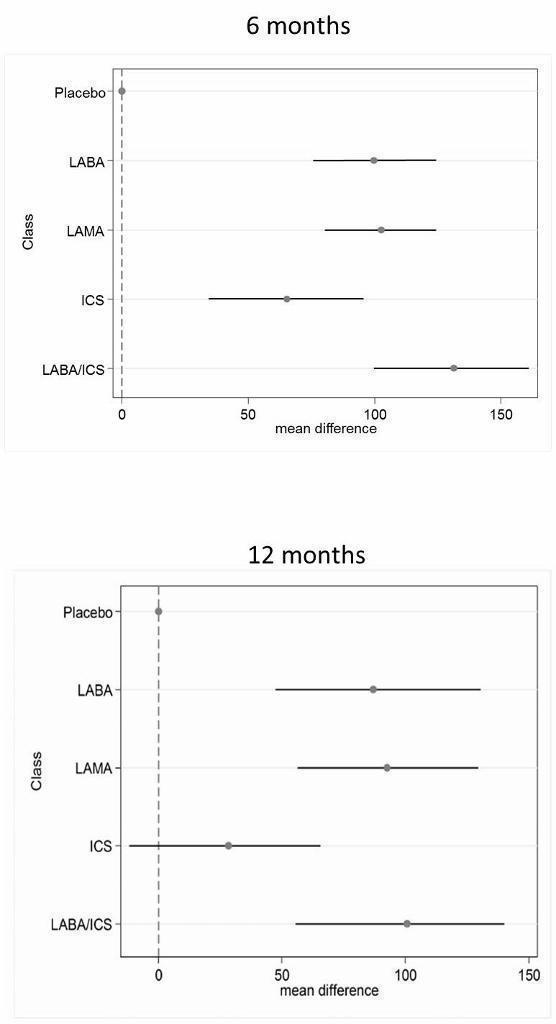
Results from the 12‐month networks for each outcome are also presented (shown graphically alongside the six‐month class results in Figure 4 and Figure 5), and sensitivity analyses for risk of bias (open‐label delivery) are presented for the six‐month class analyses.

St George's Respiratory Questionnaire (SGRQ) change from baseline—six‐month and 12‐month class results.
Trough forced expiratory volume in one second (FEV1) change from baseline—six‐month and 12‐month class results.
St George's Respiratory Questionnaire
Across six months and 12 months, 42 studies with 118 individual treatment nodes were included in the networks (n = 54,613).
Main analysis—six months
Eighteen treatments were compared over a total of 72 treatment arms in 25 studies (n = 27,024). Thirty‐nine pair‐wise comparisons were made, and the fixed‐effect model was preferred because statistical heterogeneity was not significant (DIC random = 214.9, fixed = 214.5).
Class effects
Table 6 shows each class effect relative to placebo (i.e. the combined treatment benefit over placebo), expressed as change from baseline. The classes are also ranked (mean and median) and are presented with estimates of the probability that each is the best class. Figure 4 displays class effects against the reference treatment (placebo), shown by the vertical dashed line on the right‐hand side of the graph.
| Effect vs placebo | Effect vs placebo | Rank | ||||||
| Class | Median | 95% CrI | Median | 95% CrI | Mean | Median | 95% CrI | Pr (best) |
| LABA/ICS | ‐3.89 | (‐4.70 to ‐2.97) | ‐3.89 | (‐4.66 to ‐3.05) | 1.0 | 1 | (1 to 2) | 0.96 |
| LAMA | ‐2.63 | (‐3.53 to ‐1.97) | ‐2.78 | (‐3.58 to ‐2.13) | 2.4 | 2 | (1 to 4) | 0.03 |
| LABA | ‐2.29 | (‐3.18 to ‐1.53) | ‐2.09 | (‐2.93 to ‐1.36) | 3.1 | 3 | (2 to 4) | 0.01 |
| ICS | ‐2.00 | (‐3.06 to ‐0.87) | ‐1.96 | (‐2.99 to ‐0.91) | 3.5 | 4 | (2 to 4) | 0.00 |
aFor effects versus placebo, smaller values indicate larger benefits of the active treatment; all doses are given in micrograms.
Crl = credible interval.
SGRQ = St George's Respiratory Questionnaire.
ICS = inhaled corticosteroid.
LABA = long‐acting beta2‐agonist.
LABA/ICS = long‐acting beta2‐agonist/inhaled corticosteroid.
LAMA = long‐acting antimuscarinic antagonist.
NWMA = network meta‐analysis.
Pr = probability.
Combination LABA/ICS was the highest ranked treatment, with a mean improvement over placebo of 3.89 units (95% credible interval (CrI) ‐4.70 to ‐2.97). LAMAs and LABAs were ranked second and third, with mean differences of ‐2.63 (95% CrI ‐3.53 to ‐1.97) and ‐2.29 (95% CrI ‐3.18 to ‐1.53), respectively, but a large degree of overlap was noted between their credible intervals. Inhaled corticosteroids were the fourth ranked class but still showed a mean two‐unit benefit over placebo at six months (95% CrI ‐3.06 to ‐0.87). Figure 6 shows graphs of the probabilities that each class ranks in any one of the five possible positions. The median within‐class variance was 0.44 units (95% CrI 0.03 to 1.09).

St George's Respiratory Questionnaire (SGRQ) probability ranking diagrams—six months and 12 months.
Individual treatment effects
Effects relative to placebo are presented separately for each treatment in Table 7, along with ranks and estimates with and without the class model for comparison. The credible intervals for each treatment were wide and largely overlapping (for both ranks and mean differences from placebo).
| Rank (from class NWMA) | Effect vs placebo | Effect vs placebo | Rank (from class NWMA) | ||||||
| Class | Treatment (number daily doses) | Median | 95% CrI | Median | 95% CrI | Mean | Median | 95% CrI | Pr (best) |
| LABA | Form 12 (2) | ‐1.84 | (‐2.60 to ‐0.94) | ‐1.20 | (‐2.10 to ‐0.30) | 14.9 | 15 | (10 to 17) | 0.00 |
| Ind 300 (1) | ‐2.38 | (‐3.63 to ‐1.44) | ‐3.10 | (‐4.86 to ‐1.36) | 11.3 | 12 | (5 to 17) | 0.00 | |
| Ind 150 (1) | ‐2.75 | (‐3.95 to ‐1.85) | ‐3.67 | (‐4.76 to ‐2.58) | 8.7 | 8 | (3 to 16) | 0.01 | |
| Salm 50 (2) | ‐2.20 | (‐2.98 to ‐1.43) | ‐2.27 | (‐3.27 to ‐1.27) | 12.9 | 13 | (7 to 17) | 0.00 | |
| LAMA | Tio 5 (1) | ‐2.50 | (‐3.16 to ‐1.86) | ‐2.42 | (‐3.20 to ‐1.63) | 10.5 | 10 | (6 to 16) | 0.00 |
| Tio 18 (1) | ‐2.53 | (‐3.12 to ‐1.97) | ‐2.66 | (‐3.33 to ‐1.99) | 10.3 | 10 | (6 to 15) | 0.00 | |
| Acl 200 (2) | ‐2.66 | (‐4.04 to ‐1.70) | ‐3.79 | (‐6.14 to ‐1.45) | 9.1 | 9 | (2 to 16) | 0.01 | |
| Acl 400 (2) | ‐2.81 | (‐4.40 to ‐1.90) | ‐4.59 | (‐6.94 to ‐2.23) | 7.9 | 7 | (1 to 15) | 0.03 | |
| Gly 50 (1) | ‐2.63 | (‐3.42 to ‐1.94) | ‐2.83 | (‐3.74 to ‐1.91) | 9.5 | 9 | (5 to 15) | 0.00 | |
| ICS | Bud 400 (2) | ‐1.76 | (‐2.82 to ‐0.55) | ‐0.97 | (‐2.32 to 0.38) | 14.9 | 16 | (7 to 17) | 0.00 |
| Flut 500 (2) | ‐1.95 | (‐3.07 to ‐0.74) | ‐1.71 | (‐3.40 to ‐0.01) | 13.9 | 15 | (6 to 17) | 0.00 | |
| Mom 400 (2) | ‐2.28 | (‐3.51 to ‐1.19) | ‐2.77 | (‐4.47 to ‐1.09) | 11.9 | 13 | (5 to 17) | 0.00 | |
| LABA/ICS | Form‐bud 12/160 (2) | ‐4.04 | (‐4.91 to ‐3.15) | ‐3.85 | (‐4.99 to ‐2.70) | 2.6 | 2 | (1 to 6) | 0.29 |
| Form‐bud 12/320 (2) | ‐3.80 | (‐4.63 to ‐2.84) | ‐3.31 | (‐4.39 to ‐2.22) | 3.9 | 4 | (1 to 9) | 0.10 | |
| Form‐mom 12/200 (2) | ‐3.85 | (‐4.82 to ‐2.66) | ‐3.45 | (‐5.17 to ‐1.74) | 3.7 | 4 | (1 to 10) | 0.15 | |
| Form‐mom 12/400 (2) | ‐3.75 | (‐4.72 to ‐2.48) | ‐3.09 | (‐4.81 to ‐1.37) | 4.3 | 4 | (1 to 11) | 0.10 | |
| Salm‐flut 50/500 (2) | ‐4.05 | (‐4.97 to ‐3.18) | ‐4.36 | (‐5.60 to ‐3.12) | 2.6 | 2 | (1 to 6) | 0.31 | |
aFor effects versus placebo, smaller values indicate larger benefits of the active treatment; all doses are given in micrograms.
Crl = credible interval.
SGRQ = St George's Respiratory Questionnaire.
ICS = inhaled corticosteroid.
LABA = long‐acting beta2‐agonist.
LABA/ICS = long‐acting beta2‐agonist/inhaled corticosteroid.
LAMA = long‐acting antimuscarinic antagonist.
NWMA = network meta‐analysis.
Pr = probability.
Individual treatment effects of particular note within a class were associated with indacaterol and aclidinium for LABA and LAMA, respectively. Effects for both doses of each of these drugs were dampened by the class model in the six‐month SGRQ network (indacaterol by 0.72 and 0.92 for 300 mcg and 150 mcg, respectively, and aclidinium by 1.13 and 1.78 for 200 mcg and 400 mcg, respectively). Treatments of note for which estimates were inflated by fitting the class model were formoterol 12 mcg (by 0.64), budesonide 400 mcg (by 0.79) and formoterol/mometasone combination 2/400 mcg (by 0.66).
Additional analyses
12 months
Nineteen treatments were compared in 24 studies, but a dose comparison of aclidinium made in Gelb 2012 was disconnected from the rest of the network. These treatments can be used in class analysis, as they “borrow” the class effect. The fixed‐effect model was preferred.
In the class analysis (Appendix 4 and Figure 4), LABA/ICS combinations remained the highest ranked at 12 months, with only a slightly smaller mean effect over placebo than at six months (‐3.60, 95% CrI ‐4.63 to ‐2.34). Compared with the six‐month analysis, LABA, LAMA and ICS showed more similar benefits over placebo at 12 months, ranging between ‐2.34 and ‐2.55, with similar credible intervals. Within‐class variance was slightly larger than in the six‐month analysis (median 0.53, 95% CrI 0.04 to 1.27).
Individual treatment effects for the 12‐month analysis are presented in Appendix 5.
Sensitivity analysis—blinding
Table 6 shows how the six‐month effects were affected by removal of data at high risk of bias for blinding (see 'Effect vs placebo sensitivity analysis'). The difference between point estimates of LAMA over LABA was larger with less overlap in the credible intervals, and within‐class variance was smaller than in the main analysis (median 0.35, 95% CrI 0.02 to 0.98). Inconsistency associated with Donohue 2010 [INHANCE] was resolved by removing the open‐label tiotropium arm, but unexplained poor fit of three further trials remained (Kornmann 2011; Rennard 2009; Tashkin 2012). As all open‐label arms removed were given tiotropium, it is possible that the expected treatment benefit over placebo in these studies was reduced by lack of blinding for these comparisons, which dampened the overall treatment effect within the LAMA class.
Trough FEV1
Across six months and 12 months, 46 studies with 120 individual treatment nodes were included in the networks (n = 47,409).
Main analysis—six months
Twenty treatments were compared over a total of 82 treatment arms in 31 studies (n = 29,271). Forty‐one pair‐wise comparisons were made. The random‐effects model was preferred (DIC = 691), as the fixed‐effect model has very poor fit (DIC = 719.1).
Class effects
Table 8 shows each class effect relative to placebo. As for SGRQ, the classes are also ranked (mean and median) and are presented with estimates of the probability that each is the best. Figure 6 displays trough FEV1 class effects (mL) compared with placebo.
| Effect vs placebo | Effect vs placebo | Rank | ||||||
| Class | Median | 95% CrI | Median | 95% CrI | Mean | Median | 95% CrI | Pr (best) |
| LABA/ICS | 133.30 | (100.60 to 164.00) | 132.80 | (98.93 to 165.60) | 1.1 | 1 | (1 to 2) | 0.9 |
| LAMA | 103.50 | (81.78,124.90) | 103.60 | (79.01 to 126.60) | 2.4 | 2 | (1 to 3) | 0.1 |
| LABA | 99.44 | (71.98,127.80) | 99.86 | (70.41 to 130.50) | 2.6 | 3 | (1 to 4) | 0.0 |
| ICS | 65.36 | (33.06,96.91) | 65.52 | (31.23 to 97.16) | 3.9 | 4 | (3 to 4) | 0.0 |
aFor effects versus placebo, smaller values indicate larger benefits of the active treatment; all doses are given in micrograms.
Crl = credible interval.
FEV1 = forced expiratory volume in one second.
ICS = inhaled corticosteroid.
LABA = long‐acting beta2‐agonist.
LABA/ICS = long‐acting beta2‐agonist/inhaled corticosteroid.
LAMA = long‐acting antimuscarinic antagonist.
NWMA = network meta‐analysis.
Pr = probability.
Results at six months showed a similar pattern to the SGRQ analysis. Combination LABA/ICS was the highest ranked treatment, with a mean improvement over placebo of 133.3 mL (95% CrI 100.6 to 164.0) after six months. As was the case for quality of life, LAMAs and LABAs were ranked second and third, with mean differences of 103.5 (95% CrI 81.8 to 124.9) and 99.4 (95% CrI 72.0 to 127.8), respectively, but again a large degree of overlap was noted between the credible intervals. Inhaled corticosteroids were the fourth ranked class but still showed a mean 65.4 mL benefit over placebo at six months (95% CrI 33.1 to 96.9). The median within‐class variance was 9.04 mL (95% CrI 0.41 to 34.85). Figure 7 shows graphs of the probabilities that each class ranks in any one of the five possible positions.
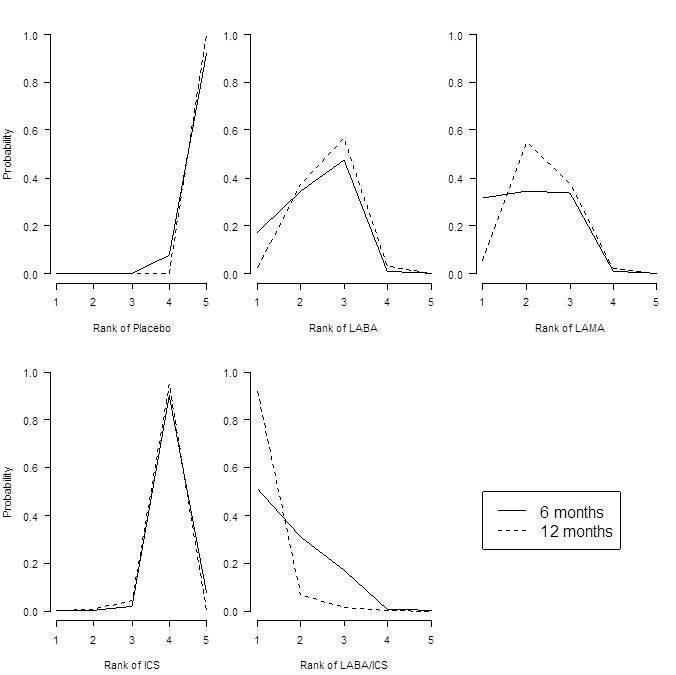
Forced expiratory volume in one second (FEV1) probability ranking diagrams—six months and 12 months.
Individual treatment effects
Effects relative to placebo are presented separately for each treatment in Table 9, along with ranks and estimates with and without the class model for comparison.
| Effect vs placebo | Effect vs placebo | Rank (from class NWMA) | |||||||
| Class | Treatment (number daily doses) | Median | 95% CrI | Median | 95% CrI | Mean | Median | 95% CrI | Pr (best) |
| LABA | Form 12 (2) | 94.88 | (60.70 to 122.80) | 53.92 | (13.00 to 94.07) | 12.0 | 13 | (5 to 18) | 0.00 |
| Ind 300 (1) | 103.30 | (71.95 to 150.10) | 137.90 | (63.69 to 209.90) | 9.5 | 10 | (2 to 16) | 0.02 | |
| Ind 150 (1) | 99.53 | (72.32 to 127.20) | 100.70 | (65.74 to 133.80) | 10.8 | 12 | (4 to 16) | 0.00 | |
| Salm 50 (2) | 101.00 | (73.39 to 130.70) | 114.70 | (75.96 to 149.30) | 10.3 | 11 | (4 to 16) | 0.00 | |
| LAMA | Tio 5 (1) | 105.40 | (81.87 to 131.80) | 110.50 | (73.82 to 145.40) | 8.9 | 9 | (3 to 15) | 0.01 |
| Tio 10 (1) | 106.40 | (79.80 to 142.00) | 121.00 | (62.88 to 175.20) | 8.6 | 8 | (2 to 15) | 0.02 | |
| Tio 18 (1) | 105.20 | (85.54 to 125.50) | 107.00 | (82.93 to 129.50) | 9.0 | 9 | (4 to 15) | 0.00 | |
| Acl 200 (1) | 98.83 | (59.06 to 123.20) | 59.31 | (9.47 to 107.90) | 11.3 | 11 | (5 to 18) | 0.00 | |
| Acl 200 (2) | 100.60 | (65.20 to 127.10) | 74.82 | (11.81 to 134.20) | 10.7 | 11 | (4 to 17) | 0.00 | |
| Acl 400 (2) | 107.30 | (80.93 to 143.50) | 108.80 | (45.06 to 168.30) | 8.2 | 8 | (2 to 15) | 0.02 | |
| Gly 50 (1) | 103.60 | (79.83 to 127.50) | 101.50 | (67.86 to 133.40) | 9.5 | 10 | (3 to 15) | 0.00 | |
| ICS | Bud 400 (2) | 61.89 | (23.86 to 94.06) | 14.59 | (‐29.22 to 58.25) | 17.6 | 18 | (14 to 19) | 0.00 |
| Bud 750+ (2) | 63.10 | (14.75 to 99.65) | ‐2.26 | (‐95.77 to 91.34) | 17.3 | 18 | (12 to 19) | 0.00 | |
| Flut 250 (2) | 66.78 | (34.19 to 101.10) | 76.18 | (29.36 to 122.30) | 16.9 | 17 | (11 to 19) | 0.00 | |
| Flut 500 (2) | 72.16 | (40.20 to 109.80) | 97.04 | (54.90 to 138.40) | 15.9 | 16 | (8 to 19) | 0.00 | |
| LABA/ICS | Form‐bud 12/160 (2) | 131.10 | (91.65 to 164.00) | 80.84 | (26.99 to 132.70) | 3.9 | 3 | (1 to 13) | 0.16 |
| Form‐bud 12/320 (2) | 127.30 | (85.14 to 159.50) | 72.77 | (28.75 to 116.70) | 4.7 | 4 | (1 to 14) | 0.11 | |
| Salm‐flut 50/250 (2) | 139.70 | (106.20 to 182.90) | 173.00 | (116.20 to 226.40) | 2.4 | 2 | (1 to 8) | 0.39 | |
| Salm‐flut 50/500 (2) | 137.10 | (104.40 to 172.10) | 152.40 | (104.10 to 197.80) | 2.8 | 2 | (1 to 9) | 0.26 | |
aFor effects versus placebo, bigger values indicate larger benefits of the active treatment; all doses are given in micrograms.
Crl = credible interval.
FEV1 = forced expiratory volume in one second.
ICS = inhaled corticosteroid.
LABA = long‐acting beta2‐agonist.
LABA/ICS = long‐acting beta2‐agonist/inhaled corticosteroid.
LAMA = long‐acting antimuscarinic antagonist.
NWMA = network meta‐analysis.
Pr = probability.
The class model affected individual treatment effects to a lesser extent in the FEV1 network than in the SGRQ one, because less intra class variation was present. Several treatment effects that were higher than the class mean were dampened by the class model, including indacaterol 300 (by 34.6 mL) and salmeterol‐fluticasone 50/250 mcg combination therapy (by 33.3 mL). Effects for formoterol 12 mcg and both formoterol/budesonide combination doses were less favourable within their classes and were inflated by the class model (by 41.0 mL, and 50.3 and 54.5 mL, respectively). Although aclidinium was particularly effective in the SGRQ analysis, the relative effects for both lower doses on trough FEV1 appeared less favourable than other members of the LAMA class (MD 59.3 and 74.8 mL without the class model compared with the overall class mean of 103.5). Within the ICS class, the two budesonide doses showed less benefit over placebo than the two fluticasone doses. However, credible intervals for the individual treatment groups were wide and overlapping.
Additional analyses
12 months
Nineteen treatments were compared in 22 studies. As with the 12‐month SGRQ analysis, the dose comparison of aclidinium made in Gelb 2012 was disconnected from the rest of the network. The random‐effects model was preferred (DIC = 485.4), as the fixed‐effect model had very poor fit (DIC = 557.4).
In the class analysis (Appendix 6 and Figure 6), LABA/ICS remained the highest ranked treatment strategy, although the effect over placebo was lower than at six months (100 mL, 95% CrI 55.5 to 140.1). As with SGRQ, the benefit of LAMA over LABA was much less clear at 12 months, and their credible intervals showed a large degree of overlap with each other and with the LABA/ICS class. Within‐class variance was larger than in the six‐month analysis (median 18.02, 95% CrI 1.22 to 47.80).
Individual treatment effects for the 12‐month analysis are presented in Appendix 7.
Sensitivity analysis—blinding
Table 8 shows how the six‐month effects were influenced by removal of data at high risk of bias for blinding. Within‐class variance was similar to that in the main analysis (median 10.49, 95% CrI 0.54 to 37.66). The effects were very similar with and without the open‐label data, unlike in the SGRQ analysis. This may reflect the nature of the two measurements, with SGRQ perhaps more susceptible to performance or detection bias than measures of lung function.
Discussion
Summary of main results
Evidence from good quality and similar trials supports LABA/ICS combination therapy as the highest ranking treatment strategy to improve quality of life and to benefit lung function in the included trials (mostly with participants whose FEV1 was less than 50% predicted). Combination therapy gave an average benefit of 3.9 units over placebo at six months (95% CrI ‐4.70 to ‐2.97). LAMAs (MD ‐2.63, 95% CrI ‐3.53 to ‐1.97) were ranked second and LABAs ranked third at six months (MD ‐2.29, 95% CrI ‐3.18 to ‐1.53), especially when trials at high risk of bias were not included, but the difference between these classes was small, and a large degree of overlap was noted in their estimates.
Combination LABA/ICS was the highest ranked class for trough FEV1, with a mean improvement over placebo of 133.3 mL at six months (95% CrI 100.6 to 164.0). As was the case for SGRQ, LAMAs ranked second (MD 103.5, 95% CrI 81.8 to 124.9) and LABAs ranked third (MD 99.4, 95% CrI 72.0 to 127.8) at six months; ICSs were the fourth ranking class (MD 65.4 mL, 95% CrI 33.1 to 96.9).
For both outcomes, the effects of LABA and ICS monotherapies appeared to be additive at six months, but initial differences between treatment classes were less prominent after a year of treatment.
Overall completeness and applicability of evidence
The SGRQ analyses showed that combination LABA/ICS treatment had a mean difference over placebo in line with the minimal clinically important difference (MCID) of four units, and the point estimates and 95% confidence intervals of the other classes were lower than four units. However, it is not appropriate to imply that LABA/ICS provides a meaningful quality of life benefit while the other classes do not. A previous review demonstrated that a treatment that has a mean difference and 95% CI of lower than four units on the SGRQ can nevertheless lead to a significantly higher number of patients who reach a four‐unit change on the SGRQ in the treatment group than in the placebo group (Karner 2012a). For FEV1, with the exception of ICS monotherapy, treatment differences ranged from 99 to 133 mL, which is in keeping with the threshold of clinical significance suggested by Cazzola 2008 (100 to 140 mL).
National guidelines recommend the treatments included in this review (LABA, LAMA or LABA/ICS) over regular short‐acting medications for patients with exacerbations or persistent breathlessness (NICE 2011), otherwise referred to as those with moderate (stage II) or severe (stage III) COPD (GOLD). NICE 2011 recommends the addition of ICS in people who also have less than 50% predicted FEV1. By collating information about participants included in each of the included trials and assessing for transitivity, we were able to be clear about the types of patients to whom the conclusions of this review are likely to apply. Although some individual trials within the network included participants who exceeded or fell short of the criteria described in the guidelines, summary statistics suggest that participant groups in the trials fell into the moderate and severe categories, and most participants had an FEV1 of less than 50% predicted. As a result, the evidence is not applicable to those with mild symptoms. Similarly, because of the common exclusion criteria in the trials related to co‐morbidities, and asthma in particular, these findings may not be relevant to some groups of patients. Finally, because the decision was made not to include some newer treatments and combination therapies in the network, class results may not be applicable to emerging treatments.
To supplement the efficacy findings, we sought to identify evidence of cost‐effectiveness. As LABA/ICS was the most effective treatment for both outcomes and is likely to be the most costly treatment strategy in many settings, we sought to identify studies evaluating its cost‐effectiveness against other treatment options, and whether this varied across patients with varying levels of symptoms. Three recent studies based on reanalysis of clinical trials were found, all of which concluded that LABA/ICS is a cost‐effective treatment strategy for moderate to severe COPD (Chuck 2008; Earnshaw 2007; Fattore 2005). Evidence suggests that the reduction in healthcare resource use associated with LABA/ICS compared with placebo or with the single components outweighs the additional cost of combination inhalers. One study (Chuck 2008) showed that this benefit was more prominent in patients with severe disease ($39,000 per quality‐adjusted life‐year (QALY)) than in those with moderate and severe disease combined ($47,500 per QALY).
Karner 2012a raised concerns about the safety of tiotropium when delivered via the Respimat inhaler, arising from indirect comparisons between trials using Respimat and Handihaler devices. Published evidence from a very large trial that randomly assigned participants to tiotropium via Respimat or Handihaler does not show a higher risk of mortality when the Respimat inhaler was used (Wise 2013).
Quality of the evidence
We assessed the methodological quality of all included studies and concluded that risk of bias was generally low across the five domains. Uncertainties associated with allocation concealment and outcome reporting could have been resolved in part by contacting trial authors, but because most of the included studies were already included in other Cochrane reviews, it is unlikely that this would have substantially increased our confidence in the results, especially because a vast majority of trials were sponsored by manufacturers with whom we have confirmed the adequacy of methods in the past. The sensitivity analysis removing comparisons at high risk of performance or detection bias further increased our confidence in the findings.
The transitivity assumption was upheld across both outcome data sets. The trials were similar in their conduct, and when discrepancies were noted (especially with allowed co‐medications and inhaler devices), these did not appear to differ systematically between nodes or classes. Because of the nature of indirect comparisons, the similarity in baseline characteristics and methodology justified analysing the trials in a network and increased the applicability of the results. Participants randomly assigned to the LABA/ICS arms had somewhat more impaired lung function than those assigned to the other classes, but this did not translate into any real differences when transitivity across pairwise comparisons between classes was assessed. The presence of several large multi‐arm trials allowed us to combine the indirect evidence obtained via common comparators with a good quantity of head‐to‐head data within and across classes, and this increased the reliability of the network findings.
Potential biases in the review process
By including studies from existing Cochrane reviews and performing additional electronic searches to both update the data and fill gaps not covered by other reviews, it is likely that the relevant literature has been covered by this review. Around 80% of the studies included in this review had already been included in another Cochrane review and so had already been assessed for risk of bias and had data extracted by two review authors. We were not able to contact study authors to ask for additional data, but we were able to extract and include data for the vast majority of studies that measured the outcomes.
Agreements and disagreements with other studies or reviews
Several recent network meta‐analyses of treatments for COPD have been published with varying inclusion criteria and outcomes. Decramer 2013 and Dong 2013 focused on safety outcomes and included only longer‐term studies of at least six months' duration. Decramer 2013 included only LABA therapy and found no association between LABA and increased COPD‐related adverse events or mortality. In addition, "LABA treatment was generally associated with significant or numerical reductions in COPD exacerbations compared with placebo," which is in keeping with the effects of LABA shown in our review. Dong 2013 had very similar inclusion criteria to those of our network and focused on mortality. Alongside our findings on the additive efficacy of the LABA/ICS combination, the Dong 2013 network provided evidence that "LABA‐ICS was associated with the lowest risk of death among all treatments," and that "no excess risk was noted for tiotropium HandiHaler or LABA." These reviews provide comparative evidence relating to safety, especially Dong 2013, which included a similar network of treatments and listed similar trial inclusion criteria.
Cope 2012 included a similar list of COPD treatments in their network and assessed efficacy using similar outcomes on shorter time scales (SGRQ and lung function at three months). Although their focus was on indacaterol, their conclusions regarding its efficacy in comparison with older LABAs were in keeping with our findings. Similarly, a subsequent network meta‐analysis including glycopyrronium but not including LABA/ICS combinations (Cope 2013) concluded that indacaterol, glycopyrronium and tiotropium were the most favourable bronchodilators (based on evidence for SGRQ and FEV1 at three months and at six months). Although these treatments were amongst the best LABAs and LAMAs, differences between the two network meta‐analyses (i.e. the list of included treatments, time points and analysis model) explain the discrepancies in conclusions.
With regard to other important outcomes, a network meta‐analysis by Puhan 2009 focusing on exacerbations and the same treatment classes found "no evidence that one single inhaled drug regimen is more effective than another in reducing exacerbations." The authors also concluded that "inhaled corticosteroids when added to long‐acting beta‐agonists reduce exacerbations only in patients with COPD with FEV1 ≤ 40%." Because of issues of network connectivity, we did not consider it reasonable to analyse our data sets with baseline severity as a co‐variate, but Puhan 2009 raises the question of whether certain treatments may be more beneficial or may cause different adverse effects for particular patient groups.
Study flow diagram.
aAll 58 studies identified in the review search were also identified in the electronic database search.
Abbreviations: CDSR = Cochrane Database of Systematic Reviews.
Network structures for both outcomes at six months.
Risk of bias summary: review authors' judgements about each risk of bias item for each included study.
St George's Respiratory Questionnaire (SGRQ) change from baseline—six‐month and 12‐month class results.
Trough forced expiratory volume in one second (FEV1) change from baseline—six‐month and 12‐month class results.
St George's Respiratory Questionnaire (SGRQ) probability ranking diagrams—six months and 12 months.
Forced expiratory volume in one second (FEV1) probability ranking diagrams—six months and 12 months.
| Study ID | Weeks | Arms includeda | N | Ageb | % male | % pred FEV1b | Pack‐yearsb |
| 24 | tiotropium, placebo | 856 | 64.2 | 64.9 | 43.3 | 46.9 | |
| 52 | aclidinium, placebo | 843 | 62.4 | 78.6 | 53.9 | 39.9 | |
| 52 | aclidinium, placebo | 804 | 65.1 | 63.0 | 50.3 | 57.9 | |
| 52 | salmeterol, salmeterol/fluticasone | 797 | 65.4 | 54 | 34.0 | 57.2 | |
| 24 | aclidinium (2), placebo | 828 | 62.4 | 67.4 | 52.5 | 40.2 | |
| 48 | tiotropium, placebo | 3991 | 64.8 | 77.6 | 39.9 | 46 | |
| 48 | tiotropium (2), placebo | 1990 | 65.0 | 74.2 | 37.7 | nr | |
| 26 | indacaterol, tiotropium, glycopyrronium, placebo | 1667 | 64.0 | 74.9 | 55.0 | nr | |
| 26 | budesonide, placebo | 79 | 66 | 78.6 | 36.5 | 51 | |
| 26 | salmeterol, tiotropium, placebo | 1207 | 64.2 | 76.3 | 38.5 | 43.8 | |
| 156 | fluticasone, placebo | 751 | 63.8 | 74.6 | 50.2 | 44 | |
| 52 | formoterol, budesonide, formoterol/budesonide, placebo | 1122 | 64 | 76 | 36 | 39 | |
| 52 | salmeterol, fluticasone, salmeterol/fluticasone, placebo | 1466 | 63.2 | 72.5 | 44.7 | 42.3 | |
| 52 | mometasone, placebo | 631 | nr | nr | 47 | nr | |
| 156 | salmeterol, fluticasone, salmeterol/fluticasone, placebo | 6185 | 65.0 | 75.8 | 44.0 | 48.5 | |
| 52 | mometasone (2), placebo | 911 | 65.1 | 68.3 | 42.3 | nr | |
| 48 | formoterol, formoterol/budesonide | 718 | 63.9 | 81.3 | 42.4 | 38.8 | |
| 26 | formoterol, placebo | 432 | 55 | 67 | 53.6 | 37 | |
| 52 | tiotropium, placebo | 921 | 65 | 65.0 | 38.7 | 61.4 | |
| 48 | tiotropium, placebo | 913 | 66.8 | 59.7 | 39.4 | 50.6 | |
| 104 | tiotropium, placebo | 519 | 64.6 | 77.3 | 38.2 | 51.7 | |
| 52 | formoterol, placebo | 867 | 63.5 | 31.9 | 51.7 | 40.8 | |
| 52 | salmeterol, salmeterol/fluticasone, placebo | 18 | nr | 83.3 | 50.0 | 41.4 | |
| 26 | formoterol, mometasone, formoterol/mometasone (2), placebo | 1196 | 59.7 | 75.2 | 38.6 | 45.1 | |
| 26 | indacaterol (2), tiotropium, placebo | 1683 | 63.6 | 62.8 | 55.6 | 49.7 | |
| 48 | tiotropium, placebo | 1010 | 64.7 | 88 | 47.9 | nr | |
| 52 | tiotropium, salmeterol/fluticasone | 126 | 62.5 | 73.8 | nr | nr | |
| 52 | salmeterol, salmeterol/fluticasone | 782 | 64.9 | 55 | 32.8 | 56.5 | |
| 26 | fluticasone (2), placebo | 640 | 64.4 | 68.8 | nr | nr | |
| 52 | aclidinium (2) | 605 | nr | nr | 46.5 | nr | |
| 26 | glycopyrronium, placebo | 822 | 63.9 | 81.8 | 54.6 | 44.8 | |
| 52 | glycopyrronium, tiotropium, placebo | 1066 | 63.6 | 64.2 | 56.0 | 49.1 | |
| 26 | salmeterol, fluticasone, salmeterol/fluticasone, placebo | 723 | 63.9 | 63.1 | 42 | 56.5 | |
| 43 | salmeterol, salmeterol/fluticasone | 994 | 63.9 | 75.8 | 40.4 | 36.9 | |
| 26 | salmeterol, placebo | 339 | 63.3 | 74.7 | 53.3 | 40.3 | |
| 130 | fluticasone (2), salmeterol/fluticasone, placebo | 114 | 61 | 86.6 | 55.3 | 44.3 | |
| 26 | budesonide, placebo | 49 | nr | nr | nr | nr | |
| 26 | salmeterol, fluticasone, salmeterol/fluticasone, placebo | 674 | 63.5 | 65.8 | 41 | 40.8 | |
| 26 | salmeterol, tiotropium | 90 | nr | 91 | nr | nr | |
| 26 | tiotropium, placebo | 1829 | 67.9 | 98.5 | 35.6 | 68.4 | |
| 26 | salmeterol, salmeterol/fluticasone | 639 | nr | nr | nr | nr | |
| 26 | budesonide, placebo | 26 | 65.4 | 69.2 | 59.2 | 45.0 | |
| 26 | fluticasone, placebo | 281 | 63 | 74 | 57 | nr | |
| 156 | budesonide, placebo | 1277 | 52.5 | 72.9 | 76.9 | 39.3 | |
| 52 | tiotropium, placebo | 142 | 66.4 | 62.9 | 50.0 | 55.2 | |
| 104 | budesonide, placebo | 39 | 55 | 100 | 63.5 | nr | |
| 52 | formoterol, budesonide, formoterol/budesonide, placebo | 1964 | 63.2 | 63.9 | 39.6 | 40 (med) | |
| 52 | formoterol (2), placebo | 645 | 62.7 | 83.3 | nr | nr | |
| 156 | fluticasone, placebo | 190 | 59.0 | 70.5 | 64.5 | 28.3 | |
| 26 | salmeterol, salmeterol/fluticasone | 1050 | 63.6 | 77.8 | nr | nr | |
| 52 | salmeterol/fluticasone, fluticasone, placebo | 387 | 64.8 | 82 | nr | nr | |
| 156 | salmeterol, salmeterol/fluticasone | 186 | 65.7 | 61.3 | nr | nr | |
| 26 | budesonide, placebo | 26 | 60.5 | 53.5 | nr | nr | |
| 104+ | budesonide, placebo | 254 | 63.6 | 58.3 | 52 | 56 | |
| 52 | formoterol, budesonide/formoterol (2) | 1219 | 63.0 | 62.0 | 37.7 | 44.3 | |
| 26 | salmeterol, placebo | 34 | 63.8 | 88.3 | nr | nr | |
| 64 | tiotropium (OL), glycopyrronium | 1483 | 63.4 | 74.1 | nr | nr | |
| 52 | formoterol, budesonide, formoterol/budesonide, placebo | 812 | 64 | 78.8 | 36.2 | 44.5 | |
| 26 | formoterol, budesonide, formoterol/budesonide (3), placebo | 1704 | 63.4 | 66.9 | 39.9 | 40 (med) | |
| 208 | tiotropium, placebo | 5993 | 64.5 | 74.7 | 39.4 | 48.7 | |
| 26 | formoterol, mometasone, formoterol/mometasone (2), placebo | 1055 | 59.8 | 77.5 | nr | 40.4 | |
| 52 | salmeterol, indacaterol | 186 | 69.1 | nr | 53 | nr | |
| 39 | tiotropium, placebo | 554 | 64.2 | 86.1 | 46.9 | 43.7 | |
| 24 | tiotropium, placebo | 457 | 61.8 | 68.4 | nr | nr | |
| 26 | fluticasone, placebo | 23 | 55 | 82.3 | 63.5 | 25.5 | |
| 156 | budesonide, placebo | 290 | 59.1 | 87.5 | 86.6 | nr | |
| 26 | formoterol, tiotropium, placebo | 640 | 62.6 | 77.5 | 51.4 | 38.0 | |
| 52 | salmeterol, tiotropium | 7384 | 62.9 | 74.7 | 49.3 | 38.3 | |
| 104 | tiotropium, salmeterol/fluticasone | 1323 | 64.5 | 82.5 | 39.3 | 40.4 | |
| 24 | salmeterol/fluticasone, placebo | 448 | 66.3 | 88.6 | nr | nr | |
| 24 | budesonide, formoterol/budesonide | 308 | 65.2 | 95.1 | 32.7 | nr | |
| aNumbers in parentheses indicate multiple doses of the same treatment. bAge, % predicted FEV1 and pack‐years smoked are reported as means unless otherwise stated. bid = twice daily. FEV1 = forced expiratory volume in one second. ICS = inhaled corticosteroid. LABA = long‐acting beta2‐agonist. LABA/ICS = long‐acting beta2‐agonist/inhaled corticosteroid combination therapy. LAMA = long‐acting muscarinic antagonist. nr = not reported. PBO = placebo inhaler. qd = once daily. | |||||||
| Comparison | Comparisons | N | Ageb | % male | % FEV1c | Packsd |
| LABA vs placebo | 16 | 13,808 | 62.9 | 74.7 | 46.2 | 42.5 |
| LAMA vs placebo | 15 | 22,406 | 64.2 | 71.3 | 47.1 | 47.5 |
| ICS vs placebo | 10 | 8153 | 63.4 | 74.9 | 41.7 | 42.7 |
| LABA/ICS vs placebo | 10 | 9097 | 63.1 | 75.3 | 39.7 | 42.4 |
| LABA vs LAMA | 2 | 2680 | 63.7 | 69.5 | 55.2 | 49.7 |
| LABA vs ICS | 7 | 6226 | 62.7 | 73.8 | 40.0 | 42.7 |
| LABA vs LABA/ICS | 13 | 12,505 | 63.1 | 71.0 | 38.8 | 43.9 |
| LAMA vs ICS | 0 | ‐ | ‐ | ‐ | ‐ | ‐ |
| LAMA vs LABA/ICS | 1 | 1323 | 64.5 | 82.5 | 39.3 | 40.4 |
| ICS vs LABA/ICS | 10 | 8721 | 62.9 | 75.3 | 38.8 | 42.9 |
| aSummary population data are for all study comparisons excluding those made in the 29 studies that could not be included in either the six‐month or the 12‐month SGRQ network. bAge = mean years. c% FEV1 = mean percentage predicted FEV1. dPacks = mean pack‐years. FEV1 = forced expiratory volume in one second. ICS = inhaled corticosteroid. LABA = long‐acting beta2‐agonist. LABA/ICS = long‐acting beta2‐agonist/inhaled corticosteroid combination therapy. LAMA = long‐acting muscarinic antagonist. SGRQ = St George's Respiratory Questionnaire. | ||||||
| Comparison | Comparisons | N | Ageb | % male | %FEV1c | Packsd |
| LABA vs Placebo | 13 | 8680 | 63.3 | 73.2 | 47.7 | 43.9 |
| LAMA vs Placebo | 16 | 23,111 | 64.3 | 72.2 | 47.6 | 48.9 |
| ICS vs Placebo | 12 | 4574 | 63.6 | 71.9 | 46.2 | 45.2 |
| LABA/ICS vs Placebo | 9 | 4978 | 63.9 | 73.5 | 41.6 | 44.4 |
| LABA vs LAMA | 2 | 2680 | 63.7 | 69.5 | 55.2 | 49.7 |
| LABA vs ICS | 5 | 2506 | 63.6 | 67.1 | 40.6 | 46.7 |
| LABA vs LABA/ICS | 12 | 8005 | 63.7 | 68.8 | 39.9 | 45.8 |
| LAMA vs ICS | 0 | ‐ | ‐ | ‐ | ‐ | ‐ |
| LAMA vs LABA/ICS | 0 | ‐ | ‐ | ‐ | ‐ | ‐ |
| ICS vs LABA/ICS | 8 | 4560 | 63.6 | 71.7 | 39.0 | 45.5 |
| aSummary population data are for all study comparisons excluding those made in the 23 studies that could not be included in either the six‐month or the 12‐month FEV1 network; all doses are given in micrograms. bAge = mean years. c% FEV1 = mean percentage predicted FEV1. dPacks = mean pack‐years. FEV1 = forced expiratory volume in one second. ICS = inhaled corticosteroid. LABA = long‐acting beta2‐agonist. LABA/ICS = long‐acting beta2‐agonist/inhaled corticosteroid combination therapy. LAMA = long‐acting muscarinic antagonist. | ||||||
| Study ID | Arm removed | Analyses affected |
| Tiotropium 18 mcg | SGRQ6m, FEV6m | |
| Tiotropium 18 mcg | SGRQ6m, FEV6m | |
| Tiotropium 18 mcg | SGRQ6m, FEV6m, SGRQ12m, FEV12m | |
| Whole study (2 arms) | SGRQ6m, FEV6m, SGRQ12m, FEV12m | |
| Tiotropium 18 mcg | Did not appear in analyses | |
| FEV = forced expiratory volume in one second SGRQ = St George's Respiratory Questionnaire 6m = six month analysis 12m = 12 month analysis | ||
| Effect vs placebo | Effect vs placebo | Rank | ||||||
| Class | Median | 95% CrI | Median | 95% CrI | Mean | Median | 95% CrI | Pr (best) |
| LABA/ICS | ‐3.89 | (‐4.70 to ‐2.97) | ‐3.89 | (‐4.66 to ‐3.05) | 1.0 | 1 | (1 to 2) | 0.96 |
| LAMA | ‐2.63 | (‐3.53 to ‐1.97) | ‐2.78 | (‐3.58 to ‐2.13) | 2.4 | 2 | (1 to 4) | 0.03 |
| LABA | ‐2.29 | (‐3.18 to ‐1.53) | ‐2.09 | (‐2.93 to ‐1.36) | 3.1 | 3 | (2 to 4) | 0.01 |
| ICS | ‐2.00 | (‐3.06 to ‐0.87) | ‐1.96 | (‐2.99 to ‐0.91) | 3.5 | 4 | (2 to 4) | 0.00 |
| aFor effects versus placebo, smaller values indicate larger benefits of the active treatment; all doses are given in micrograms. Crl = credible interval. SGRQ = St George's Respiratory Questionnaire. ICS = inhaled corticosteroid. LABA = long‐acting beta2‐agonist. LABA/ICS = long‐acting beta2‐agonist/inhaled corticosteroid. LAMA = long‐acting antimuscarinic antagonist. NWMA = network meta‐analysis. Pr = probability. | ||||||||
| Rank (from class NWMA) | Effect vs placebo | Effect vs placebo | Rank (from class NWMA) | ||||||
| Class | Treatment (number daily doses) | Median | 95% CrI | Median | 95% CrI | Mean | Median | 95% CrI | Pr (best) |
| LABA | Form 12 (2) | ‐1.84 | (‐2.60 to ‐0.94) | ‐1.20 | (‐2.10 to ‐0.30) | 14.9 | 15 | (10 to 17) | 0.00 |
| Ind 300 (1) | ‐2.38 | (‐3.63 to ‐1.44) | ‐3.10 | (‐4.86 to ‐1.36) | 11.3 | 12 | (5 to 17) | 0.00 | |
| Ind 150 (1) | ‐2.75 | (‐3.95 to ‐1.85) | ‐3.67 | (‐4.76 to ‐2.58) | 8.7 | 8 | (3 to 16) | 0.01 | |
| Salm 50 (2) | ‐2.20 | (‐2.98 to ‐1.43) | ‐2.27 | (‐3.27 to ‐1.27) | 12.9 | 13 | (7 to 17) | 0.00 | |
| LAMA | Tio 5 (1) | ‐2.50 | (‐3.16 to ‐1.86) | ‐2.42 | (‐3.20 to ‐1.63) | 10.5 | 10 | (6 to 16) | 0.00 |
| Tio 18 (1) | ‐2.53 | (‐3.12 to ‐1.97) | ‐2.66 | (‐3.33 to ‐1.99) | 10.3 | 10 | (6 to 15) | 0.00 | |
| Acl 200 (2) | ‐2.66 | (‐4.04 to ‐1.70) | ‐3.79 | (‐6.14 to ‐1.45) | 9.1 | 9 | (2 to 16) | 0.01 | |
| Acl 400 (2) | ‐2.81 | (‐4.40 to ‐1.90) | ‐4.59 | (‐6.94 to ‐2.23) | 7.9 | 7 | (1 to 15) | 0.03 | |
| Gly 50 (1) | ‐2.63 | (‐3.42 to ‐1.94) | ‐2.83 | (‐3.74 to ‐1.91) | 9.5 | 9 | (5 to 15) | 0.00 | |
| ICS | Bud 400 (2) | ‐1.76 | (‐2.82 to ‐0.55) | ‐0.97 | (‐2.32 to 0.38) | 14.9 | 16 | (7 to 17) | 0.00 |
| Flut 500 (2) | ‐1.95 | (‐3.07 to ‐0.74) | ‐1.71 | (‐3.40 to ‐0.01) | 13.9 | 15 | (6 to 17) | 0.00 | |
| Mom 400 (2) | ‐2.28 | (‐3.51 to ‐1.19) | ‐2.77 | (‐4.47 to ‐1.09) | 11.9 | 13 | (5 to 17) | 0.00 | |
| LABA/ICS | Form‐bud 12/160 (2) | ‐4.04 | (‐4.91 to ‐3.15) | ‐3.85 | (‐4.99 to ‐2.70) | 2.6 | 2 | (1 to 6) | 0.29 |
| Form‐bud 12/320 (2) | ‐3.80 | (‐4.63 to ‐2.84) | ‐3.31 | (‐4.39 to ‐2.22) | 3.9 | 4 | (1 to 9) | 0.10 | |
| Form‐mom 12/200 (2) | ‐3.85 | (‐4.82 to ‐2.66) | ‐3.45 | (‐5.17 to ‐1.74) | 3.7 | 4 | (1 to 10) | 0.15 | |
| Form‐mom 12/400 (2) | ‐3.75 | (‐4.72 to ‐2.48) | ‐3.09 | (‐4.81 to ‐1.37) | 4.3 | 4 | (1 to 11) | 0.10 | |
| Salm‐flut 50/500 (2) | ‐4.05 | (‐4.97 to ‐3.18) | ‐4.36 | (‐5.60 to ‐3.12) | 2.6 | 2 | (1 to 6) | 0.31 | |
| aFor effects versus placebo, smaller values indicate larger benefits of the active treatment; all doses are given in micrograms. Crl = credible interval. SGRQ = St George's Respiratory Questionnaire. ICS = inhaled corticosteroid. LABA = long‐acting beta2‐agonist. LABA/ICS = long‐acting beta2‐agonist/inhaled corticosteroid. LAMA = long‐acting antimuscarinic antagonist. NWMA = network meta‐analysis. Pr = probability. | |||||||||
| Effect vs placebo | Effect vs placebo | Rank | ||||||
| Class | Median | 95% CrI | Median | 95% CrI | Mean | Median | 95% CrI | Pr (best) |
| LABA/ICS | 133.30 | (100.60 to 164.00) | 132.80 | (98.93 to 165.60) | 1.1 | 1 | (1 to 2) | 0.9 |
| LAMA | 103.50 | (81.78,124.90) | 103.60 | (79.01 to 126.60) | 2.4 | 2 | (1 to 3) | 0.1 |
| LABA | 99.44 | (71.98,127.80) | 99.86 | (70.41 to 130.50) | 2.6 | 3 | (1 to 4) | 0.0 |
| ICS | 65.36 | (33.06,96.91) | 65.52 | (31.23 to 97.16) | 3.9 | 4 | (3 to 4) | 0.0 |
| aFor effects versus placebo, smaller values indicate larger benefits of the active treatment; all doses are given in micrograms. Crl = credible interval. FEV1 = forced expiratory volume in one second. ICS = inhaled corticosteroid. LABA = long‐acting beta2‐agonist. LABA/ICS = long‐acting beta2‐agonist/inhaled corticosteroid. LAMA = long‐acting antimuscarinic antagonist. NWMA = network meta‐analysis. Pr = probability. | ||||||||
| Effect vs placebo | Effect vs placebo | Rank (from class NWMA) | |||||||
| Class | Treatment (number daily doses) | Median | 95% CrI | Median | 95% CrI | Mean | Median | 95% CrI | Pr (best) |
| LABA | Form 12 (2) | 94.88 | (60.70 to 122.80) | 53.92 | (13.00 to 94.07) | 12.0 | 13 | (5 to 18) | 0.00 |
| Ind 300 (1) | 103.30 | (71.95 to 150.10) | 137.90 | (63.69 to 209.90) | 9.5 | 10 | (2 to 16) | 0.02 | |
| Ind 150 (1) | 99.53 | (72.32 to 127.20) | 100.70 | (65.74 to 133.80) | 10.8 | 12 | (4 to 16) | 0.00 | |
| Salm 50 (2) | 101.00 | (73.39 to 130.70) | 114.70 | (75.96 to 149.30) | 10.3 | 11 | (4 to 16) | 0.00 | |
| LAMA | Tio 5 (1) | 105.40 | (81.87 to 131.80) | 110.50 | (73.82 to 145.40) | 8.9 | 9 | (3 to 15) | 0.01 |
| Tio 10 (1) | 106.40 | (79.80 to 142.00) | 121.00 | (62.88 to 175.20) | 8.6 | 8 | (2 to 15) | 0.02 | |
| Tio 18 (1) | 105.20 | (85.54 to 125.50) | 107.00 | (82.93 to 129.50) | 9.0 | 9 | (4 to 15) | 0.00 | |
| Acl 200 (1) | 98.83 | (59.06 to 123.20) | 59.31 | (9.47 to 107.90) | 11.3 | 11 | (5 to 18) | 0.00 | |
| Acl 200 (2) | 100.60 | (65.20 to 127.10) | 74.82 | (11.81 to 134.20) | 10.7 | 11 | (4 to 17) | 0.00 | |
| Acl 400 (2) | 107.30 | (80.93 to 143.50) | 108.80 | (45.06 to 168.30) | 8.2 | 8 | (2 to 15) | 0.02 | |
| Gly 50 (1) | 103.60 | (79.83 to 127.50) | 101.50 | (67.86 to 133.40) | 9.5 | 10 | (3 to 15) | 0.00 | |
| ICS | Bud 400 (2) | 61.89 | (23.86 to 94.06) | 14.59 | (‐29.22 to 58.25) | 17.6 | 18 | (14 to 19) | 0.00 |
| Bud 750+ (2) | 63.10 | (14.75 to 99.65) | ‐2.26 | (‐95.77 to 91.34) | 17.3 | 18 | (12 to 19) | 0.00 | |
| Flut 250 (2) | 66.78 | (34.19 to 101.10) | 76.18 | (29.36 to 122.30) | 16.9 | 17 | (11 to 19) | 0.00 | |
| Flut 500 (2) | 72.16 | (40.20 to 109.80) | 97.04 | (54.90 to 138.40) | 15.9 | 16 | (8 to 19) | 0.00 | |
| LABA/ICS | Form‐bud 12/160 (2) | 131.10 | (91.65 to 164.00) | 80.84 | (26.99 to 132.70) | 3.9 | 3 | (1 to 13) | 0.16 |
| Form‐bud 12/320 (2) | 127.30 | (85.14 to 159.50) | 72.77 | (28.75 to 116.70) | 4.7 | 4 | (1 to 14) | 0.11 | |
| Salm‐flut 50/250 (2) | 139.70 | (106.20 to 182.90) | 173.00 | (116.20 to 226.40) | 2.4 | 2 | (1 to 8) | 0.39 | |
| Salm‐flut 50/500 (2) | 137.10 | (104.40 to 172.10) | 152.40 | (104.10 to 197.80) | 2.8 | 2 | (1 to 9) | 0.26 | |
| aFor effects versus placebo, bigger values indicate larger benefits of the active treatment; all doses are given in micrograms. Crl = credible interval. FEV1 = forced expiratory volume in one second. ICS = inhaled corticosteroid. LABA = long‐acting beta2‐agonist. LABA/ICS = long‐acting beta2‐agonist/inhaled corticosteroid. LAMA = long‐acting antimuscarinic antagonist. NWMA = network meta‐analysis. Pr = probability. | |||||||||