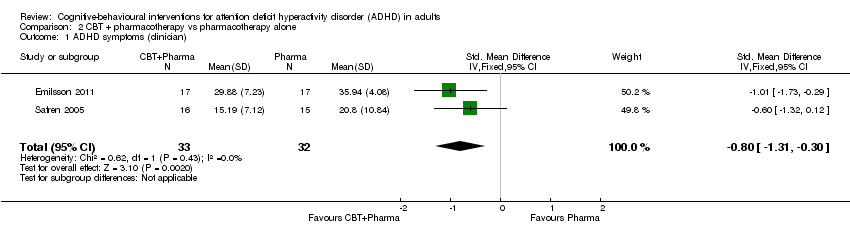
| 1 ADHD symptoms (clinician) Show forest plot | 2 | 97 | Std. Mean Difference (IV, Fixed, 95% CI) | ‐0.58 [‐0.98, ‐0.17] |
|
| 1.1 CBT vs relaxation + educational support | 1 | 78 | Std. Mean Difference (IV, Fixed, 95% CI) | ‐0.52 [‐0.97, ‐0.06] |
| 1.2 CBT vs cognitive training | 1 | 19 | Std. Mean Difference (IV, Fixed, 95% CI) | ‐0.84 [‐1.78, 0.11] |
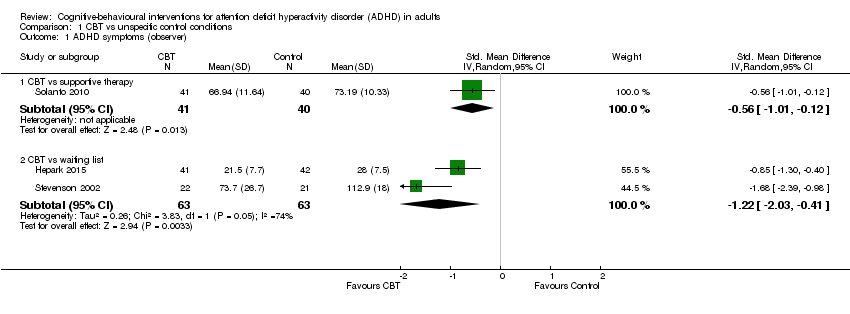
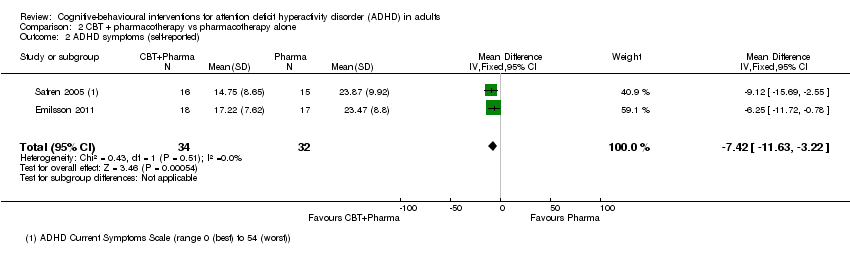
| 2 ADHD symptoms (self‐reported) Show forest plot | 4 | 156 | Std. Mean Difference (IV, Random, 95% CI) | ‐0.44 [‐0.88, ‐0.01] |
|
| 2.1 CBT vs relaxation + educational support | 1 | 72 | Std. Mean Difference (IV, Random, 95% CI) | ‐0.78 [‐1.26, ‐0.29] |
| 2.2 CBT vs cognitive training | 1 | 19 | Std. Mean Difference (IV, Random, 95% CI) | ‐0.20 [‐1.10, 0.71] |
| 2.3 CBT vs psychoeducation | 1 | 32 | Std. Mean Difference (IV, Random, 95% CI) | 0.12 [‐0.57, 0.82] |
| 2.4 CBT vs skills handouts | 1 | 33 | Std. Mean Difference (IV, Random, 95% CI) | ‐0.71 [‐1.42, ‐0.00] |
| 3 Inattention (self‐reported) Show forest plot | 2 | 65 | Std. Mean Difference (IV, Fixed, 95% CI) | ‐0.12 [‐0.61, 0.37] |
|
| 3.1 CBT vs psychoeducation | 1 | 32 | Std. Mean Difference (IV, Fixed, 95% CI) | 0.15 [‐0.54, 0.85] |
| 3.2 CBT vs skills handouts | 1 | 33 | Std. Mean Difference (IV, Fixed, 95% CI) | ‐0.39 [‐1.08, 0.30] |
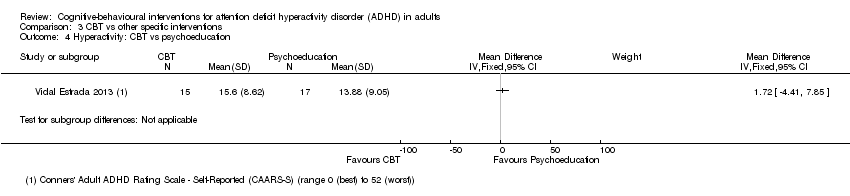
| 4 Hyperactivity: CBT vs psychoeducation Show forest plot | 1 | | Mean Difference (IV, Fixed, 95% CI) | Subtotals only |
|
| 5 Impulsivity: CBT vs psychoeducation Show forest plot | 1 | | Mean Difference (IV, Fixed, 95% CI) | Subtotals only |
|
| 6 Clinical Global Impression (clinician) Show forest plot | 2 | | Mean Difference (IV, Fixed, 95% CI) | Subtotals only |
|
| 6.1 CBT vs relaxation + educational support | 1 | 78 | Mean Difference (IV, Fixed, 95% CI) | ‐0.53 [‐1.09, 0.03] |
| 6.2 CBT vs psychoeducation | 1 | 32 | Mean Difference (IV, Fixed, 95% CI) | 0.18 [‐0.19, 0.55] |
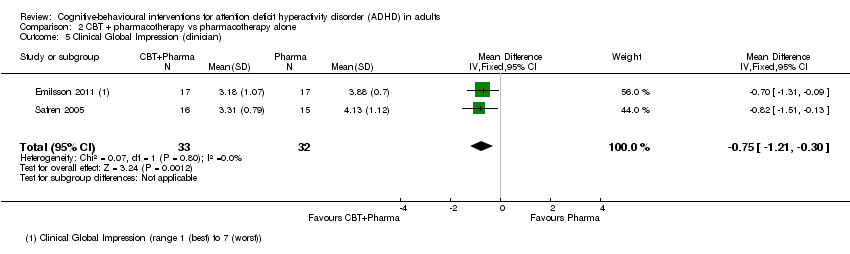
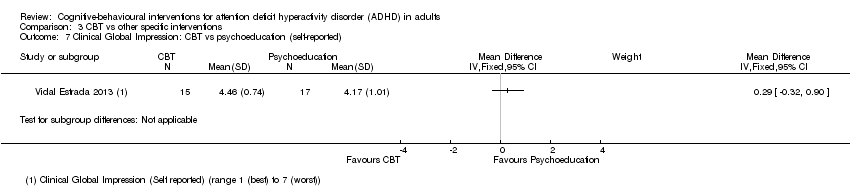
| 7 Clinical Global Impression: CBT vs psychoeducation (self‐reported) Show forest plot | 1 | | Mean Difference (IV, Fixed, 95% CI) | Subtotals only |
|
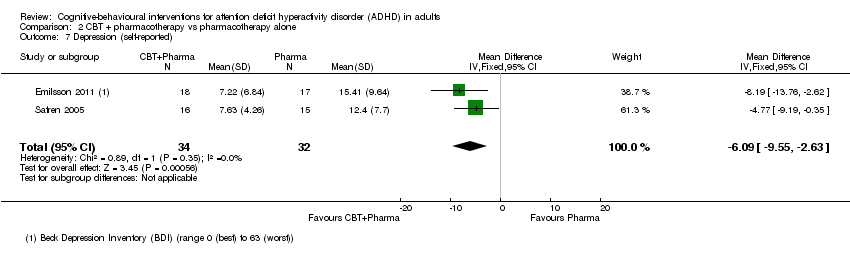
| 8 Depression (self‐reported) Show forest plot | 3 | 84 | Std. Mean Difference (IV, Fixed, 95% CI) | ‐0.27 [‐0.70, 0.16] |
|
| 8.1 CBT vs cognitive training | 1 | 19 | Std. Mean Difference (IV, Fixed, 95% CI) | ‐0.41 [‐1.32, 0.51] |
| 8.2 CBT vs psychoeducation | 1 | 32 | Std. Mean Difference (IV, Fixed, 95% CI) | ‐0.10 [‐0.80, 0.59] |
| 8.3 CBT vs skills handouts | 1 | 33 | Std. Mean Difference (IV, Fixed, 95% CI) | ‐0.35 [‐1.04, 0.34] |
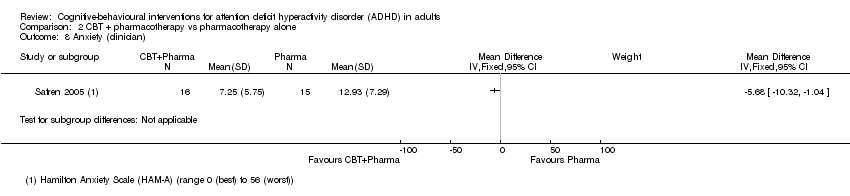
| 9 Anxiety (self‐reported) Show forest plot | 2 | 65 | Std. Mean Difference (IV, Fixed, 95% CI) | ‐0.46 [‐0.95, 0.04] |
|
| 9.1 CBT vs psychoeducation | 1 | 32 | Std. Mean Difference (IV, Fixed, 95% CI) | ‐0.34 [‐1.04, 0.36] |
| 9.2 CBT vs skills handouts | 1 | 33 | Std. Mean Difference (IV, Fixed, 95% CI) | ‐0.57 [‐1.27, 0.13] |
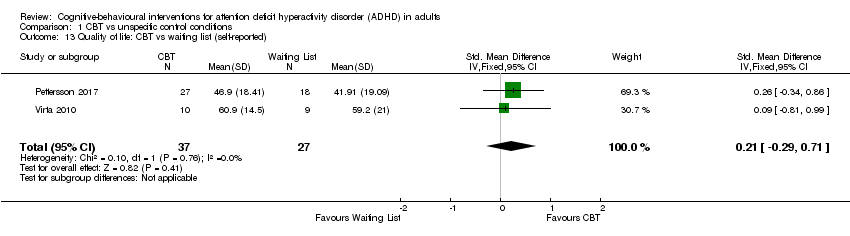
| 10 Quality of life (self‐reported) Show forest plot | 3 | | Std. Mean Difference (IV, Fixed, 95% CI) | Subtotals only |
|
| 10.1 CBT vs cognitive training | 1 | 19 | Std. Mean Difference (IV, Fixed, 95% CI) | ‐0.28 [‐1.19, 0.62] |
| 10.2 CBT vs psychoeducation | 1 | 32 | Std. Mean Difference (IV, Fixed, 95% CI) | 0.33 [‐0.37, 1.03] |
| 10.3 CBT vs skills handouts | 1 | 33 | Std. Mean Difference (IV, Fixed, 95% CI) | 1.17 [0.42, 1.92] |