Effect of testing for cancer on cancer‐ and venous thromboembolism (VTE)‐related mortality and morbidity in people with unprovoked VTE
Información
- DOI:
- https://doi.org/10.1002/14651858.CD010837.pub3Copiar DOI

- Base de datos:
-
- Cochrane Database of Systematic Reviews
- Versión publicada:
-
- 23 agosto 2017see what's new
- Tipo:
-
- Intervention
- Etapa:
-
- Review
- Grupo Editorial Cochrane:
-
Grupo Cochrane de Vascular
- Copyright:
-
- Copyright © 2017 The Cochrane Collaboration. Published by John Wiley & Sons, Ltd.
Cifras del artículo
Altmetric:
Citado por:
Autores
Contributions of authors
LR: drafted the protocol, selected studies for inclusion, assessed the quality of studies, carried out data extraction, performed data analysis and wrote the review.
SEY: selected studies for inclusion, assessed the quality of the studies and carried out data extraction.
GS: provided clinical input into the review.
RA: contributed to the protocol and provided clinical input into the review.
Sources of support
Internal sources
-
No sources of support supplied
External sources
-
Chief Scientist Office, Scottish Government Health Directorates, The Scottish Government, UK.
The Cochrane Vascular editorial base is supported by the Chief Scientist Office.
Declarations of interest
LR: none known.
SEY: none known.
GS: none known.
RA: none known.
Acknowledgements
The review authors would like to thank the Cochrane Vascular editorial base for their guidance for this review.
Version history
| Published | Title | Stage | Authors | Version |
| 2021 Oct 01 | Effect of testing for cancer on cancer‐ or venous thromboembolism (VTE)‐related mortality and morbidity in people with unprovoked VTE | Review | Lindsay Robertson, Cathryn Broderick, Su Ern Yeoh, Gerard Stansby | |
| 2018 Nov 08 | Effect of testing for cancer on cancer‐ or venous thromboembolism (VTE)‐related mortality and morbidity in people with unprovoked VTE | Review | Lindsay Robertson, Su Ern Yeoh, Cathryn Broderick, Gerard Stansby, Roshan Agarwal | |
| 2017 Aug 23 | Effect of testing for cancer on cancer‐ and venous thromboembolism (VTE)‐related mortality and morbidity in people with unprovoked VTE | Review | Lindsay Robertson, Su Ern Yeoh, Gerard Stansby, Roshan Agarwal | |
| 2015 Mar 06 | Effect of testing for cancer on cancer‐ and venous thromboembolism (VTE)‐related mortality and morbidity in patients with unprovoked VTE | Review | Lindsay Robertson, Su Ern Yeoh, Gerard Stansby, Roshan Agarwal | |
| 2013 Nov 19 | Effect of testing for cancer on cancer‐ and venous thromboembolism (VTE)‐related mortality and morbidity in patients with unprovoked VTE | Protocol | Lindsay Robertson, Roshan Agarwal, Su Ern Yeoh | |
Differences between protocol and review
The primary outcome 'Non‐cancer‐related mortality (death due to some cause other than cancer or cancer‐related treatment)' was re‐phrased to 'all‐cause mortality' for clarity.
Keywords
MeSH
Medical Subject Headings (MeSH) Keywords
- Cause of Death;
- Early Detection of Cancer;
- Neoplasms [*complications, *diagnosis, diagnostic imaging, mortality];
- Positron Emission Tomography Computed Tomography;
- Pulmonary Embolism [diagnostic imaging, *etiology, mortality];
- Randomized Controlled Trials as Topic;
- Risk Factors;
- Venous Thromboembolism [diagnostic imaging, *etiology, mortality];
- Venous Thrombosis [diagnostic imaging, *etiology, mortality];
Medical Subject Headings Check Words
Humans;
PICO
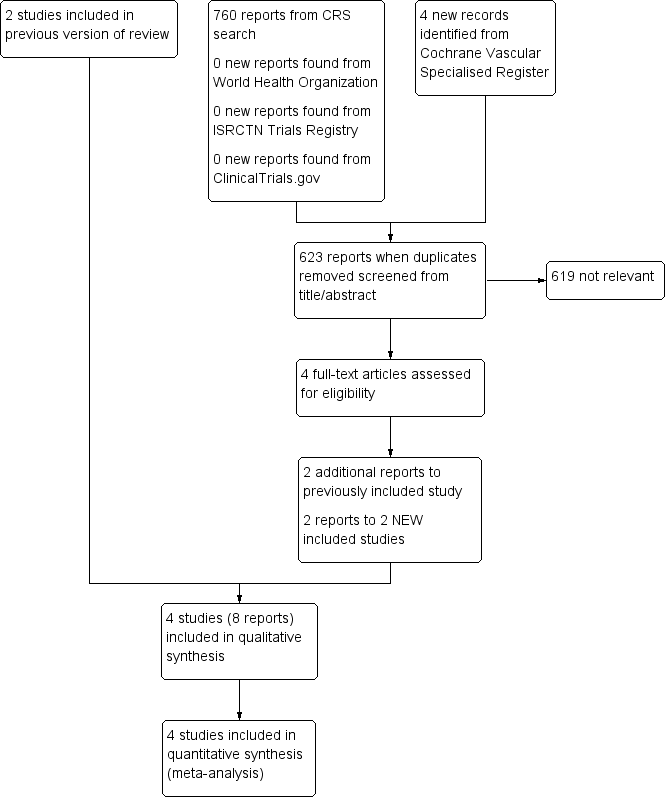
Study flow diagram.
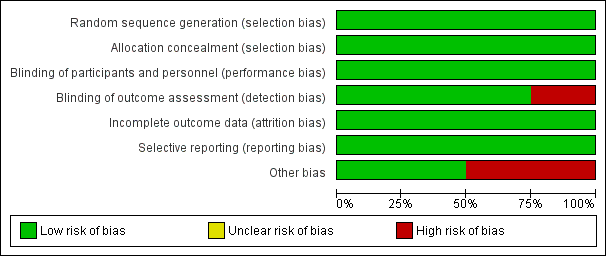
Risk of bias graph: review authors' judgements about each risk of bias item presented as percentages across all included studies.

Risk of bias summary: review authors' judgements about each risk of bias item for each included study.

Comparison 1 Extensive tests versus tests at the physician's discretion, Outcome 1 Cancer‐related mortality.
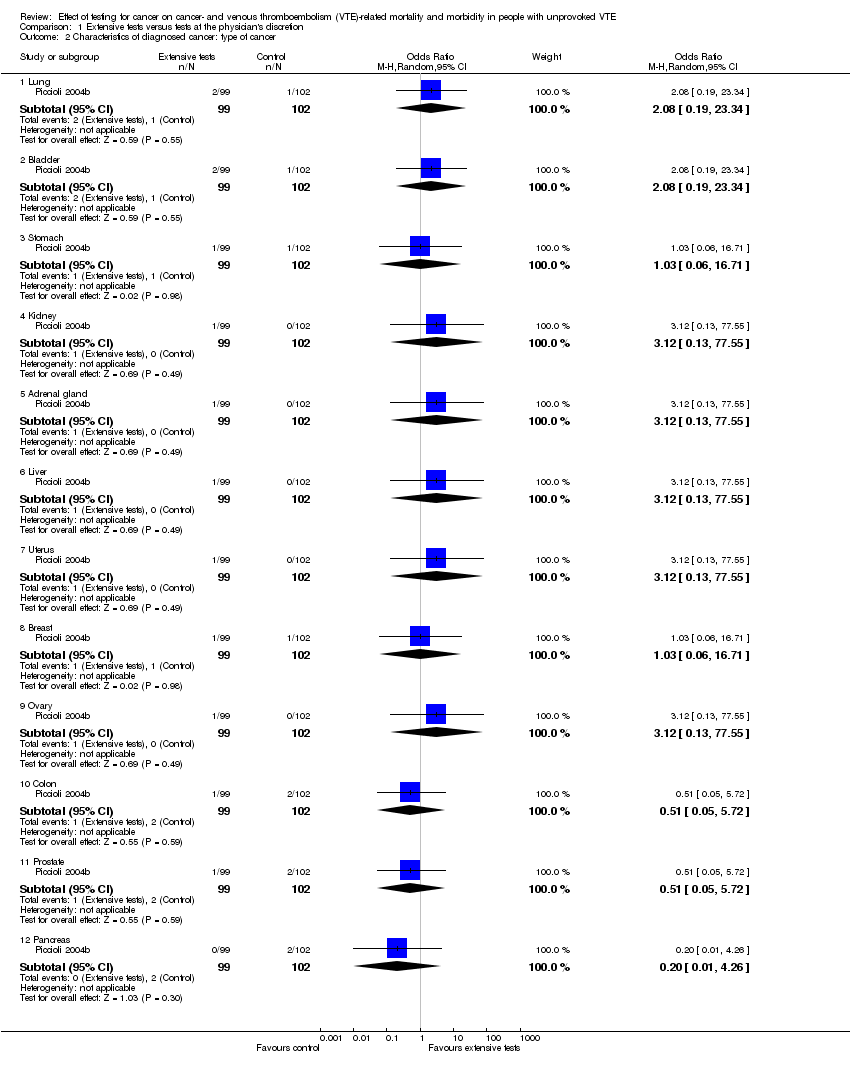
Comparison 1 Extensive tests versus tests at the physician's discretion, Outcome 2 Characteristics of diagnosed cancer: type of cancer.

Comparison 1 Extensive tests versus tests at the physician's discretion, Outcome 3 Characteristics of diagnosed cancer: stage of cancer.
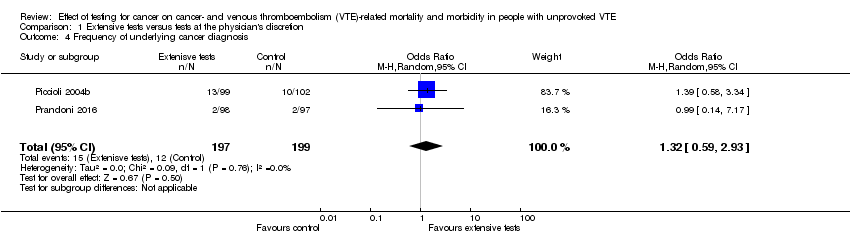
Comparison 1 Extensive tests versus tests at the physician's discretion, Outcome 4 Frequency of underlying cancer diagnosis.

Comparison 2 Standard testing plus PET/CT scanning versus standard testing alone, Outcome 1 All‐cause mortality.

Comparison 2 Standard testing plus PET/CT scanning versus standard testing alone, Outcome 2 Cancer‐related mortality.
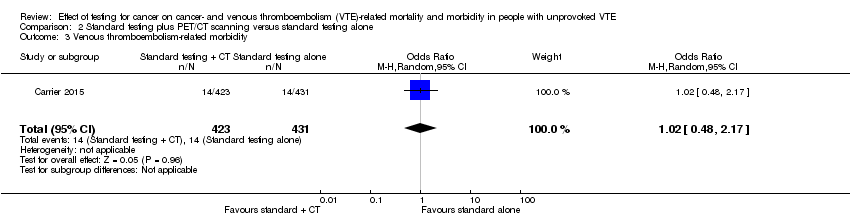
Comparison 2 Standard testing plus PET/CT scanning versus standard testing alone, Outcome 3 Venous thromboembolism‐related morbidity.
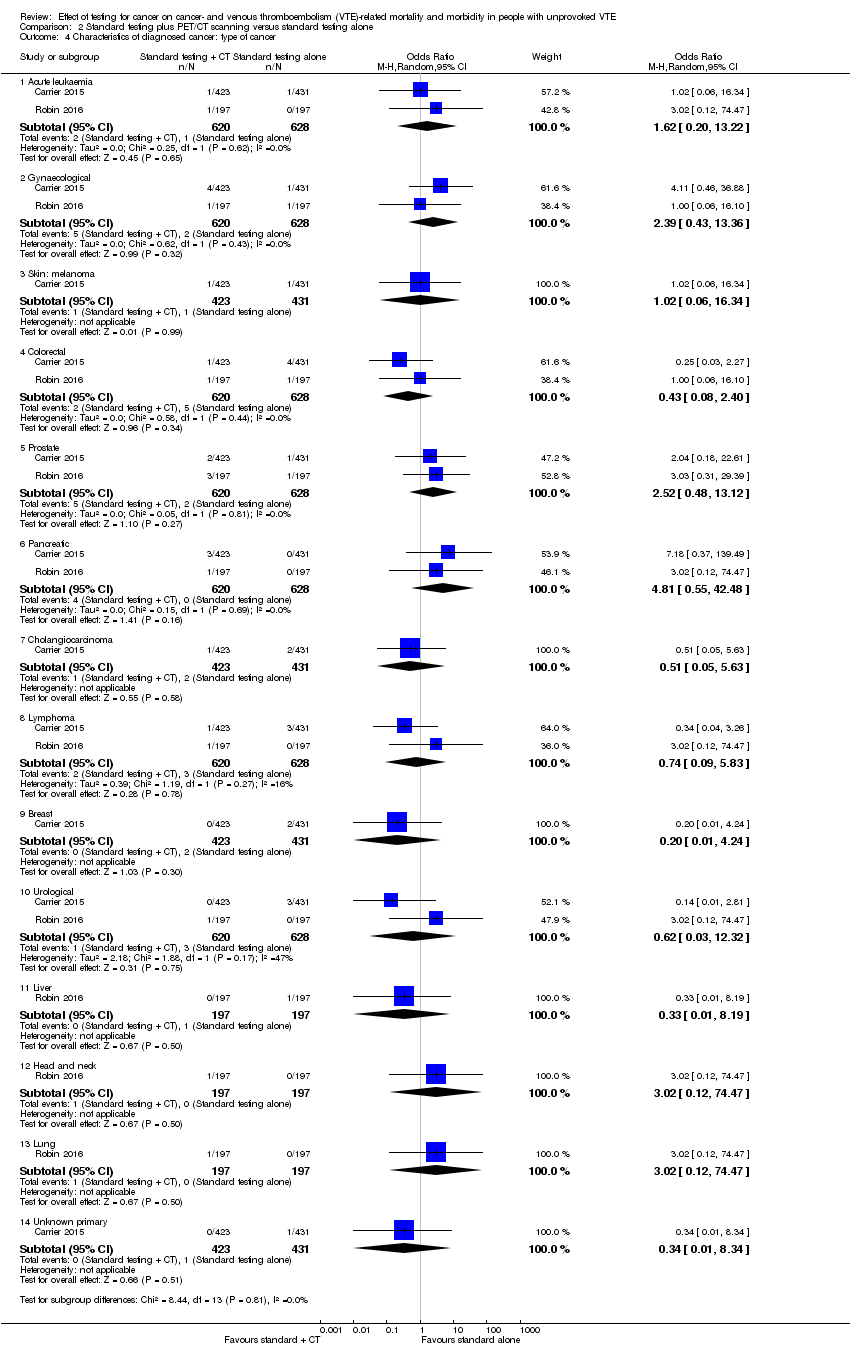
Comparison 2 Standard testing plus PET/CT scanning versus standard testing alone, Outcome 4 Characteristics of diagnosed cancer: type of cancer.

Comparison 2 Standard testing plus PET/CT scanning versus standard testing alone, Outcome 5 Characteristics of diagnosed cancer: stage of cancer.
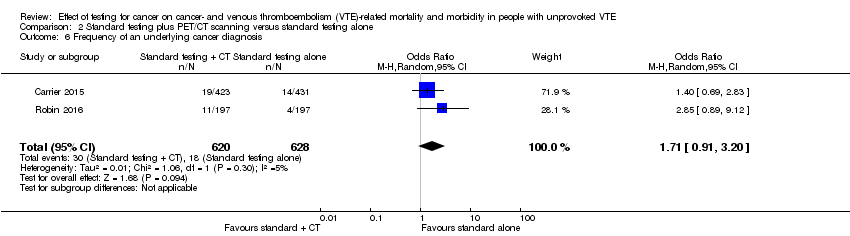
Comparison 2 Standard testing plus PET/CT scanning versus standard testing alone, Outcome 6 Frequency of an underlying cancer diagnosis.
| Extensive tests versus tests at the physician's discretion | ||||||
| Patient or population: people with unprovoked VTE Setting: hospital Intervention: extensive tests Comparison: tests at the physician's discretion | ||||||
| Outcomes | Anticipated absolute effects* (95% CI) | Relative effect | No of participants | Quality of the evidence | Comments | |
| Risk with tests at physician's discretion | Risk with extensive tests | |||||
| All‐cause mortality1 | See comment | See comment | See comment | See comment | See comment | No study measured this outcome. |
| Cancer‐related mortality2 | Study population | OR 0.49 | 396 | ⊕⊕⊝⊝ | ‐ | |
| 40 per 1000 | 20 per 1000 | |||||
| VTE‐related mortality4 | See comment | See comment | See comment | See comment | See comment | No study measured this outcome. |
| VTE‐related morbidity5 | See comment | See comment | See comment | See comment | See comment | No study measured this outcome. |
| Stage of cancer ‐ early6 | Study population | OR 5.00 | 201 (1 RCT) | ⊕⊕⊝⊝ | ‐ | |
| 20 per 1000 | 91 per 1000 | |||||
| Stage of cancer ‐ advanced8 | Study population | OR 0.25 | 201 | ⊕⊕⊝⊝ | ‐ | |
| 39 per 1000 | 10 per 1000 | |||||
| Time to cancer diagnosis9 | See comments | See comments | See comments | 201 (1 RCT) | See comments | Time to cancer diagnosis (measured from time of diagnosis of VTE) measured in 1 study (Piccioli 2004b), and reported as a mean of 1 month with extensive tests compared to 11.6 months with tests at physician's discretion (P < 0.001). Standard deviations for these means not given. Attempts to contact author for these data made but no response received. |
| Frequency of underlying cancer diagnosis10 | 60 per 1000 | 78 per 1000 | OR 1.32 | 396 | ⊕⊕⊝⊝ | ‐ |
| *The risk in the intervention group (and its 95% confidence interval) is based on the assumed risk in the comparison group and the relative effect of the intervention (and its 95% CI). CI: confidence interval; OR: odds ratio; RCT: randomised controlled trial; VTE: venous thromboembolism. | ||||||
| GRADE Working Group grades of evidence | ||||||
| 1 Death due to any cause. | ||||||
| Standard testing plus PET/CT scanning versus standard testing alone | ||||||
| Patient or population: people with unprovoked VTE Setting: hospital Intervention: standard testing + PET/CT scanning Comparison: standard testing alone | ||||||
| Outcomes | Anticipated absolute effects* (95% CI) | Relative effect | No of participants | Quality of the evidence | Comments | |
| Risk with standard testing alone | Risk with standard testing + PET/CT scanning | |||||
| All‐cause mortality1 | Study population | OR 1.22 | 1248 | ⊕⊕⊕⊝ | ‐ | |
| 14 per 1000 | 17 per 1000 | |||||
| Cancer‐related mortality3 | Study population | OR 0.55 | 1248 | ⊕⊕⊕⊝ | ‐ | |
| 18 per 1000 | 10 per 1000 | |||||
| VTE‐related mortality4 | See comment | See comment | See comment | See comment | See comment | No study measured this outcome. |
| VTE‐related morbidity5 | Study population | OR 1.02 | 854 | ⊕⊕⊕⊝ | ‐ | |
| 32 per 1000 | 33 per 1000 | |||||
| Stage of cancer ‐ early | Study population | OR 1.78 | 394 | ⊕⊕⊝⊝ | ‐ | |
| 20 per 1000 | 36 per 1000 | |||||
| Stage of cancer ‐ advanced | Study population | OR 1.00 | 394 | ⊕⊕⊝⊝ | ‐ | |
| 10 per 1000 | 10 per 1000 | |||||
| Time to cancer diagnosis7 | See comments | See comments | See comments | 854 (1 RCT) | See comments | Time to cancer diagnosis measured in Carrier 2015 as 4.2 months in standard testing group and 4.0 months in standard testing + PET/CT group (P = 0.88). However, standard deviations for these means not given. Attempts made to contact author for these data but no response received. |
| Frequency of an underlying cancer diagnosis8 | Study population | OR 1.71 | 1248 | ⊕⊕⊕⊝ | ‐ | |
| 29 per 1000 | 48 per 1000 | |||||
| *The risk in the intervention group (and its 95% confidence interval) is based on the assumed risk in the comparison group and the relative effect of the intervention (and its 95% CI). CI: confidence interval; OR: odds ratio; PET/CT: positron emission tomography/computed tomography; RCT: randomised controlled trial; VTE: venous thromboembolism. | ||||||
| GRADE Working Group grades of evidence | ||||||
| 1 Death due to any cause. | ||||||
| Outcome or subgroup title | No. of studies | No. of participants | Statistical method | Effect size |
| 1 Cancer‐related mortality Show forest plot | 2 | 396 | Odds Ratio (M‐H, Random, 95% CI) | 0.49 [0.15, 1.67] |
| 2 Characteristics of diagnosed cancer: type of cancer Show forest plot | 1 | Odds Ratio (M‐H, Random, 95% CI) | Subtotals only | |
| 2.1 Lung | 1 | 201 | Odds Ratio (M‐H, Random, 95% CI) | 2.08 [0.19, 23.34] |
| 2.2 Bladder | 1 | 201 | Odds Ratio (M‐H, Random, 95% CI) | 2.08 [0.19, 23.34] |
| 2.3 Stomach | 1 | 201 | Odds Ratio (M‐H, Random, 95% CI) | 1.03 [0.06, 16.71] |
| 2.4 Kidney | 1 | 201 | Odds Ratio (M‐H, Random, 95% CI) | 3.12 [0.13, 77.55] |
| 2.5 Adrenal gland | 1 | 201 | Odds Ratio (M‐H, Random, 95% CI) | 3.12 [0.13, 77.55] |
| 2.6 Liver | 1 | 201 | Odds Ratio (M‐H, Random, 95% CI) | 3.12 [0.13, 77.55] |
| 2.7 Uterus | 1 | 201 | Odds Ratio (M‐H, Random, 95% CI) | 3.12 [0.13, 77.55] |
| 2.8 Breast | 1 | 201 | Odds Ratio (M‐H, Random, 95% CI) | 1.03 [0.06, 16.71] |
| 2.9 Ovary | 1 | 201 | Odds Ratio (M‐H, Random, 95% CI) | 3.12 [0.13, 77.55] |
| 2.10 Colon | 1 | 201 | Odds Ratio (M‐H, Random, 95% CI) | 0.51 [0.05, 5.72] |
| 2.11 Prostate | 1 | 201 | Odds Ratio (M‐H, Random, 95% CI) | 0.51 [0.05, 5.72] |
| 2.12 Pancreas | 1 | 201 | Odds Ratio (M‐H, Random, 95% CI) | 0.20 [0.01, 4.26] |
| 3 Characteristics of diagnosed cancer: stage of cancer Show forest plot | 1 | Odds Ratio (M‐H, Random, 95% CI) | Subtotals only | |
| 3.1 T1 or T2 (N0 M0) | 1 | 201 | Odds Ratio (M‐H, Random, 95% CI) | 5.00 [1.05, 23.76] |
| 3.2 T3 | 1 | 201 | Odds Ratio (M‐H, Random, 95% CI) | 0.25 [0.03, 2.28] |
| 4 Frequency of underlying cancer diagnosis Show forest plot | 2 | 396 | Odds Ratio (M‐H, Random, 95% CI) | 1.32 [0.59, 2.93] |
| Outcome or subgroup title | No. of studies | No. of participants | Statistical method | Effect size |
| 1 All‐cause mortality Show forest plot | 2 | 1248 | Odds Ratio (M‐H, Random, 95% CI) | 1.22 [0.49, 3.04] |
| 2 Cancer‐related mortality Show forest plot | 2 | 1248 | Odds Ratio (M‐H, Random, 95% CI) | 0.55 [0.20, 1.52] |
| 3 Venous thromboembolism‐related morbidity Show forest plot | 1 | 854 | Odds Ratio (M‐H, Random, 95% CI) | 1.02 [0.48, 2.17] |
| 4 Characteristics of diagnosed cancer: type of cancer Show forest plot | 2 | Odds Ratio (M‐H, Random, 95% CI) | Subtotals only | |
| 4.1 Acute leukaemia | 2 | 1248 | Odds Ratio (M‐H, Random, 95% CI) | 1.62 [0.20, 13.22] |
| 4.2 Gynaecological | 2 | 1248 | Odds Ratio (M‐H, Random, 95% CI) | 2.39 [0.43, 13.36] |
| 4.3 Skin: melanoma | 1 | 854 | Odds Ratio (M‐H, Random, 95% CI) | 1.02 [0.06, 16.34] |
| 4.4 Colorectal | 2 | 1248 | Odds Ratio (M‐H, Random, 95% CI) | 0.43 [0.08, 2.40] |
| 4.5 Prostate | 2 | 1248 | Odds Ratio (M‐H, Random, 95% CI) | 2.52 [0.48, 13.12] |
| 4.6 Pancreatic | 2 | 1248 | Odds Ratio (M‐H, Random, 95% CI) | 4.81 [0.55, 42.48] |
| 4.7 Cholangiocarcinoma | 1 | 854 | Odds Ratio (M‐H, Random, 95% CI) | 0.51 [0.05, 5.63] |
| 4.8 Lymphoma | 2 | 1248 | Odds Ratio (M‐H, Random, 95% CI) | 0.74 [0.09, 5.83] |
| 4.9 Breast | 1 | 854 | Odds Ratio (M‐H, Random, 95% CI) | 0.20 [0.01, 4.24] |
| 4.10 Urological | 2 | 1248 | Odds Ratio (M‐H, Random, 95% CI) | 0.62 [0.03, 12.32] |
| 4.11 Liver | 1 | 394 | Odds Ratio (M‐H, Random, 95% CI) | 0.33 [0.01, 8.19] |
| 4.12 Head and neck | 1 | 394 | Odds Ratio (M‐H, Random, 95% CI) | 3.02 [0.12, 74.47] |
| 4.13 Lung | 1 | 394 | Odds Ratio (M‐H, Random, 95% CI) | 3.02 [0.12, 74.47] |
| 4.14 Unknown primary | 1 | 854 | Odds Ratio (M‐H, Random, 95% CI) | 0.34 [0.01, 8.34] |
| 5 Characteristics of diagnosed cancer: stage of cancer Show forest plot | 1 | Odds Ratio (M‐H, Random, 95% CI) | Subtotals only | |
| 5.1 Early | 1 | 394 | Odds Ratio (M‐H, Random, 95% CI) | 1.78 [0.51, 6.17] |
| 5.2 Advanced | 1 | 394 | Odds Ratio (M‐H, Random, 95% CI) | 1.0 [0.14, 7.17] |
| 6 Frequency of an underlying cancer diagnosis Show forest plot | 2 | 1248 | Odds Ratio (M‐H, Random, 95% CI) | 1.71 [0.91, 3.20] |