Effect of testing for cancer on cancer‐ and venous thromboembolism (VTE)‐related mortality and morbidity in people with unprovoked VTE
Abstract
Background
Venous thromboembolism (VTE) is a collective term for two conditions: deep vein thrombosis (DVT) and pulmonary embolism (PE). A proportion of people with VTE have no underlying or immediately predisposing risk factors and the VTE is referred to as unprovoked. Unprovoked VTE can often be the first clinical manifestation of an underlying malignancy. This has raised the question of whether people with an unprovoked VTE should be investigated for an underlying cancer. Treatment for VTE is different in cancer and non‐cancer patients and a correct diagnosis would ensure that people received the optimal treatment for VTE to prevent recurrence and further morbidity. Furthermore, an appropriate cancer diagnosis at an earlier, potentially curative stage could avoid the risk of cancer progression and thus lead to improvements in cancer‐related mortality and morbidity. This is an update of a review first published in 2015.
Objectives
To determine whether testing for undiagnosed cancer in people with a first episode of unprovoked VTE (DVT of the lower limb or PE) is effective in reducing cancer and VTE‐related mortality and morbidity and to determine which tests for cancer are best at identifying treatable cancers early.
Search methods
For this update, the Cochrane Vascular Information Specialist (CIS) searched the Specialised Register (16 February 2017). In addition, the CIS searched the Cochrane Register of Studies CENTRAL (2017, Issue 1). We searched trials registries (February 2017) and checked the reference lists of relevant articles.
Selection criteria
Randomised and quasi‐randomised trials in which people with an unprovoked VTE were allocated to receive specific tests for cancer or clinically indicated tests only were eligible for inclusion in this review. Primary outcomes included all‐cause mortality, cancer‐related mortality and VTE‐related mortality.
Data collection and analysis
Two review authors independently selected studies, assessed quality and extracted data. We resolved any disagreements by discussion.
Main results
Four studies with 1644 participants met the inclusion criteria (two studies in the original review and two in this update). Two studies assessed the effect of extensive tests versus tests at the physician's discretion) while the other two studies assessed the effect of standard testing plus positron emission tomography (PET)/computed tomography (CT) scanning versus standard testing alone. For extensive tests versus tests at the physician's discretion, the quality of the evidence was low due to risk of bias (early termination of the studies). When comparing standard testing plus PET/CT scanning versus standard testing alone, the quality of evidence was moderate due to a risk of detection bias. The quality of the evidence was downgraded further when detection bias was present in one study with a low number of events.
When comparing extensive tests versus tests at the physician's discretion, pooled analysis on two studies showed that testing for cancer was consistent with either a benefit or no benefit on cancer‐related mortality (odds ratio (OR) 0.49, 95% confidence interval (CI) 0.15 to 1.67; 396 participants; 2 studies; P = 0.26; low quality evidence). One study (201 participants) showed that, overall, malignancies were less advanced in extensively tested participants than in participants in the control group. In total, 9/13 participants diagnosed with cancer in the extensively tested group had a T1 or T2 stage malignancy compared to 2/10 participants diagnosed with cancer in the control group (OR 5.00, 95% CI 1.05 to 23.76; P = 0.04; low quality evidence). There was no clear difference in detection of advanced stages between extensive tests versus tests at the physician's discretion: one participant in the extensively tested group had stage T3 compared with four participants in the control group (OR 0.25, 95% CI 0.03 to 2.28; P = 0.22; low quality evidence). In addition, extensively tested participants were diagnosed earlier than control group (mean: 1 month with extensive tests versus 11.6 months with tests at physician's discretion to cancer diagnosis from the time of diagnosis of VTE). Extensive testing did not increase the frequency of an underlying cancer diagnosis (OR 1.32, 95% CI 0.59 to 2.93; 396 participants; 2 studies; P = 0.50; low quality evidence). Neither study measured all‐cause mortality, VTE‐related morbidity and mortality, complications of anticoagulation, adverse effects of cancer tests, participant satisfaction or quality of life.
When comparing standard testing plus PET/CT screening versus standard testing alone, standard testing plus PET/CT screening was consistent with either a benefit or no benefit on all‐cause mortality (OR 1.22, 95% CI 0.49 to 3.04; 1248 participants; 2 studies; P = 0.66; moderate quality evidence), cancer‐related mortality (OR 0.55, 95% CI 0.20 to 1.52; 1248 participants; 2 studies; P = 0.25; moderate quality evidence) or VTE‐related morbidity (OR 1.02, 95% CI 0.48 to 2.17; 854 participants; 1 study; P = 0.96; moderate quality evidence). With regards to stage of cancer, there was no clear difference for detection of early (OR 1.78, 95% 0.51 to 6.17; 394 participants; 1 study; P = 0.37; low quality evidence) or advanced (OR 1.00, 95% CI 0.14 to 7.17; 394 participants; 1 study; P = 1.00; low quality evidence) stages of cancer. There was also no clear difference in the frequency of an underlying cancer diagnosis (OR 1.71, 95% CI 0.91 to 3.20; 1248 participants; 2 studies; P = 0.09; moderate quality evidence). Time to cancer diagnosis was 4.2 months in the standard testing group and 4.0 months in the standard testing plus PET/CT group (P = 0.88). Neither study measured VTE‐related mortality, complications of anticoagulation, adverse effects of cancer tests, participant satisfaction or quality of life.
Authors' conclusions
Testing for cancer in people with unprovoked VTE may lead to earlier diagnosis of cancer at an earlier stage of the disease. However, there is currently insufficient evidence to draw definitive conclusions concerning the effectiveness of testing for undiagnosed cancer in people with a first episode of unprovoked VTE (DVT or PE) in reducing cancer and VTE‐related morbidity and mortality. The results could be consistent with either benefit or no benefit. Further good‐quality large‐scale randomised controlled trials are required before firm conclusions can be made.
PICO
Plain language summary
Effect of testing for cancer (on cancer and blood clot‐related death and illness) in people with unprovoked blood clots in the legs and lungs
Background
Venous thromboembolism (VTE) refers to blood clots in leg veins (known as deep venous thrombosis (DVT)), which can travel to the lungs (causing pulmonary embolism (PE)). PE can often be fatal. Signs of DVT include pain and swelling of the leg while signs of PE include breathlessness and chest pain. Risk factors for VTE include surgery, prolonged bed rest, trauma, family history, pregnancy and blood deficiencies. However, sometimes a VTE happens for no apparent reason (it is unprovoked). In such people, an undetected cancer may be the cause of the VTE. This has raised the question of whether people with an unprovoked VTE should be investigated for underlying cancer. This is potentially important as the management of VTE in people with and without cancer differs. A cancer diagnosis would ensure that people received the optimal treatment to reduce the risk of another VTE. A diagnosis could also lead to the cancer being treated earlier, at a more curable stage.
Study characteristics and key results
This review assessed whether testing for undiagnosed cancer in people with a first unprovoked VTE (DVT or PE) was effective in reducing cancer and VTE‐related illness and death. We found four studies with 1644 participants (current to February 2017). Two studies compared extensive cancer tests with tests carried out at the physician's discretion and two studies compared cancer tests plus scanning with cancer tests alone. Combining the results of the two studies showed that extensive testing had no effect on the number of cancer‐related deaths. Additionally, extensive testing did not identify more people with cancer. However, extensive testing did identify cancers at an earlier stage (approximately 10 months earlier) and cancers were less advanced in people in the extensive testing group than in people in the group with tests carried out at the physician's discretion. Neither study looked at the number of deaths due to any cause, deaths and illness associated with VTE, side effects of cancer tests, side effects of VTE treatment or participant satisfaction. Two studies that compared tests plus scanning with tests alone showed that adding computed tomography scanning had little or no effect on the number of deaths, cancer‐related deaths, illness associated with VTE or did it identify more people with cancer, or showed a clear difference in time to diagnosis or stages of cancer diagnosed. Neither study looked at illness associated with VTE, side effects of cancer tests, side effects of VTE treatment, participant satisfaction or quality of life.
Quality of the evidence
When comparing extensive tests versus tests at the physician's discretion, the quality of the evidence was low due to bias caused by two of the studies stopping early. When comparing tests plus CT scanning with tests alone, the quality of the evidence ranged from low to moderate due to imprecision caused by a low number of events and bias due to lack of blinding of people assessing the effects.
This review found that there are too few trials to determine whether testing for undiagnosed cancer in people with a first unprovoked VTE (DVT or PE) is effective in reducing cancer and VTE‐related deaths and illness. Further good‐quality and large‐scale studies are required.
Authors' conclusions
Summary of findings
| Extensive tests versus tests at the physician's discretion | ||||||
| Patient or population: people with unprovoked VTE Setting: hospital Intervention: extensive tests Comparison: tests at the physician's discretion | ||||||
| Outcomes | Anticipated absolute effects* (95% CI) | Relative effect | No of participants | Quality of the evidence | Comments | |
| Risk with tests at physician's discretion | Risk with extensive tests | |||||
| All‐cause mortality1 | See comment | See comment | See comment | See comment | See comment | No study measured this outcome. |
| Cancer‐related mortality2 | Study population | OR 0.49 | 396 | ⊕⊕⊝⊝ | ‐ | |
| 40 per 1000 | 20 per 1000 | |||||
| VTE‐related mortality4 | See comment | See comment | See comment | See comment | See comment | No study measured this outcome. |
| VTE‐related morbidity5 | See comment | See comment | See comment | See comment | See comment | No study measured this outcome. |
| Stage of cancer ‐ early6 | Study population | OR 5.00 | 201 (1 RCT) | ⊕⊕⊝⊝ | ‐ | |
| 20 per 1000 | 91 per 1000 | |||||
| Stage of cancer ‐ advanced8 | Study population | OR 0.25 | 201 | ⊕⊕⊝⊝ | ‐ | |
| 39 per 1000 | 10 per 1000 | |||||
| Time to cancer diagnosis9 | See comments | See comments | See comments | 201 (1 RCT) | See comments | Time to cancer diagnosis (measured from time of diagnosis of VTE) measured in 1 study (Piccioli 2004b), and reported as a mean of 1 month with extensive tests compared to 11.6 months with tests at physician's discretion (P < 0.001). Standard deviations for these means not given. Attempts to contact author for these data made but no response received. |
| Frequency of underlying cancer diagnosis10 | 60 per 1000 | 78 per 1000 | OR 1.32 | 396 | ⊕⊕⊝⊝ | ‐ |
| *The risk in the intervention group (and its 95% confidence interval) is based on the assumed risk in the comparison group and the relative effect of the intervention (and its 95% CI). CI: confidence interval; OR: odds ratio; RCT: randomised controlled trial; VTE: venous thromboembolism. | ||||||
| GRADE Working Group grades of evidence | ||||||
| 1 Death due to any cause. | ||||||
| Standard testing plus PET/CT scanning versus standard testing alone | ||||||
| Patient or population: people with unprovoked VTE Setting: hospital Intervention: standard testing + PET/CT scanning Comparison: standard testing alone | ||||||
| Outcomes | Anticipated absolute effects* (95% CI) | Relative effect | No of participants | Quality of the evidence | Comments | |
| Risk with standard testing alone | Risk with standard testing + PET/CT scanning | |||||
| All‐cause mortality1 | Study population | OR 1.22 | 1248 | ⊕⊕⊕⊝ | ‐ | |
| 14 per 1000 | 17 per 1000 | |||||
| Cancer‐related mortality3 | Study population | OR 0.55 | 1248 | ⊕⊕⊕⊝ | ‐ | |
| 18 per 1000 | 10 per 1000 | |||||
| VTE‐related mortality4 | See comment | See comment | See comment | See comment | See comment | No study measured this outcome. |
| VTE‐related morbidity5 | Study population | OR 1.02 | 854 | ⊕⊕⊕⊝ | ‐ | |
| 32 per 1000 | 33 per 1000 | |||||
| Stage of cancer ‐ early | Study population | OR 1.78 | 394 | ⊕⊕⊝⊝ | ‐ | |
| 20 per 1000 | 36 per 1000 | |||||
| Stage of cancer ‐ advanced | Study population | OR 1.00 | 394 | ⊕⊕⊝⊝ | ‐ | |
| 10 per 1000 | 10 per 1000 | |||||
| Time to cancer diagnosis7 | See comments | See comments | See comments | 854 (1 RCT) | See comments | Time to cancer diagnosis measured in Carrier 2015 as 4.2 months in standard testing group and 4.0 months in standard testing + PET/CT group (P = 0.88). However, standard deviations for these means not given. Attempts made to contact author for these data but no response received. |
| Frequency of an underlying cancer diagnosis8 | Study population | OR 1.71 | 1248 | ⊕⊕⊕⊝ | ‐ | |
| 29 per 1000 | 48 per 1000 | |||||
| *The risk in the intervention group (and its 95% confidence interval) is based on the assumed risk in the comparison group and the relative effect of the intervention (and its 95% CI). CI: confidence interval; OR: odds ratio; PET/CT: positron emission tomography/computed tomography; RCT: randomised controlled trial; VTE: venous thromboembolism. | ||||||
| GRADE Working Group grades of evidence | ||||||
| 1 Death due to any cause. | ||||||
Background
Description of the condition
Venous thromboembolism (VTE) is the collective term for the clinical conditions deep vein thrombosis (DVT) and pulmonary embolism (PE). DVT is the formation of a blood clot (thrombus) in a deep vein, predominantly in the legs. Symptoms include pain, tenderness, erythema and swelling of the affected leg. PE occurs when part or all the thrombus breaks off (embolises) and travels up to the lungs blocking the pulmonary arteries. Symptoms of PE include breathlessness and chest pain (Blann 2006).
Guidelines published by the UK National Institute for Health and Care Excellence (NICE) recommend that people with a suspected VTE should be risk stratified using various diagnostic investigations. Anticoagulant therapy with low molecular weight heparin (LMWH) should be administered in the interim. People with confirmed VTE should receive LMWH or fondaparinux for at least the initial five days and be started on a vitamin K antagonist. The LMWH should be stopped when the international normalised ratio has been above 2 for at least 24 hours. Vitamin K antagonists should be continued for at least three months. In people with an unprovoked VTE, consideration should be given to extending anticoagulation beyond three months. However, people with cancer‐associated VTE should be treated with LMWH from the initial diagnosis for a period of six months, and considered for continuation of anticoagulation with either LMWH or a vitamin K antagonist based on the status of the underlying cancer and risks of anticoagulation (NICE 2012). Direct oral anticoagulants (DOACs) such as rivaroxaban have been used for the initial treatment and prevention of recurrent VTE. Two systematic reviews have shown that DOACs may be as safe and effective as conventional anticoagulation for the prevention of recurrent VTE in people with cancer but, direct comparisons to the current standard of care with LMWH are limited (Carrier 2014; Vedovati 2015).
The difference in management of people with a cancer‐associated VTE is due to their significantly higher risk of VTE recurrence, which is estimated to be three times higher than in people with VTE in the absence of cancer (Levitan 1999). Furthermore, people with cancer and an associated VTE have a poorer overall prognosis compared to people without a VTE (Sorensen 2000).
A proportion of people with VTE have no underlying or immediately apparent cause and the VTE is referred to as unprovoked. Unprovoked VTE can suggest underlying malignancies such as cancer of the blood, kidney, ovary, pancreas, stomach and lung (Bick 1978; Kakkar 2003; Lee 2003a; Prandoni 1997; White 2005). Results from one Swedish prospective cohort study of almost 62,000 participants determined that the standardised incidence ratio of a cancer diagnosis within the first two years of an unprovoked VTE was 4.4 (Baron 1998), and there was an overall absolute incidence of cancer of 11% (NICE 2012). One study of 339 participants with a first episode of an unprovoked VTE determined that the risk ratio (RR) of cancer‐related mortality at two years was 0.52 (95% confidence interval (CI) 0.10 to 2.75) in people undergoing intensive investigations compared to routine tests, while the RR for early‐stage cancer detection was 3.21 (95% CI 0.88 to 11.79) (Piccioli 2004a).
Therefore, people who present with an apparent unprovoked VTE have a significant underlying risk of malignancy or cancer‐associated VTE, with significant implications for the management of the VTE itself (three months' vitamin K antagonist versus six months' LMWH), the prognosis related to risk of VTE recurrence and the precipitating cancer. Detection of cancer at an earlier stage enables more effective treatment. This has raised the question of whether people with an unprovoked VTE should be investigated for an underlying cancer. Some authors have referred to this as 'screening for cancer' although this is somewhat misleading as screening refers to the investigation of asymptomatic people. Instead, people with VTE are better regarded as presenting with symptoms suggestive of an underlying cancer and the aim of investigations is to refine the diagnosis of VTE based on the underlying cause, so that the person may receive a more accurate diagnosis and appropriate treatment for their VTE. In this context, VTE represents a symptom rather than a diagnosis per se. So, to what extent should people with an unprovoked VTE be investigated for a potential underlying cancer?
Description of the intervention
The NICE guidelines on VTE disease recommend that all people presenting with a first episode of unprovoked VTE (DVT or PE) should undergo a history and physical examination directed to detecting an underlying malignancy, and further tests guided by the history and examination including blood tests (complete blood count, serum calcium and liver function tests), urinalysis and chest X‐ray (NICE 2012). If none of these initial investigations suggest signs and symptoms of cancer then further tests including abdomino‐pelvic computed tomography (CT) scan (and a mammogram for women) are recommended in people aged over 40 years (NICE 2012). It is the value of these additional tests which is the subject of this review.
How the intervention might work
The interventions for detecting an underlying cancer will enable a diagnosis of cancer‐associated VTE to be made. This will enable the person to receive appropriate anticoagulation with LMWH versus vitamin K antagonist, for six versus three months respectively, and for the underlying cancer to be treated promptly without the need for additional symptoms to emerge before it is diagnosed. One study has shown that the combination of tests recommended by NICE detects cancer in approximately 10% of people with a first episode of unprovoked VTE and with no prior cancer diagnosis (Piccioli 2004a). However, tests for cancer also have the potential for harm, from the pain and inconvenience of blood tests to more serious complications due to radiation exposure from X‐rays and CT scans.
Why it is important to do this review
The pharmacological management of VTE in people with and without cancer is considerably different, both in terms of choice of agent and duration of anticoagulation. Therefore, an appropriate cancer diagnosis would ensure that people received the optimal form and duration of anticoagulation, which, in turn, could reduce the overall population VTE recurrence rate and associated morbidity. Establishing whether a person with an apparently unprovoked VTE has an underlying cancer is important since this may lead to cancer diagnosis at an earlier, potentially curative stage, avoiding the risk of cancer progression while waiting for additional symptoms. This may, in turn, lead to improvements in cancer‐related mortality and morbidity. To date, no systematic review has been conducted to measure the effectiveness of testing for cancer in people with an unprovoked VTE. This review provides evidence as to whether such tests for underlying cancer, followed by appropriate alteration in the management or treatment of VTE, or both, are effective in reducing morbidity (VTE recurrence) and mortality (VTE‐ and cancer‐associated).
Objectives
To determine whether testing for undiagnosed cancer in people with a first episode of unprovoked VTE (DVT of the lower limb or PE) is effective in reducing cancer and VTE‐related mortality and morbidity and to determine which tests for cancer are best at identifying treatable cancers early.
The detailed objectives are as follows:
to determine whether testing for undiagnosed cancer in people with a first episode of unprovoked VTE (DVT of the lower limb or PE) is effective in reducing cancer mortality and morbidity (cancer morbidity being the need for cancer treatment and effects producing reduced quality of life);
to determine whether testing for undiagnosed cancer in people with a first episode of unprovoked VTE (DVT or PE) is effective in reducing VTE‐related mortality and morbidity;
to determine which tests for cancer are best at identifying treatable cancers early.
Methods
Criteria for considering studies for this review
Types of studies
Randomised and quasi‐randomised trials (where a method of allocation was used that was not truly random) in which people with an unprovoked VTE were allocated to receive different tests for cancer or tests as per physician discretion. We looked primarily at randomisation within three months of a VTE, as used in the SOMIT trial (Piccioli 2004a). However, we also included trials where randomisation occurred at different time points as a subgroup analysis. We included published studies and studies in progress if preliminary results were available. Non‐English language studies were also eligible for inclusion in the review.
Types of participants
People with a first episode of unprovoked VTE (DVT of the lower limb or PE) with no pre‐existing or clinically apparent cancer diagnosis.
Types of interventions
Tests for cancer (e.g. complete blood count, serum calcium, liver function test, urinalysis, chest X‐ray, all forms of CT imaging, mammogram, tumour markers, sputum cytology, ultrasonography, positron emission tomography (PET) scan and colonoscopy) versus no tests for cancer or alternative tests, followed by appropriate treatment for cancer or change in VTE treatment regimen, or both. Studies where these tests were routinely used in all groups were not included. However, we included any study that focused on some other aspect of care than cancer only if the test for cancer was the subject of randomisation.
Types of outcome measures
Primary outcomes
-
All‐cause mortality (death due to any cause).
-
Cancer‐related mortality (defined as death due to a malignant disease itself, or death due to complications of treatments or procedures to diagnose or treat the cancer).
-
VTE‐related mortality (fatal PE). PE diagnosed "on the basis of a lung scan indicating a high probability of its presence, as indicated by the presence of new or enlarged areas of segmental perfusion defects with ventilation‐perfusion mismatch; an abnormal perfusion scan with documentation of new or recurrent DVT; the presence of non‐enhancing filling defects in the central pulmonary vasculature on helical CT; a finding of intraluminal filling defects on pulmonary angiography; or evidence of fresh PE at autopsy" (Lee 2003b). Fatal PE including probable fatal PE and unexplained sudden death were used if reported, as defined by individual studies.
Secondary outcomes
-
VTE‐related morbidity (e.g. frequency of recurrent VTE). Recurrent PE or DVT was diagnosed if a previously compressible proximal venous segment or segments could no longer be compressed on ultrasonography or if there were constant intraluminal filling defects in two or more projections on venography. Unequivocal extension of the thrombus required for the diagnosis of recurrence if the results were abnormal on previous testing (Lee 2003b).
-
Complications of anticoagulation (e.g. warfarin‐ versus LMWH‐associated bleeding). We reported on major bleeding and minor bleeding if reported in the included studies. Major bleeding included bleeding associated with death, bleeding at a critical site (intracranial, intraspinal, intraocular, retroperitoneal or pericardial area), bleeding resulting in a need for a transfusion of at least two units of blood or bleeding leading to a drop in haemoglobin of at least 2.0 g/dL (Lee 2003b). Minor bleeding included any other bleeding.
-
Adverse effects of cancer tests (e.g. radiation exposure, bleeding, as defined in included studies).
-
Characteristics of diagnosed cancer (e.g. primary tumour, stage, localised (curable) versus advanced (palliative) as defined in included studies).
-
Time to cancer diagnosis, as defined in included studies.
-
Frequency of an underlying cancer diagnosis (i.e. the number of times cancer was diagnosed through screening following an unprovoked VTE as defined in included studies) at the time of VTE presentation and overall over the follow‐up period.
-
Participant satisfaction (if assessed in individual studies, we reported results descriptively using the definition provided by the trialists).
-
Quality of life.
Search methods for identification of studies
There was no restriction on date or language of publication.
Electronic searches
For this update the Cochrane Vascular Information Specialist (CIS) searched the Specialised Register (16 February 2017). In addition, the CIS searched the Cochrane Register of Studies (CRS; www.metaxis.com/CRSWeb/Index.asp; CENTRAL 2017, Issue 1). See Appendix 1 for details of the search strategy used to search the CRS. The Specialised Register is maintained by the CIS and is constructed from weekly electronic searches of MEDLINE, Embase, CINAHL and AMED, and through handsearching relevant journals. The full list of the databases, journals and conference proceedings which have been searched, as well as the search strategies used are described in the Specialised Register section of the Cochrane Vascular module in the Cochrane Library (www.cochranelibrary.com).
In addition, the CIS searched the following trial databases (16 February 2017) for details of ongoing and unpublished studies. See Appendix 2.
-
World Health Organization International Clinical Trials Registry Platform (apps.who.int/trialsearch/);
-
ClinicalTrials.gov (clinicaltrials.gov/);
-
ISRCTN registry (www.isrctn.com/).
Searching other resources
We searched the reference lists of relevant articles retrieved by the electronic searches for additional citations. Furthermore, we searched the conference proceeding abstracts of the following societies:
-
International Society for Thrombosis and Haemostasis (ISTH) (2003 to 2016);
-
American Society for Hematology (ASH) (2004 to 2016).
Data collection and analysis
Selection of studies
Two review authors (LR, SEY) independently used the selection criteria to identify trials for inclusion. We resolved any disagreements by discussion.
Data extraction and management
Two review authors (LR, SEY) independently extracted the data and recorded information about the trial design, VTE definition and investigations to confirm diagnosis, baseline characteristics of participants and tests for cancer. All‐cause mortality, cancer‐related mortality and VTE‐related mortality data were recorded as the primary outcome measures. Information on VTE‐related morbidity (e.g. frequency of recurrent VTE), complications of anticoagulation (e.g. warfarin‐ versus LMWH‐associated bleeding), adverse effects of cancer tests (e.g. radiation exposure, bleeding), characteristics of diagnosed cancer (e.g. primary tumour, stage, localised (curable) versus advanced (palliative)), time to cancer diagnosis, frequency of an underlying cancer diagnosis and participant satisfaction was collected in accordance with the secondary outcome measures. Where more than one publication of one study existed, reports were grouped together and the most recent or most complete data set were used. We contacted authors of included studies for further information if clarification was required. We resolved any disagreements in data extraction and management by discussion.
Assessment of risk of bias in included studies
Two review authors (LR, SEY) independently used the Cochrane tool to assess the risk of bias for each of the included studies (Higgins 2011). The tool provides a protocol for judgements on sequence generation, allocation methods, blinding, incomplete outcome data, selective outcome reporting and any other relevant biases. We judged each of these domains at high, low or unclear risk of bias according to Higgins 2011 and provided support for each judgement. The conclusions are presented in a 'Risk of bias' table. Any disagreements were resolved by discussion.
Measures of treatment effect
We planned to base the analysis on intention‐to‐treat data from the individual clinical trials. The majority of outcomes were binary measures (mortality, morbidity, complications, adverse effects, characteristics of diagnosed cancer, frequency of an underlying cancer diagnosis). For these outcomes, we computed odds ratios (ORs) using a random‐effects model and calculated the 95% CI of the effect sizes. For time to cancer diagnosis, we aimed to compute hazard ratios (HR), while for participant satisfaction, we planned to report results descriptively (Deeks 2011).
Unit of analysis issues
The unit of analysis within each trial was the individual participant.
Dealing with missing data
We sought information about dropouts, withdrawals and other missing data and, if not reported, we contacted the study authors.
Assessment of heterogeneity
We assessed heterogeneity between the pooled studies by visual examination of the forest plot to check for overlapping CIs, and used the Chi2 test for homogeneity with a 10% level of significance. We used the I2 statistic to measure the degree of inconsistency between the studies. An I2 result of over 50% may represent moderate to substantial heterogeneity (Deeks 2011).
Assessment of reporting biases
We planned to assess reporting biases such as publication bias using funnel plots when there were more than 10 studies in the meta‐analyses (Sterne 2011). However, as there were only four studies in the review it was not possible to test for funnel plot asymmetry.
Data synthesis
The review authors independently extracted the data. One review author (LR) entered the data into Review Manager 5 (RevMan 2014). A second review author (SEY) cross‐checked data entry and resolved any discrepancies by consulting the source publication.
We used a random‐effects model for meta‐analysis of the data. We planned to stratify analyses according to the individual cancer test being assessed and the combination of tests as used in the SOMIT trial (Piccioli 2004a).
Subgroup analysis and investigation of heterogeneity
Where possible, we planned to analyse clinically relevant subgroups based on the following:
-
DVT or PE at time of randomisation;
-
cancer site;
-
treatment post‐investigation with vitamin K antagonist or LMWH;
-
duration of anticoagulation (e.g. three or six months);
-
age and gender of participants (comparing those in age and gender groups for national screening programmes to those not in these age and gender groups);
-
time of randomisation after VTE diagnosis (within three months compared with after three months).
However, due to lack of data in the studies, it was not possible to perform subgroup analysis.
Sensitivity analysis
We planned to conduct a sensitivity analysis by excluding studies at high risk of bias to measure the effect on the results.
'Summary of findings' table
We presented the main findings of the review results concerning the quality of evidence, the magnitude of effect of the interventions examined and the sum of available data for all outcomes of this review (Types of outcome measures) in a 'Summary of findings' table, according to the GRADE principles as described by Higgins 2011 and Atkins 2004. We calculated assumed control intervention risks from the mean number of events in the control groups of the selected studies for each outcome. We used the GRADEprofiler (GRADEpro) software to assist in the preparation of the 'Summary of findings' table (www.guidelinedevelopment.org).
Results
Description of studies
Results of the search
See Figure 1.
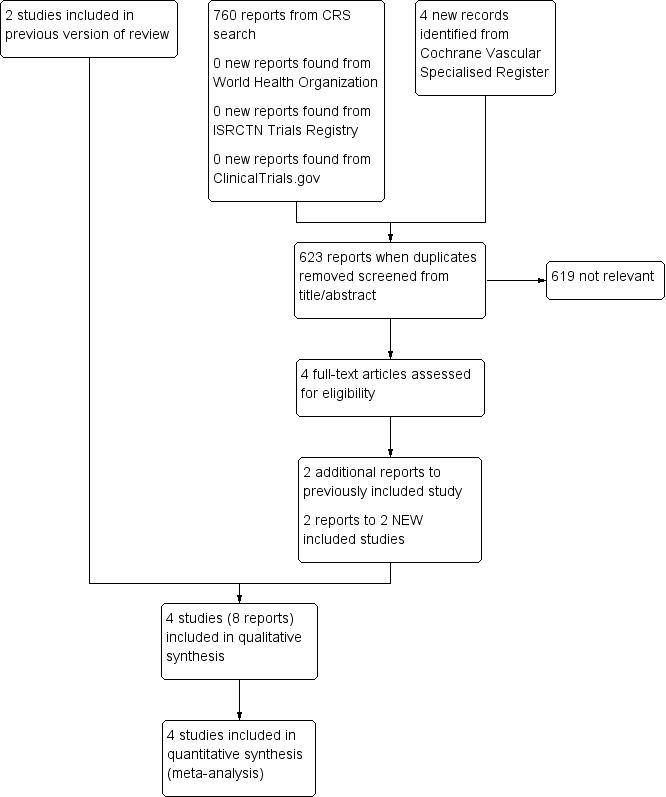
Study flow diagram.
Included studies
This updated search identified two further studies (Carrier 2015; Robin 2016) making a total of four included studies (Carrier 2015; Piccioli 2004b; Prandoni 2016; Robin 2016).
See Characteristics of included studies table.
The first study was a randomised multicentre study of 201 apparently cancer‐free people with acute unprovoked VTE (Piccioli 2004b). Extensive investigations for occult malignant disease were compared with testing at the physician's discretion. Ninety‐nine participants were randomised to the extensive screening group and 102 were randomised to the control group. Participants in the extensive investigations group were offered ultrasound and CT scans of the abdomen and pelvis, double contrast barium swallowing, colonoscopy or sigmoidoscopy followed by a barium enema, haemoccult test, sputum cytology and tumour markers including carcinoembryonic antigen (CEA), alpha‐fetoprotein (α‐FP) and CA125. Women also underwent mammography and Papanicolaou (Pap) smears while men had transabdominal ultrasound of the prostate and a total prostate‐specific antigen (PSA) test. All tests were completed within a four‐week period from the diagnosis of VTE. Participants in the control group were investigated at the physician's discretion. If the investigations suggested the presence of a malignant process, further investigations were performed according to current standards. Participants were followed up at 3, 12 and 24 months following the diagnosis of VTE. The primary outcome was cancer‐related morbidity, defined as death due to a malignant disease itself, or death due to complications of diagnostic or surgical procedures performed to diagnose or treat cancer. A secondary outcome of this study consisted of the cluster of cancer‐related mortality and documented residual malignancy or recurrent malignancy at 24 months. The authors also measured the frequency of an underlying cancer diagnosis including type and stage as well as mean time to cancer diagnosis.
The second study was a randomised study in which 195 participants with a first episode of unprovoked VTE were randomised to extensive investigations (98 participants) or a discretionary diagnostic approach excluding CT scans (97 participants) (Prandoni 2016). Extensive investigations comprised a mandatory CT scan of the thorax, abdomen and pelvis together with faecal haemoccult testing or any test at physician's discretion according to good clinical practice. Participants allocated to the discretionary diagnostic approach or personalised strategy underwent additional testing based on physicians' judgements and participants' preferences, including a 'no‐further testing' option. Participants were followed at 3, 6, 12 and 24 months to document the incidence of newly discovered cancer and cancer‐related mortality. The primary outcomes were cancer‐related mortality (defined as death due to malignancy, or death due to the complications of the diagnostic or surgical procedures performed to diagnose or treat cancer) and incidence of newly discovered cancer. The secondary outcomes were cancer stage, using the tumours‐nodes‐metastases classification, at which tumours were diagnosed in the two study groups and the incidence of cancer‐related mortality in the two randomisation groups,
The third study was an open‐label randomised study in which 854 participants with a first episode of unprovoked VTE were randomised to limited occult‐cancer screening plus CT scanning of the abdomen and pelvis (423 participants) or limited occult‐cancer screening alone (431 participants) (Carrier 2015). The limited occult‐cancer screening comprised complete history and physical examination, measurement of complete blood counts and serum electrolyte and creatinine levels, liver‐function testing and chest radiography. Sex‐specific screening was conducted if it had not been performed in the previous year. A breast examination, mammography, or both were performed in women over 50 years of age and Pap testing and a pelvic examination were performed in women 18 to 70 years of age who had ever been sexually active. A prostate examination, PSA test, or both were performed in men over 40 years of age. The additional CT investigations comprised a virtual colonoscopy and gastroscopy, biphasic enhanced CT of the liver, parenchymal pancreatography and uniphasic enhanced CT of the distended bladder. Participants were followed up for one year to document the incidence of newly diagnosed cancer, type of cancer diagnosed, one‐year cancer‐related mortality, one‐year overall mortality, time to cancer diagnosis and incidence of recurrent VTE.
The fourth study was an open‐label randomised study in which 394 participants with a first episode of unprovoked VTE were randomised to a limited screening strategy (197 participants) or a screening strategy consisting of the limited strategy plus an 18‐fluorodeoxyglucose (18F‐FDG) PET/CT scan of the chest, abdomen and pelvis (197 participants) (Robin 2016). The limited screening comprised medical history taking, physical examination, routine laboratory tests (including complete blood count, erythrocyte sedimentation rate or C‐reactive protein, aminotransferases, alkaline phosphatase and calcium), chest radiograph, recommended age‐specific and sex‐specific cancer screening tests (i.e. PSA in men older than 50 years, mammography in women older than 50 years and Pap smear in all women). Participants were followed up for two years to determine the proportion of people with a cancer diagnosis in each group after the initial screening assessment.
Excluded studies
There were no studies excluded from the review. Studies that were not randomised controlled trials were deemed not relevant and therefore not listed as an excluded study.
Ongoing studies
There were no ongoing studies.
Risk of bias in included studies

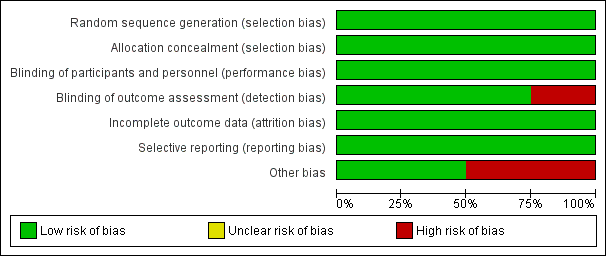
Risk of bias graph: review authors' judgements about each risk of bias item presented as percentages across all included studies.

Risk of bias summary: review authors' judgements about each risk of bias item for each included study.
Allocation
All four studies were randomised. Prandoni 2016 used envelopes. Piccioli 2004b used a Zelen approach (participants are randomised to either the treatment or control group before giving informed consent), Carrier 2015 used random number tables and Robin 2016 used a computer random number generator. Therefore, these four studies were judged at low risk of selection bias. In terms of concealing the allocation of treatment, Piccioli 2004b performed randomisation centrally and Carrier 2015 and Robin 2016 used a central web‐based randomisation system and, therefore, these three were judged at low risk of selection bias. The Prandoni 2016 study used serially numbered, opaque, sealed envelopes to conceal allocation and was, therefore, judged at low risk of selection bias too.
Blinding
As the study groups in all four trials were randomised to extensive screening or no further testing, it was impossible to blind participants and study personnel. However, we believe it was unlikely that the lack of blinding would have affected the outcome and, therefore, all studies were judged at low risk of performance bias.
In Piccioli 2004b, the physician at the follow‐up examination was unaware of the allocation of participants and, therefore, detection bias for outcome assessors was low. Similarly for Carrier 2015, a blinded adjudication committee reviewed all suspected outcome events and, therefore, the risk of detection bias was low. Robin 2016 did not blind outcome assessors to treatment allocation and was, therefore, judged at high risk of detection bias. In Prandoni 2016, investigators performing the follow‐up visits were blinded to the participants' randomisation group and the study was, therefore, judged at low risk of detection bias.
Incomplete outcome data
The treatment groups in all four studies were well‐balanced with respect to baseline characteristics, completion of the study protocol and discontinuation of treatment. Furthermore, all missing data were accounted for and reported. Therefore, all four studies were judged at low risk of attrition bias (Carrier 2015; Piccioli 2004b; Prandoni 2016; Robin 2016).
Selective reporting
All four studies clearly prespecified all primary and secondary outcomes and data on all outcomes were reported (low risk of reporting bias) (Carrier 2015; Piccioli 2004b; Prandoni 2016; Robin 2016).
Other potential sources of bias
Two studies were deemed at low risk (Carrier 2015; Robin 2016), and two studies were deemed to be at high risk of other bias (Piccioli 2004b; Prandoni 2016). The study by Piccioli 2004b was terminated early after the inclusion of only 201 participants after five years for several reasons. First, only five of the more than 40 potential participating centres could contribute participants to the study. Second, some medical ethics committees rejected the protocol because of the absence of screening for occult cancer in the control group, other centres could not start because the proposed extensive screening was judged to be unethical. Finally, the identification of cancer at an apparent early stage in the extensive screening group led to an increasing tendency among physicians in the participating hospitals to initiate screening for cancer in the control participants. The study by Prandoni 2016 was judged at high risk of bias as results of an interim analysis, scheduled after the inclusion of approximately half of the planned sample size, showed no appreciable advantage of the CT‐based strategy over the control strategy for detection of occult cancers. In addition, there was a low recruitment rate, so the study promoters decided to terminate the study early.
Effects of interventions
See: Summary of findings for the main comparison Extensive tests versus tests at the physician's discretion; Summary of findings 2 Standard testing plus PET/CT scanning versus standard testing alone
1. Extensive tests versus tests at the physician's discretion
Two studies assessed the effect of testing for cancer versus clinically indicated tests only (Piccioli 2004b; Prandoni 2016).
Both studies measured the primary outcome cancer‐related mortality. In Piccioli 2004b, 2/99 participants in the extensive testing group died of cancer compared to 4/102 in the group who underwent tests at the physician's discretion (OR 0.51, 95% CI 0.09 to 2.82). In Prandoni 2016, 2/98 participants who underwent extensive testing and 4/97 participants who underwent tests at the physician's discretion died of cancer (OR 0.48, 95% CI 0.09 to 2.71). Meta‐analysis showed an OR of 0.49 (95% CI 0.15 to 1.67; low quality evidence) in favour of extensive testing, which did not reach statistical significance (P = 0.26) (Analysis 1.1).
However, neither Piccioli 2004b nor Prandoni 2016 measured the review's other primary outcomes of all‐cause mortality and VTE‐related mortality, or the secondary outcomes VTE‐related morbidity, complications of anticoagulation, adverse effects of cancer tests, participant satisfaction and quality of life.
Piccioli 2004b looked at the location of the malignancy and found no clear difference in the incidence of any particular cancer between participants who underwent extensive tests and participants who were tested at the physician's discretion (lung: OR 2.08, 95% CI 0.19 to 23.34; bladder: OR 2.08, 95% CI 0.19 to 23.34; stomach: OR 1.03, 95% CI 0.06 to 16.71; kidney: OR 3.12, 95% CI 0.13 to 77.55; adrenal gland: OR 3.12, 95% CI 0.13 to 77.55; liver: OR 3.12, 95% CI 0.13 to 77.55; uterus: OR 3.12, 95% CI 0.13 to 77.55; breast: OR 1.03, 95% CI 0.06 to 16.71; ovary: OR 3.12, 95% CI 0.13 to 77.55; colon: OR 0.51, 95% CI 0.05 to 5.72; prostate: OR 0.51, 95% CI 0.05 to 5.72; pancreas: OR 0.20, 95% CI 0.01 to 4.26) (Analysis 1.2).
Piccioli 2004b compared the characteristics of the diagnosed cancer by assessing the proportion of early‐stage malignancies, defined as T1 or T2 without locoregional or distant metastases (N0 M0). Overall, malignancies were less advanced in participants who had undergone extensive testing. In total, 9/13 participants diagnosed with cancer in the tested group had a T1‐ or T2‐stage malignancy without locoregional or distant metastases compared to 2/10 participants diagnosed with cancer in the control group (OR 5.00, 95% CI 1.05 to 23.76; P = 0.04; low quality evidence). There was no difference in detection of advanced stages between groups: one participant in the tested group had stage T3 compared with four participants in the control group (OR 0.25, 95% CI 0.03 to 2.28; P = 0.22; low quality evidence) (Analysis 1.3).
One study measured time to cancer diagnosis (measured from the time of diagnosis of VTE) (Piccioli 2004b), reported as a mean of one month in tested participants compared to 11.6 months in participants who were tested at the physician's discretion (P < 0.001). Standard deviations for the means were not given. We attempted to contact the author for these data but received no response.
Both studies measured the frequency of an underlying cancer diagnosis. Piccioli 2004b detected underlying cancer in 13/99 participants who underwent extensive testing, whereas it became symptomatic in 10/102 control participants (OR 1.39, 95% CI 0.58 to 3.34). Prandoni 2016 detected cancer in 2/98 participants who had further tests and it became apparent in 2/97 participants who were tested at the physician's discretion (OR 0.99, 95% CI 0.14 to 7.17). The combined incidence of an underlying cancer diagnosis was 15/197 in the tested group and 12/199 in the control group (OR 1.32, 95% CI 0.59 to 2.93; low quality evidence) (Analysis 1.4). Therefore, after 24 months of follow‐up, the incidence of cancer was no different in the tested and control groups.
2. Standard testing plus PET/CT scanning versus standard testing alone
Two studies assessed the effect of standard testing plus PET/CT scanning versus standard testing alone (Carrier 2015; Robin 2016).
Both studies measured the primary outcome all‐cause mortality. In the standard testing plus CT scanning group, 11/620 participants died during follow‐up compared to 9/628 participants who received standard testing alone (OR 1.22, 95% CI 0.49 to 3.04; moderate quality evidence) (Analysis 2.1).
Carrier 2015 and Robin 2016 also measured cancer‐related mortality and reported an incidence of 6/620 participants with standard testing plus CT scanning compared to 11/628 participants who received standard testing alone (OR 0.55, 95% CI 0.20 to 1.52; moderate quality evidence) (Analysis 2.2).
The study by Carrier 2015 measured VTE‐related morbidity. The incidence of recurrent VTE was 14/423 participants who underwent standard testing plus CT scanning compared to 14/431 participants who had standard testing alone (OR 1.02, 95% CI 0.48 to 2.17; moderate quality evidence) (Analysis 2.3).
Carrier 2015 and Robin 2016 also looked at the location of the malignancy and found no clear difference in the incidence of any particular cancer between the two groups (acute leukaemia: OR 1.62, 95% CI 0.20 to 13.22; gynaecological: OR 2.39, 95% CI 0.43 to 13.36; melanoma: OR 1.02, 95% CI 0.06 to 16.34; colorectal: OR 0.43, 95% CI 0.08 to 2.40; prostate: OR 2.52, 95% CI 0.48 to 13.12; pancreatic: OR 4.81, 95% CI 0.55 to 42.48; cholangiocarcinoma: OR 0.51, 95% CI 0.05 to 5.63; lymphoma: OR 0.74, 95% CI 0.09 to 5.83; breast: OR 0.20, 95% CI 0.01 to 4.24; urological: OR 0.62, 95% CI 0.03 to 12.32; liver: OR 0.33, 95% CI 0.01 to 8.19; head and neck: OR 3.02, 95% CI 0.12 to 74.47; lung: OR 3.02, 95% CI 0.12 to 74.47; unknown primary origin: OR 0.34, 95% CI 0.01 to 8.34) (Analysis 2.4).
Robin 2016 also measured the stage of cancer. Early‐stage cancer was detected in 7/197 participants who underwent standard testing plus CT scanning compared to 4/197 participants who underwent standard testing alone (OR 1.78, 95% CI 0.51 to 6.17; low quality evidence), while advanced‐stage cancer was detected in two participants in each group (OR 1.00, 95% CI 0.14 to 7.17; low quality evidence) (Analysis 2.5).
Time to cancer diagnosis was 4.0 months in the standard testing plus CT/PET group and 4.2 months in the standard testing group in one study (P = 0.88) (Carrier 2015). However, standard deviations for these means were not given. We attempted to contact the author for these data but received no response. Robin 2016 did not measure time to cancer diagnosis.
Carrier 2015 and Robin 2016 measured the frequency of underlying cancer diagnosis. Underlying cancer was detected in 30/620 participants who underwent standard testing plus CT scanning compared to 18/628 participants who underwent standard testing alone (OR 1.71, 95% CI 0.91 to 3.20; moderate quality evidence) (Analysis 2.6).
The studies by Carrier 2015 and Robin 2016 did not measure the other review outcomes of VTE‐related mortality, complications of anticoagulation, adverse effects of cancer tests, participant satisfaction or quality of life.
Discussion
Summary of main results
Four studies fulfilled the eligibility criteria for inclusion in this review (Carrier 2015; Piccioli 2004b; Prandoni 2016; Robin 2016). In total, 1644 participants were studied. We found no studies that were potentially eligible but then excluded.
Extensive tests versus tests at the physician's discretion
Two studies compared the effectiveness of testing for cancer on cancer‐related mortality in people with a first unprovoked VTE (Piccioli 2004b; Prandoni 2016). Piccioli 2004b performed an extensive list of tests while Prandoni 2016 carried out fewer tests. Pooled analysis showed that testing for cancer was consistent with either a benefit or no benefit on cancer‐related mortality. Testing did not increase the frequency of an underlying cancer diagnosis. However, the time to cancer diagnosis was shorter in tested participants (mean: one month with extensive tests versus 11 months with tests at the physician's discretion). Furthermore, more people had a detection of early‐stage cancer with extensive tests compared to people who were tested at the physician's discretion (Piccioli 2004b). However, standard deviations for the mean time to diagnosis were not reported and, therefore, it was impossible to independently test the statistical significance of this result. Neither study measured all‐cause mortality, VTE‐related morbidity and mortality, adverse effects of anticoagulation, adverse effects of cancer tests, participant satisfaction or quality of life.
Standard testing plus PET/CT scanning versus standard testing alone
Two studies compared limited screening plus PET/CT scanning of the abdomen and pelvis with limited screening alone in people with a first unprovoked VTE (Carrier 2015; Robin 2016). Standard testing plus PET/CT scanning was consistent with either a benefit or no benefit on all‐cause mortality, cancer‐related mortality and VTE‐related morbidity. Extensive testing did not increase the frequency of an underlying cancer diagnosis. Furthermore, there was no clear difference in the incidence of particular types of cancer or the stage of cancer between the extensive and standard testing groups. One study measured time to cancer diagnosis but standard deviations for the mean time to diagnosis were not reported and, therefore, it was impossible to independently test the statistical significance of this result (Carrier 2015). Carrier 2015 and Robin 2016 did not measure VTE‐related mortality, adverse effects of anticoagulation, adverse effects of cancer tests, participant satisfaction or quality of life.
Overall completeness and applicability of evidence
At present, there is limited evidence concerning whether testing for undiagnosed cancer in people with a first episode of unprovoked VTE (DVT or PE) is effective in reducing cancer‐ and VTE‐related mortality and morbidity and which tests for cancer are most useful. Only four studies met the inclusion criteria for this review (Carrier 2015; Piccioli 2004b; Prandoni 2016; Robin 2016). While the losses to follow‐up were equally balanced within each study, the number of participants in each study was relatively small and pooled analysis is based on 1644 participants. Furthermore, the four studies primarily looked at cancer‐related mortality and incidence of cancer diagnosis as their main outcomes. Other outcomes of interest for this review, such as VTE‐related mortality, adverse effects of anticoagulation, adverse effects of cancer tests and quality of life, were not studied and, therefore, remain unknown.
Quality of the evidence
One study included in the review was judged at low risk of bias (Carrier 2015). Piccioli 2004b was judged at high risk of bias as the study was terminated early for several reasons. First, only five of the more than 40 potential participating centres could contribute participants to the study. Second, some medical ethics committees rejected the protocol because of the absence of screening for occult cancer in the control group, other centres could not start because the proposed extensive screening was judged to be unethical. Finally, the identification of cancer at an apparent early stage in the extensive screening group led to an increasing tendency among physicians in the participating hospitals to initiate screening for cancer in the control participants. Prandoni 2016 was judged at low risk for all domains except other bias, where the risk was deemed to be high as, based on an interim analysis, the study was terminated early because of the low recruitment rate and of the failure to show an appreciable advantage of the CT‐based strategy over the control strategy for detection of cancers. Robin 2016 was judged at low risk for all domains except detection bias, where the risk was deemed high due to lack of blinding of outcome assessors.
For the comparison extensive tests for cancer versus tests at the physician's discretion, the quality of the evidence for cancer‐related mortality and frequency of an underlying cancer diagnosis was downgraded to low as there was a high risk of bias in both studies due to them both being terminated early. However, the outcome was direct and effect estimates were consistent and precise, as reflected in the narrow CIs around the ORs (summary of findings Table for the main comparison). The quality of evidence for type of cancer are presented in a 'Summary of findings' table (Appendix 3). For type of cancer, the evidence was downgraded to low as there was imprecision due to low number of events combined with the study being terminated early.
For the comparison standard testing plus PET/CT scanning versus standard testing alone, the quality of the evidence was graded as moderate for all‐cause mortality and cancer‐related mortality due to the high risk of detection bias in Robin 2016. For VTE‐related morbidity, the quality of the evidence was downgraded to moderate as only one study measured this outcome. For stage of cancer, the evidence was downgraded to low as there was imprecision due to low number of events and there was a high risk of detection bias (summary of findings Table 2). The quality of evidence for type of cancer are presented in a summary of findings table in Appendix 4. For type of cancer, the evidence was judged to be moderate if there was imprecision due to low number of events or where the study was at high risk of detection bias. Where both imprecision and detection bias occurred together, the quality of the evidence was downgraded to low.
Potential biases in the review process
None of the authors of this review were involved in any of the included or excluded studies. Furthermore, none have any commercial or other conflict of interest. The search was as comprehensive as possible, and all studies were independently assessed for inclusion by two review authors. We are confident that we have included all relevant studies and we have attempted to reduce bias in the review process by performing data extraction and assessing study quality independently. However, the possibility remains that we may have missed studies that have not been published.
We judged blinding of investigators and participants to be at low risk of bias. It would have been impossible to blind participants and staff to tests such as scans. Therefore, there is a risk of cross‐over bias in participants in the control group with them having further tests. However, the effect of this would be to minimise the apparent benefit from testing that was observed, and, therefore, this does not detract from the conclusions of the study or review.
In this review, we presented the studies by Piccioli 2004b and Prandoni 2016 together as both studies compared extensive tests for cancer versus "tests at the physicians discretion". The studies by Carrier 2015 and Robin 2016 were reported in a separate analysis as both studies compared limited screening plus PET/CT scanning versus limited screening alone. Combining all four studies in a meta‐analysis would have been problematic due to the different definitions of the comparator groups. However, the control group of the Carrier 2015 and Robin 2016 studies included some of the tests in the test group of the studies by Piccioli 2004b and Prandoni 2016, which may account for why there was no clear difference observed, along with participation of all people in breast and colorectal cancer screening programmes. This may also be the reason for the very low incidence of cancer in the studies by Carrier 2015 and Robin 2016 compared to the studies by Piccioli 2004b and Prandoni 2016.
Agreements and disagreements with other studies or reviews
To date, no other systematic review has assessed the effectiveness of testing for cancer on cancer‐related mortality in people with an unprovoked VTE.

Study flow diagram.
Risk of bias graph: review authors' judgements about each risk of bias item presented as percentages across all included studies.

Risk of bias summary: review authors' judgements about each risk of bias item for each included study.

Comparison 1 Extensive tests versus tests at the physician's discretion, Outcome 1 Cancer‐related mortality.
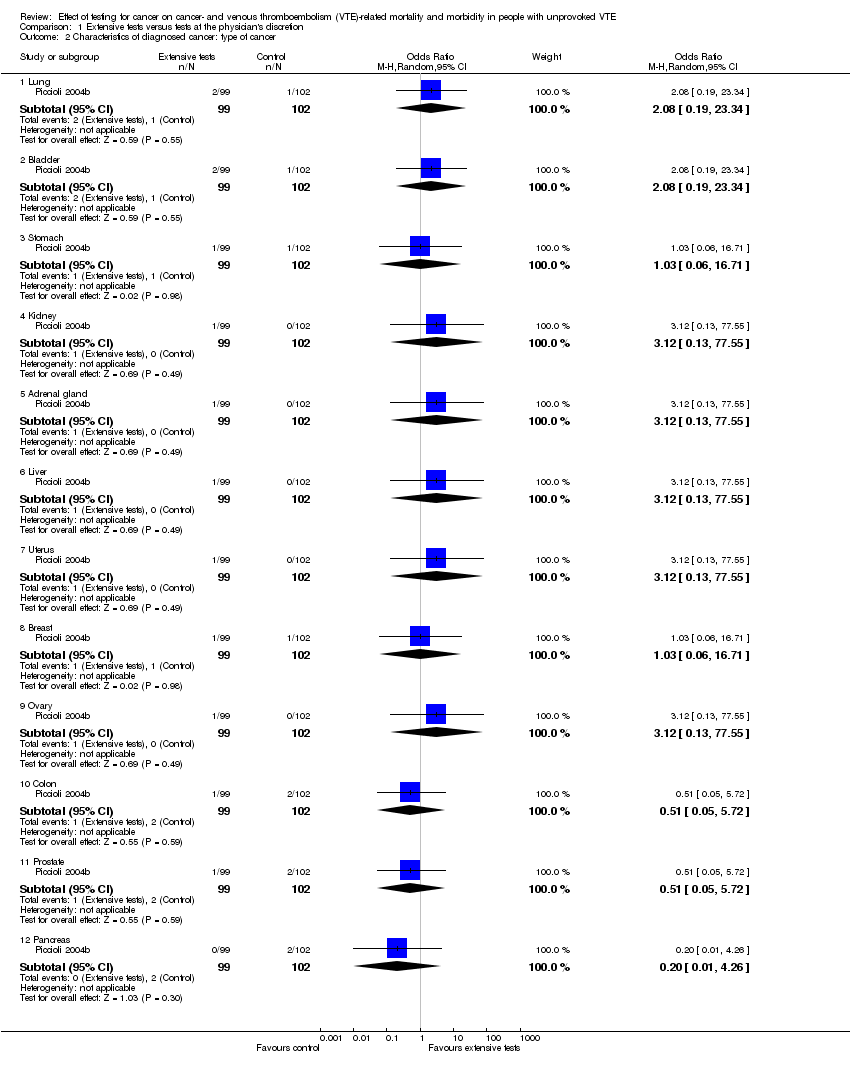
Comparison 1 Extensive tests versus tests at the physician's discretion, Outcome 2 Characteristics of diagnosed cancer: type of cancer.

Comparison 1 Extensive tests versus tests at the physician's discretion, Outcome 3 Characteristics of diagnosed cancer: stage of cancer.
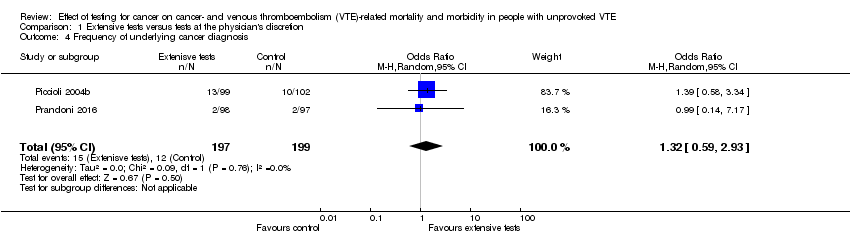
Comparison 1 Extensive tests versus tests at the physician's discretion, Outcome 4 Frequency of underlying cancer diagnosis.

Comparison 2 Standard testing plus PET/CT scanning versus standard testing alone, Outcome 1 All‐cause mortality.

Comparison 2 Standard testing plus PET/CT scanning versus standard testing alone, Outcome 2 Cancer‐related mortality.
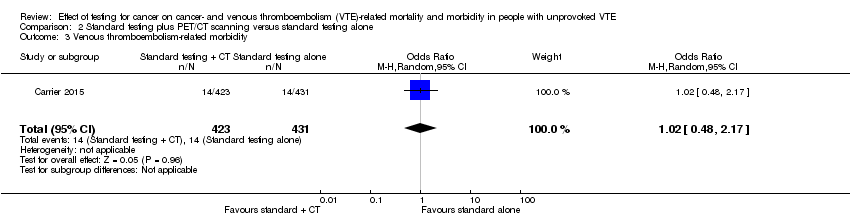
Comparison 2 Standard testing plus PET/CT scanning versus standard testing alone, Outcome 3 Venous thromboembolism‐related morbidity.
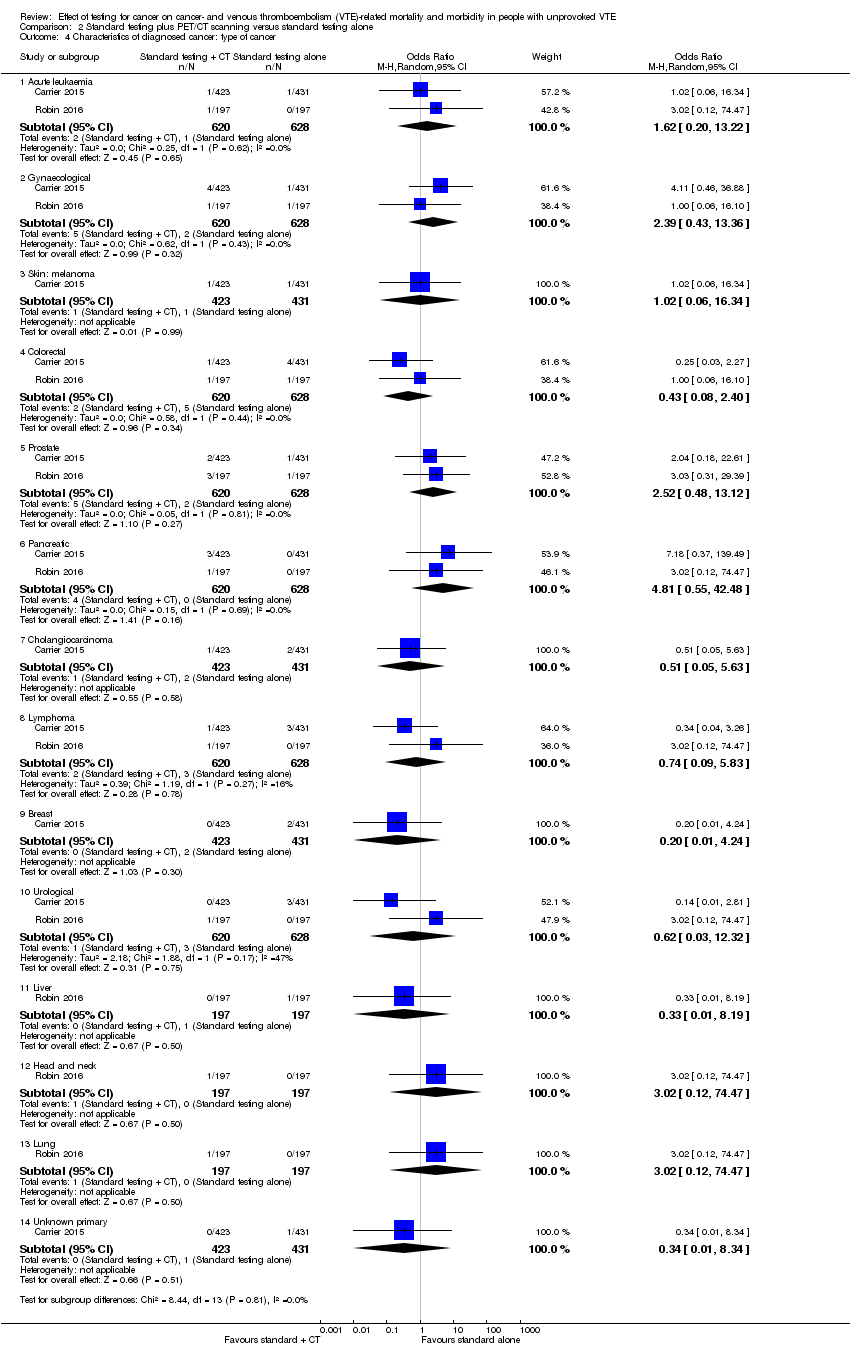
Comparison 2 Standard testing plus PET/CT scanning versus standard testing alone, Outcome 4 Characteristics of diagnosed cancer: type of cancer.

Comparison 2 Standard testing plus PET/CT scanning versus standard testing alone, Outcome 5 Characteristics of diagnosed cancer: stage of cancer.
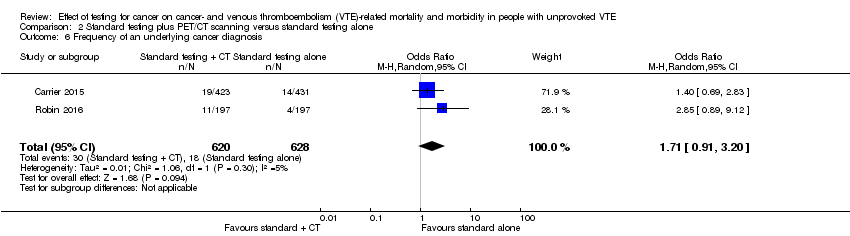
Comparison 2 Standard testing plus PET/CT scanning versus standard testing alone, Outcome 6 Frequency of an underlying cancer diagnosis.
| Extensive tests versus tests at the physician's discretion | ||||||
| Patient or population: people with unprovoked VTE Setting: hospital Intervention: extensive tests Comparison: tests at the physician's discretion | ||||||
| Outcomes | Anticipated absolute effects* (95% CI) | Relative effect | No of participants | Quality of the evidence | Comments | |
| Risk with tests at physician's discretion | Risk with extensive tests | |||||
| All‐cause mortality1 | See comment | See comment | See comment | See comment | See comment | No study measured this outcome. |
| Cancer‐related mortality2 | Study population | OR 0.49 | 396 | ⊕⊕⊝⊝ | ‐ | |
| 40 per 1000 | 20 per 1000 | |||||
| VTE‐related mortality4 | See comment | See comment | See comment | See comment | See comment | No study measured this outcome. |
| VTE‐related morbidity5 | See comment | See comment | See comment | See comment | See comment | No study measured this outcome. |
| Stage of cancer ‐ early6 | Study population | OR 5.00 | 201 (1 RCT) | ⊕⊕⊝⊝ | ‐ | |
| 20 per 1000 | 91 per 1000 | |||||
| Stage of cancer ‐ advanced8 | Study population | OR 0.25 | 201 | ⊕⊕⊝⊝ | ‐ | |
| 39 per 1000 | 10 per 1000 | |||||
| Time to cancer diagnosis9 | See comments | See comments | See comments | 201 (1 RCT) | See comments | Time to cancer diagnosis (measured from time of diagnosis of VTE) measured in 1 study (Piccioli 2004b), and reported as a mean of 1 month with extensive tests compared to 11.6 months with tests at physician's discretion (P < 0.001). Standard deviations for these means not given. Attempts to contact author for these data made but no response received. |
| Frequency of underlying cancer diagnosis10 | 60 per 1000 | 78 per 1000 | OR 1.32 | 396 | ⊕⊕⊝⊝ | ‐ |
| *The risk in the intervention group (and its 95% confidence interval) is based on the assumed risk in the comparison group and the relative effect of the intervention (and its 95% CI). CI: confidence interval; OR: odds ratio; RCT: randomised controlled trial; VTE: venous thromboembolism. | ||||||
| GRADE Working Group grades of evidence | ||||||
| 1 Death due to any cause. | ||||||
| Standard testing plus PET/CT scanning versus standard testing alone | ||||||
| Patient or population: people with unprovoked VTE Setting: hospital Intervention: standard testing + PET/CT scanning Comparison: standard testing alone | ||||||
| Outcomes | Anticipated absolute effects* (95% CI) | Relative effect | No of participants | Quality of the evidence | Comments | |
| Risk with standard testing alone | Risk with standard testing + PET/CT scanning | |||||
| All‐cause mortality1 | Study population | OR 1.22 | 1248 | ⊕⊕⊕⊝ | ‐ | |
| 14 per 1000 | 17 per 1000 | |||||
| Cancer‐related mortality3 | Study population | OR 0.55 | 1248 | ⊕⊕⊕⊝ | ‐ | |
| 18 per 1000 | 10 per 1000 | |||||
| VTE‐related mortality4 | See comment | See comment | See comment | See comment | See comment | No study measured this outcome. |
| VTE‐related morbidity5 | Study population | OR 1.02 | 854 | ⊕⊕⊕⊝ | ‐ | |
| 32 per 1000 | 33 per 1000 | |||||
| Stage of cancer ‐ early | Study population | OR 1.78 | 394 | ⊕⊕⊝⊝ | ‐ | |
| 20 per 1000 | 36 per 1000 | |||||
| Stage of cancer ‐ advanced | Study population | OR 1.00 | 394 | ⊕⊕⊝⊝ | ‐ | |
| 10 per 1000 | 10 per 1000 | |||||
| Time to cancer diagnosis7 | See comments | See comments | See comments | 854 (1 RCT) | See comments | Time to cancer diagnosis measured in Carrier 2015 as 4.2 months in standard testing group and 4.0 months in standard testing + PET/CT group (P = 0.88). However, standard deviations for these means not given. Attempts made to contact author for these data but no response received. |
| Frequency of an underlying cancer diagnosis8 | Study population | OR 1.71 | 1248 | ⊕⊕⊕⊝ | ‐ | |
| 29 per 1000 | 48 per 1000 | |||||
| *The risk in the intervention group (and its 95% confidence interval) is based on the assumed risk in the comparison group and the relative effect of the intervention (and its 95% CI). CI: confidence interval; OR: odds ratio; PET/CT: positron emission tomography/computed tomography; RCT: randomised controlled trial; VTE: venous thromboembolism. | ||||||
| GRADE Working Group grades of evidence | ||||||
| 1 Death due to any cause. | ||||||
| Outcome or subgroup title | No. of studies | No. of participants | Statistical method | Effect size |
| 1 Cancer‐related mortality Show forest plot | 2 | 396 | Odds Ratio (M‐H, Random, 95% CI) | 0.49 [0.15, 1.67] |
| 2 Characteristics of diagnosed cancer: type of cancer Show forest plot | 1 | Odds Ratio (M‐H, Random, 95% CI) | Subtotals only | |
| 2.1 Lung | 1 | 201 | Odds Ratio (M‐H, Random, 95% CI) | 2.08 [0.19, 23.34] |
| 2.2 Bladder | 1 | 201 | Odds Ratio (M‐H, Random, 95% CI) | 2.08 [0.19, 23.34] |
| 2.3 Stomach | 1 | 201 | Odds Ratio (M‐H, Random, 95% CI) | 1.03 [0.06, 16.71] |
| 2.4 Kidney | 1 | 201 | Odds Ratio (M‐H, Random, 95% CI) | 3.12 [0.13, 77.55] |
| 2.5 Adrenal gland | 1 | 201 | Odds Ratio (M‐H, Random, 95% CI) | 3.12 [0.13, 77.55] |
| 2.6 Liver | 1 | 201 | Odds Ratio (M‐H, Random, 95% CI) | 3.12 [0.13, 77.55] |
| 2.7 Uterus | 1 | 201 | Odds Ratio (M‐H, Random, 95% CI) | 3.12 [0.13, 77.55] |
| 2.8 Breast | 1 | 201 | Odds Ratio (M‐H, Random, 95% CI) | 1.03 [0.06, 16.71] |
| 2.9 Ovary | 1 | 201 | Odds Ratio (M‐H, Random, 95% CI) | 3.12 [0.13, 77.55] |
| 2.10 Colon | 1 | 201 | Odds Ratio (M‐H, Random, 95% CI) | 0.51 [0.05, 5.72] |
| 2.11 Prostate | 1 | 201 | Odds Ratio (M‐H, Random, 95% CI) | 0.51 [0.05, 5.72] |
| 2.12 Pancreas | 1 | 201 | Odds Ratio (M‐H, Random, 95% CI) | 0.20 [0.01, 4.26] |
| 3 Characteristics of diagnosed cancer: stage of cancer Show forest plot | 1 | Odds Ratio (M‐H, Random, 95% CI) | Subtotals only | |
| 3.1 T1 or T2 (N0 M0) | 1 | 201 | Odds Ratio (M‐H, Random, 95% CI) | 5.00 [1.05, 23.76] |
| 3.2 T3 | 1 | 201 | Odds Ratio (M‐H, Random, 95% CI) | 0.25 [0.03, 2.28] |
| 4 Frequency of underlying cancer diagnosis Show forest plot | 2 | 396 | Odds Ratio (M‐H, Random, 95% CI) | 1.32 [0.59, 2.93] |
| Outcome or subgroup title | No. of studies | No. of participants | Statistical method | Effect size |
| 1 All‐cause mortality Show forest plot | 2 | 1248 | Odds Ratio (M‐H, Random, 95% CI) | 1.22 [0.49, 3.04] |
| 2 Cancer‐related mortality Show forest plot | 2 | 1248 | Odds Ratio (M‐H, Random, 95% CI) | 0.55 [0.20, 1.52] |
| 3 Venous thromboembolism‐related morbidity Show forest plot | 1 | 854 | Odds Ratio (M‐H, Random, 95% CI) | 1.02 [0.48, 2.17] |
| 4 Characteristics of diagnosed cancer: type of cancer Show forest plot | 2 | Odds Ratio (M‐H, Random, 95% CI) | Subtotals only | |
| 4.1 Acute leukaemia | 2 | 1248 | Odds Ratio (M‐H, Random, 95% CI) | 1.62 [0.20, 13.22] |
| 4.2 Gynaecological | 2 | 1248 | Odds Ratio (M‐H, Random, 95% CI) | 2.39 [0.43, 13.36] |
| 4.3 Skin: melanoma | 1 | 854 | Odds Ratio (M‐H, Random, 95% CI) | 1.02 [0.06, 16.34] |
| 4.4 Colorectal | 2 | 1248 | Odds Ratio (M‐H, Random, 95% CI) | 0.43 [0.08, 2.40] |
| 4.5 Prostate | 2 | 1248 | Odds Ratio (M‐H, Random, 95% CI) | 2.52 [0.48, 13.12] |
| 4.6 Pancreatic | 2 | 1248 | Odds Ratio (M‐H, Random, 95% CI) | 4.81 [0.55, 42.48] |
| 4.7 Cholangiocarcinoma | 1 | 854 | Odds Ratio (M‐H, Random, 95% CI) | 0.51 [0.05, 5.63] |
| 4.8 Lymphoma | 2 | 1248 | Odds Ratio (M‐H, Random, 95% CI) | 0.74 [0.09, 5.83] |
| 4.9 Breast | 1 | 854 | Odds Ratio (M‐H, Random, 95% CI) | 0.20 [0.01, 4.24] |
| 4.10 Urological | 2 | 1248 | Odds Ratio (M‐H, Random, 95% CI) | 0.62 [0.03, 12.32] |
| 4.11 Liver | 1 | 394 | Odds Ratio (M‐H, Random, 95% CI) | 0.33 [0.01, 8.19] |
| 4.12 Head and neck | 1 | 394 | Odds Ratio (M‐H, Random, 95% CI) | 3.02 [0.12, 74.47] |
| 4.13 Lung | 1 | 394 | Odds Ratio (M‐H, Random, 95% CI) | 3.02 [0.12, 74.47] |
| 4.14 Unknown primary | 1 | 854 | Odds Ratio (M‐H, Random, 95% CI) | 0.34 [0.01, 8.34] |
| 5 Characteristics of diagnosed cancer: stage of cancer Show forest plot | 1 | Odds Ratio (M‐H, Random, 95% CI) | Subtotals only | |
| 5.1 Early | 1 | 394 | Odds Ratio (M‐H, Random, 95% CI) | 1.78 [0.51, 6.17] |
| 5.2 Advanced | 1 | 394 | Odds Ratio (M‐H, Random, 95% CI) | 1.0 [0.14, 7.17] |
| 6 Frequency of an underlying cancer diagnosis Show forest plot | 2 | 1248 | Odds Ratio (M‐H, Random, 95% CI) | 1.71 [0.91, 3.20] |