Efecto de las pruebas de cáncer en la mortimorbilidad relacionada con el cáncer o la tromboembolia venosa (TEV) en personas con TEV no provocada
Resumen
Antecedentes
Tromboembolia venosa (TEV) es el término conjunto para dos afecciones: trombosis venosa profunda (TVP) y embolia pulmonar (EP). Una proporción de personas con TEV no tiene factores de riesgo subyacentes o inmediatamente predisponentes y la TEV se denomina no provocada. La TEV sin causa aparente a menudo puede ser la primera manifestación clínica de una neoplasia maligna subyacente. Esto ha planteado la cuestión de si las personas con una TEV no provocada deben ser investigadas por un cáncer subyacente. El tratamiento de la TEV es diferente en los pacientes con cáncer y sin cáncer y un diagnóstico correcto aseguraría que los pacientes recibieran el tratamiento óptimo para la TEV para prevenir la recurrencia y la morbilidad adicional. Además, un diagnóstico adecuado del cáncer en una etapa temprana podría evitar el riesgo de progresión del cáncer y conducir a mejoras en la mortalidad y la morbilidad relacionadas con el cáncer. Esta es la tercera actualización de una revisión publicada por primera vez en 2015.
Objetivos
Determinar si las pruebas para el cáncer no diagnosticado en personas con un primer episodio de TEV no provocado (TVP de miembros inferiores o EP) son eficaces para reducir la mortalidad y morbilidad relacionadas con el cáncer o con la TEV, y determinar qué pruebas de cáncer son mejores para identificar de manera temprana los cánceres tratables.
Métodos de búsqueda
El documentalista del Grupo Cochrane Vascular (Cochrane Vascular) buscó en el registro especializado del Grupo Cochrane Vascular, en las bases de datos CENTRAL, MEDLINE, Embase y CINAHL, en los registros de ensayos Plataforma de registros internacionales de ensayos clínicos de la Organización Mundial de la Salud y ClinicalTrials.gov hasta el 5 de mayo de 2021. También se realizó la verificación de las referencias para identificar estudios adicionales.
Criterios de selección
Los estudios elegibles para inclusión fueron los ensayos aleatorizados y cuasialeatorizados en los que se asignó a personas con una TEV no provocada a hacerse pruebas específicas para identificar el cáncer o solo pruebas indicadas clínicamente.
Obtención y análisis de los datos
Dos autores de la revisión seleccionaron los estudios de forma independiente, evaluaron el riesgo de sesgo y extrajeron los datos. La certeza de la evidencia se evaluó mediante el método GRADE. Los desacuerdos se resolvieron mediante debate. Los desenlaces principales de interés fueron la mortalidad por todas las causas, la mortalidad relacionada con el cáncer y la mortalidad relacionada con la TEV.
Resultados principales
No se identificaron nuevos estudios para esta actualización de 2021. En total, se incluyen cuatro estudios con 1644 participantes. Dos estudios evaluaron el efecto de las pruebas extensivas, incluida la tomografía computarizada (TC), versus las pruebas a discreción del médico, mientras que los otros dos estudios evaluaron el efecto de las pruebas estándar más la tomografía por emisión de positrones (PET)/TC versus las pruebas estándar solamente. En el caso de las pruebas extensivas que incluyen TC versus pruebas a discreción del médico, la certeza de la evidencia, evaluada mediante el método GRADE, fue baja debido al riesgo de sesgo (finalización temprana de los estudios). Cuando se compararon las pruebas estándar más la exploración con PET/TC con las pruebas estándar solamente, la certeza de la evidencia fue moderada debido al riesgo de sesgo de detección. La certeza de la evidencia se redujo aún más, ya que el sesgo de detección estaba presente en un estudio con un número bajo de eventos.
Cuando se compararon las pruebas extensivas que incluían la TC versus las pruebas a discreción del médico, el análisis combinado de dos estudios mostró que las pruebas para el cáncer eran consistentes con un beneficio o ningún beneficio sobre la mortalidad relacionada con el cáncer (odds ratio [OR] 0,49; intervalo de confianza [IC] del 95%: 0,15 a 1,67; 396 participantes, dos estudios; evidencia de certeza baja). Un estudio (201 participantes) mostró que, en general, las neoplasias malignas estaban menos avanzadas en el diagnóstico en los participantes sometidos a pruebas exhaustivas que en los participantes del grupo control. En total, 9/13 participantes diagnosticados con cáncer en el grupo sometido a pruebas exhaustivas presentaron una malignidad en estadio T1 o T2, en comparación con 2/10 participantes diagnosticados con cáncer en el grupo control (OR 5,00; IC del 95%: 1,05 a 23,76; evidencia de certeza baja). No hubo una diferencia clara en la detección de los estadios avanzados entre las pruebas extensivas versus las pruebas a criterio del médico: un participante del grupo de pruebas extensivas tenía el estadio T3 en comparación con cuatro participantes del grupo control (OR 0,25; IC del 95%: 0,03 a 2,28; evidencia de certeza baja). Además, los participantes que se sometieron a pruebas exhaustivas fueron diagnosticados antes que los del grupo control (media: un mes con pruebas extensivas versus 11,6 meses con pruebas a discreción del médico para el diagnóstico de cáncer desde el momento del diagnóstico de la TEV). Las pruebas exhaustivas no aumentaron la frecuencia de un diagnóstico de cáncer subyacente (OR 1,32; IC del 95%: 0,59 a 2,93; 396 participantes; dos estudios; evidencia de certeza baja). Ninguno de los estudios midió la mortalidad por todas las causas, la morbilidad y la mortalidad relacionadas con la TEV, las complicaciones de la anticoagulación, los efectos adversos de las pruebas de cáncer, la satisfacción de los participantes ni la calidad de vida.
Cuando se comparó la prueba estándar más el cribado con PET/TC versus la prueba estándar sola, la prueba estándar más el cribado con PET/TC fue consistente con un beneficio o ningún beneficio sobre la mortalidad por todas las causas (OR 1,22; IC del 95%: 0,49 a 3,04; 1248 participantes; dos estudios; evidencia de certeza moderada), la mortalidad relacionada con el cáncer (OR 0,55; IC del 95%: 0,20 a 1,52; 1248 participantes; dos estudios; evidencia de certeza moderada) o la morbilidad relacionada con la TEV (OR 1,02; IC del 95%: 0,48 a 2,17; 854 participantes; un estudio; evidencia de certeza moderada). En cuanto al estadio del cáncer, no hubo diferencias claras en la detección de los estadios tempranos (OR 1,78, 95% 0,51 a 6,17; 394 participantes; un estudio; evidencia de certeza baja) ni avanzados (OR 1,00; IC del 95% 0,14 a 7,17; 394 participantes; un estudio; evidencia de certeza baja) del cáncer. Tampoco hubo diferencias claras en la frecuencia de un diagnóstico de cáncer subyacente (OR 1,71; IC del 95%: 0,91 a 3,20; 1248 participantes; dos estudios; evidencia de certeza moderada). El tiempo hasta el diagnóstico de cáncer fue de 4,2 meses en el grupo de pruebas estándar y 4,0 meses en el grupo de pruebas estándar más PET/TC (p = 0,88). Ninguno de los dos estudios midió la mortalidad relacionada con la TEV, las complicaciones de la anticoagulación, los efectos adversos de las pruebas de cáncer, la satisfacción de los participantes o la calidad de vida.
Conclusiones de los autores
Las pruebas específicas para el cáncer en personas con TEV no provocada podrían llevar a un diagnóstico más precoz del cáncer en una etapa más temprana de la enfermedad. Sin embargo, actualmente no hay evidencia suficiente para establecer conclusiones definitivas en cuanto a la efectividad de las pruebas de detección de cáncer no diagnosticado en las personas con un primer episodio de TEV (TVP o EP) sin causa aparente para reducir la morbilidad y la mortalidad relacionadas con el cáncer y con la TEV. Los resultados podrían ser consistentes con un beneficio o ningún beneficio. Se necesitan más ensayos controlados aleatorizados a gran escala de buena calidad antes de poder establecer conclusiones firmes.
PICO
Resumen en términos sencillos
¿Las pruebas de detección de cáncer en personas con coágulos sanguíneos sin causa aparente en las piernas y los pulmones reducen la mortalidad y la enfermedad relacionadas con el cáncer y los coágulos?
Mensaje clave
Esta revisión encontró que hay muy pocos ensayos para determinar si las pruebas de detección de cáncer no diagnosticado en los pacientes con una primera tromboembolia venosa (TEV) sin causa aparente son eficaces para reducir las muertes y la enfermedad relacionadas con el cáncer y la TEV. Se requieren más estudios de buena calidad y a gran escala.
¿Por qué es importante esta pregunta?
La tromboembolia venosa (TEV) hace referencia a los coágulos sanguíneos de las venas de las piernas (conocida como trombosis venosa profunda [TVP]), que se pueden desplazar a los pulmones (y causar embolia pulmonar [EP]). Con frecuencia la EP puede ser mortal. Los signos de TVP incluyen dolor e hinchazón de la pierna, mientras que los signos de la EP incluyen dificultad para respirar y dolor de pecho. Los factores de riesgo para la TEV incluyen cirugía, reposo prolongado en cama, traumatismos, antecedentes familiares, embarazo y deficiencias sanguíneas. A veces la TEV se produce sin razón aparente (sin causa). En dichas personas, un cáncer no detectado podría ser la causa de la TEV. Lo anterior ha suscitado la pregunta de si en las personas con una TEV sin causa aparente se debe investigar un cáncer subyacente. Esta pregunta es potencialmente importante ya que el tratamiento de la TEV difiere en las personas con y sin cáncer. Un diagnóstico de cáncer aseguraría que las personas recibieran el tratamiento óptimo para reducir el riesgo de otra TEV. El diagnóstico también podría dar lugar a que el cáncer se trate antes, en un estadio más curable.
¿Qué se hizo?
Se buscaron estudios controlados aleatorizados que evaluaran si las pruebas de detección de cáncer no diagnosticado en personas con una primera TEV (TVP o EP) sin causa aparente fueron eficaces para reducir el cáncer y la enfermedad y la muerte relacionadas con la TEV. En los estudios controlados aleatorizados se decide al azar el tratamiento que reciben las personas y suelen proporcionar la evidencia más fiable acerca de los tratamientos.
¿Qué se encontró?
Se encontraron cuatro estudios con 1644 participantes. Dos estudios compararon pruebas de cáncer extensivas con pruebas realizadas a discreción del médico y dos estudios compararon pruebas de cáncer más exploraciones con pruebas de cáncer solamente. La combinación de los resultados de los dos estudios indicó que las pruebas no tuvieron efectos sobre el número de muertes relacionadas con el cáncer. Además, las pruebas no identificaron a más pacientes con cáncer. Sin embargo, las pruebas exhaustivas identificaron los cánceres en una etapa más temprana (aproximadamente diez meses antes) y los cánceres eran menos avanzados en las personas del grupo de pruebas exhaustivas que en las personas del grupo de pruebas realizadas a discreción del médico. Ningún estudio consideró el número de muertes debido a cualquier causa, las muertes y la enfermedad asociadas con la TEV, los efectos secundarios de las pruebas de cáncer, los efectos secundarios del tratamiento de la TEV ni la satisfacción de los pacientes. Dos estudios que compararon las pruebas más exploraciones con las pruebas solas mostraron que añadir la exploración por tomografía computarizada tuvo poco o ningún efecto en el número de muertes, las muertes relacionadas con el cáncer, las enfermedades asociadas con la TEV; tampoco identificó a más personas con cáncer, ni mostró una clara diferencia en el tiempo hasta el diagnóstico o en los estadios del cáncer diagnosticado. Ninguno de los dos estudios examinó las muertes asociadas con la TEV, los efectos secundarios de las pruebas de cáncer, los efectos secundarios del tratamiento de la TEV, la satisfacción de los participantes ni la calidad de vida.
¿Qué certeza se tiene en la evidencia?
Cuando se comparan pruebas exhaustivas con pruebas a discreción del médico, la certeza de la evidencia fue baja debido al sesgo causado por dos de los estudios que se detuvieron antes de tiempo. Al comparar las pruebas más la exploración con PET/TC con las pruebas solas, la certeza de la evidencia varió de baja a moderada debido problemas con cómo se diseñaron los estudios, a la imprecisión causada por un escaso número de episodios y al sesgo debido a la falta de cegamiento de las personas que evaluaban los efectos.
¿Cuál es el grado de actualización de esta evidencia?
Esta revisión Cochrane actualiza la evidencia anterior. La evidencia está actualizada hasta mayo de 2021.
Authors' conclusions
Summary of findings
| Extensive tests versus tests at the physician's discretion | ||||||
| Patient or population: people with unprovoked VTE Setting: hospital Intervention: extensive tests Comparison: tests at the physician's discretion | ||||||
| Outcomes | Anticipated absolute effects* (95% CI) | Relative effect | No of participants | Certainty of the evidence | Comments | |
|---|---|---|---|---|---|---|
| Risk with tests at physician's discretion | Risk with extensive tests | |||||
| All‐cause mortality1 | See comment | See comment | See comment | See comment | See comment | No study measured this outcome. |
| Cancer‐related mortality2 | Study population | OR 0.49 | 396 | ⊕⊕⊝⊝ | ‐ | |
| 40 per 1000 | 20 per 1000 | |||||
| VTE‐related mortality4 | See comment | See comment | See comment | See comment | See comment | No study measured this outcome. |
| VTE‐related morbidity5 | See comment | See comment | See comment | See comment | See comment | No study measured this outcome. |
| Stage of cancer ‐ early6 | Study population | OR 5.00 | 201 (1 RCT) | ⊕⊕⊝⊝ | ‐ | |
| 20 per 1000 | 91 per 1000 | |||||
| Stage of cancer ‐ advanced8 | Study population | OR 0.25 | 201 | ⊕⊕⊝⊝ | ‐ | |
| 39 per 1000 | 10 per 1000 | |||||
| Time to cancer diagnosis9 | See comments | See comments | See comments | 201 (1 RCT) | See comments | Time to cancer diagnosis (measured from time of diagnosis of VTE) measured in 1 study (Piccioli 2004b), and reported as a mean of 1 month with extensive tests compared to 11.6 months with tests at physician's discretion (P < 0.001). Standard deviations for these means not given. Attempts to contact author for these data made but no response received. |
| Frequency of underlying cancer diagnosis10 | 60 per 1000 | 78 per 1000 | OR 1.32 | 396 | ⊕⊕⊝⊝ | ‐ |
| *The risk in the intervention group (and its 95% confidence interval) is based on the assumed risk in the comparison group and the relative effect of the intervention (and its 95% CI). CI: confidence interval; OR: odds ratio; RCT: randomised controlled trial; VTE: venous thromboembolism. | ||||||
| GRADE Working Group grades of evidence | ||||||
| 1 Death due to any cause. | ||||||
| Standard testing plus PET/CT scanning versus standard testing alone | ||||||
| Patient or population: people with unprovoked VTE Setting: hospital Intervention: standard testing + PET/CT scanning Comparison: standard testing alone | ||||||
| Outcomes | Anticipated absolute effects* (95% CI) | Relative effect | No of participants | Certainty of the evidence | Comments | |
|---|---|---|---|---|---|---|
| Risk with standard testing alone | Risk with standard testing + PET/CT scanning | |||||
| All‐cause mortality1 | Study population | OR 1.22 | 1248 | ⊕⊕⊕⊝ | ‐ | |
| 14 per 1000 | 17 per 1000 | |||||
| Cancer‐related mortality3 | Study population | OR 0.55 | 1248 | ⊕⊕⊕⊝ | ‐ | |
| 18 per 1000 | 10 per 1000 | |||||
| VTE‐related mortality4 | See comment | See comment | See comment | See comment | See comment | No study measured this outcome. |
| VTE‐related morbidity5 | Study population | OR 1.02 | 854 | ⊕⊕⊕⊝ | ‐ | |
| 32 per 1000 | 33 per 1000 | |||||
| Stage of cancer ‐ early | Study population | OR 1.78 | 394 | ⊕⊕⊝⊝ | ‐ | |
| 20 per 1000 | 36 per 1000 | |||||
| Stage of cancer ‐ advanced | Study population | OR 1.00 | 394 | ⊕⊕⊝⊝ | ‐ | |
| 10 per 1000 | 10 per 1000 | |||||
| Time to cancer diagnosis7 | See comments | See comments | See comments | 854 (1 RCT) | See comments | Time to cancer diagnosis measured in Carrier 2015 as 4.2 months in standard testing group and 4.0 months in standard testing + PET/CT group (P = 0.88). However, standard deviations for these means not given. Attempts made to contact author for these data but no response received. |
| Frequency of an underlying cancer diagnosis8 | Study population | OR 1.71 | 1248 | ⊕⊕⊕⊝ | ‐ | |
| 29 per 1000 | 48 per 1000 | |||||
| *The risk in the intervention group (and its 95% confidence interval) is based on the assumed risk in the comparison group and the relative effect of the intervention (and its 95% CI). CI: confidence interval; OR: odds ratio; PET/CT: positron emission tomography/computed tomography; RCT: randomised controlled trial; VTE: venous thromboembolism. | ||||||
| GRADE Working Group grades of evidence | ||||||
| 1 Death due to any cause. | ||||||
Background
Description of the condition
Venous thromboembolism (VTE) is the collective term for the clinical conditions deep vein thrombosis (DVT) and pulmonary embolism (PE). DVT is the formation of a blood clot (thrombus) in a deep vein, predominantly in the legs. Symptoms include pain, tenderness, erythema and swelling of the affected leg. PE occurs when part or all the thrombus breaks off (embolises) and travels up to the lungs blocking the pulmonary arteries. Symptoms of PE include breathlessness and chest pain (Blann 2006).
Guidelines published by the UK National Institute for Health and Care Excellence (NICE) recommend that people with a suspected VTE should be risk stratified using various diagnostic investigations. Anticoagulant therapy with low molecular weight heparin (LMWH) should be administered in the interim. People with confirmed VTE should receive LMWH or fondaparinux for at least the initial five days and be started on a vitamin K antagonist. The LMWH should be stopped when the international normalised ratio has been above 2 for at least 24 hours. Vitamin K antagonists should be continued for at least three months. In people with an unprovoked VTE, consideration should be given to extending anticoagulation beyond three months. However, people with cancer‐associated VTE should be treated with LMWH from the initial diagnosis for a period of six months, and considered for continuation of anticoagulation with either LMWH or a vitamin K antagonist based on the status of the underlying cancer and risks of anticoagulation (NICE 2020). Direct oral anticoagulants (DOACs) such as rivaroxaban have been used for the initial treatment and prevention of recurrent VTE. Two systematic reviews have shown that DOACs may be as safe and effective as conventional anticoagulation for the prevention of recurrent VTE in people with cancer but, direct comparisons to the current standard of care with LMWH are limited (Carrier 2014; Vedovati 2015).
The difference in management of people with a cancer‐associated VTE is due to their significantly higher risk of VTE recurrence, which is estimated to be three times higher than in people with VTE in the absence of cancer (Levitan 1999). Furthermore, people with cancer and an associated VTE have a poorer overall prognosis compared to people without a VTE (Sorensen 2000).
A proportion of people with VTE have no underlying or immediately apparent cause and the VTE is referred to as unprovoked. Unprovoked VTE can suggest underlying malignancies such as cancer of the blood, kidney, ovary, pancreas, stomach and lung (Bick 1978; Kakkar 2003; Lee 2003a; Prandoni 1997; White 2005). Results from one Swedish prospective cohort study of almost 62,000 participants determined that the standardised incidence ratio of a cancer diagnosis within the first two years of an unprovoked VTE was 4.4 (Baron 1998), and there was an overall absolute incidence of cancer of 11% (NICE 2012). One study of 339 participants with a first episode of an unprovoked VTE determined that the risk ratio (RR) of cancer‐related mortality at two years was 0.52 (95% confidence interval (CI) 0.10 to 2.75) in people undergoing intensive investigations compared to routine tests, while the RR for early‐stage cancer detection was 3.21 (95% CI 0.88 to 11.79) (Piccioli 2004a).
Therefore, people who present with an apparent unprovoked VTE have a significant underlying risk of malignancy or cancer‐associated VTE, with significant implications for the management of the VTE itself (three months' vitamin K antagonist versus six months' LMWH), the prognosis related to risk of VTE recurrence and the precipitating cancer. NICE guidelines recommend that all people presenting with a first episode of unprovoked VTE (DVT or PE) should undergo a medical history review and baseline blood test results including full blood count, renal and hepatic function, PT and APTT, and offer a physical examination (NICE 2020). This is consistent with other guidelines (ISTH 2017). If these initial investigations suggest signs and symptoms of cancer then further tests including abdomino‐pelvic computed tomography (CT) and positron emission tomography (PET) scans and ultrasound, are recommended. For people presenting with VTE at unusual sites (e.g. splanchnic vein thrombosis), further imaging tests are not recommended because the CT scans used for the initial diagnosis would be adequate for occult cancer detection. Given the higher prevalence of JAK2 mutation in patients with splanchnic vein thrombosis, JAK2V617F mutation testing to screen for a myeloproliferative disorder should be considered in patients with unprovoked events (ISTH 2017).
Detection of cancer at an earlier stage enables more effective treatment. This has raised the question of whether people with an unprovoked VTE should be investigated for underlying cancer. Some authors have referred to this as 'screening for cancer' although this is somewhat misleading as screening refers to the investigation of asymptomatic people. Instead, people with VTE are better regarded as presenting with symptoms suggestive of underlying cancer and the aim of investigations is to refine the diagnosis of VTE based on the underlying cause, so that the person may receive a more accurate diagnosis and appropriate treatment for their VTE. In this context, VTE represents a symptom rather than a diagnosis per se. So, to what extent should people with an unprovoked VTE be investigated for a potential underlying cancer? It is the value of these additional tests which is the subject of this review.
Description of the intervention
A number of imaging techniques are used in the detection of cancers including computed tomography (CT), positron emission tomography (PET) and ultrasound (US).
CT scans use x‐rays to produce cross‐sectional, three‐dimensional, images of structural changes due to malignancy. An intravenous, iodine agent is used to increase the contrast between the tumour and normal tissue. CT provides a very high spatial resolution but is limited in its ability to accurately distinguish between benign and malignant tissue on the basis of structural information alone, and image interpretation can be difficult where normal anatomy is distorted (Chin 2008).
A PET scan uses low‐dose radiation to measure the activity of cells, producing images that represent the functional rather than anatomical characteristics of disease. 18F‐fluoro‐2‐deoxy‐D‐glucose (FDG) is used as a contrast agent as it is taken up strongly by many aggressive malignant tumours, but weakly by any normal physiological structures of the human body, resulting in an excellent lesion‐to‐background contrast (Buthiau 2003). FDG‐PET imaging alone is limited by a lack of anatomical data so it is combined with CT in a single machine that performs both imaging techniques. Integrated PET/CT images combining the anatomical data of CT with the functional data of PET imaging, can detect lesions smaller than 1 cm which other imaging techniques cannot clearly classify as benign or malignant (Buthiau 2003; Chen 2004; Schöder 2007).
Ultrasound scanning uses high frequency sound waves to build up a picture of internal organs. The sound waves echo differently when bounced off healthy and abnormal tissue. While US can distinguish fluid‐filled cysts from solid tumours, it cannot tell if a tumour is malignant. The images are not as detailed as CT or MRI scan images and it is limited to specific parts of the body as the waves cannot travel through air (the lungs) or bone. US is one of the most common imaging methods used in the diagnosis of tumours in the thyroid, breast, prostate, liver, pancreatic, ovarian, uterine and kidney (Fass 2008).
How the intervention might work
The interventions for detecting an underlying cancer will enable a diagnosis of cancer‐associated VTE to be made. This will enable the person to receive appropriate anticoagulation with LMWH versus vitamin K antagonist, for six versus three months respectively, and for the underlying cancer to be treated promptly without the need for additional symptoms to emerge before it is diagnosed. One study has shown that the combination of tests recommended by NICE detects cancer in approximately 10% of people with a first episode of unprovoked VTE and with no prior cancer diagnosis (Piccioli 2004a). However, tests for cancer also have the potential for harm, from the pain and inconvenience of blood tests to more serious complications due to radiation exposure from X‐rays and CT scans.
Why it is important to do this review
The pharmacological management of VTE in people with and without cancer is considerably different, both in terms of choice of agent and duration of anticoagulation. Therefore, an appropriate cancer diagnosis would ensure that people received the optimal form and duration of anticoagulation, which, in turn, could reduce the overall population VTE recurrence rate and associated morbidity. Establishing whether a person with an apparently unprovoked VTE has an underlying cancer is important since this may lead to cancer diagnosis at an earlier, potentially curative stage, avoiding the risk of cancer progression while waiting for additional symptoms. This may, in turn, lead to improvements in cancer‐related mortality and morbidity. To date, no systematic review has been conducted to measure the effectiveness of testing for cancer in people with an unprovoked VTE. This review provides evidence as to whether such tests for underlying cancer, followed by appropriate alteration in the management or treatment of VTE, or both, are effective in reducing morbidity (VTE recurrence) and mortality (VTE‐ and cancer‐associated). This is the third update of the review first published in 2015.
Objectives
To determine whether testing for undiagnosed cancer in people with a first episode of unprovoked VTE (DVT of the lower limb or PE) is effective in reducing cancer‐ and VTE‐related mortality and morbidity and to determine which tests for cancer are best at identifying treatable cancers early.
The detailed objectives are as follows:
-
to determine whether testing for undiagnosed cancer in people with a first episode of unprovoked VTE (DVT of the lower limb or PE) is effective in reducing cancer mortality and morbidity (cancer morbidity being the need for cancer treatment and effects producing reduced quality of life);
-
to determine whether testing for undiagnosed cancer in people with a first episode of unprovoked VTE (DVT or PE) is effective in reducing VTE‐related mortality and morbidity;
-
to determine which tests for cancer are best at identifying treatable cancers early.
Methods
Criteria for considering studies for this review
Types of studies
We included randomised and quasi‐randomised trials (where a method of allocation was used that was not truly random) in which people with an unprovoked VTE were allocated to receive different tests for cancer or tests as per physician discretion. We looked primarily at randomisation within three months of a VTE, as used in the SOMIT trial (Piccioli 2004a). However, we also included trials where randomisation occurred at different time points as a subgroup analysis. We included published studies and studies in progress if preliminary results were available. Non‐English language studies were also eligible for inclusion in the review.
Types of participants
We included people with a first episode of unprovoked VTE (DVT of the lower limb or PE) with no pre‐existing or clinically apparent cancer diagnosis.
Types of interventions
We included tests for cancer (e.g. complete blood count, serum calcium, liver function test, urinalysis, chest X‐ray, all forms of CT imaging, mammogram, tumour markers, sputum cytology, ultrasonography, positron emission tomography (PET) scan and colonoscopy) versus no tests for cancer or alternative tests, followed by appropriate treatment for cancer or change in VTE treatment regimen, or both. We excluded studies where these tests were routinely used in all groups. We included any study that focused on some other aspect of care than cancer only if the test for cancer was the subject of randomisation.
Types of outcome measures
Primary outcomes
-
All‐cause mortality (death due to any cause).
-
Cancer‐related mortality (defined as death due to a malignant disease itself, or death due to complications of treatments or procedures to diagnose or treat the cancer).
-
VTE‐related mortality (fatal PE). PE diagnosed "on the basis of a lung scan indicating a high probability of its presence, as indicated by the presence of new or enlarged areas of segmental perfusion defects with ventilation‐perfusion mismatch; an abnormal perfusion scan with documentation of new or recurrent DVT; the presence of non‐enhancing filling defects in the central pulmonary vasculature on helical CT; a finding of intraluminal filling defects on pulmonary angiography; or evidence of fresh PE at autopsy" (Lee 2003b). Fatal PE including probable fatal PE and unexplained sudden death were used if reported, as defined by individual studies.
Secondary outcomes
-
VTE‐related morbidity (e.g. frequency of recurrent VTE). Recurrent PE or DVT was diagnosed if a previously compressible proximal venous segment or segments could no longer be compressed on ultrasonography or if there were constant intraluminal filling defects in two or more projections on venography. Unequivocal extension of the thrombus required for the diagnosis of recurrence if the results were abnormal on previous testing (Lee 2003b).
-
Complications of anticoagulation (e.g. warfarin‐ versus LMWH‐associated bleeding). We reported on major bleeding and minor bleeding if reported in the included studies. Major bleeding included bleeding associated with death, bleeding at a critical site (intracranial, intraspinal, intraocular, retroperitoneal or pericardial area), bleeding resulting in a need for a transfusion of at least two units of blood or bleeding leading to a drop in haemoglobin of at least 2.0 g/dL (Lee 2003b). Minor bleeding included any other bleeding.
-
Adverse effects of cancer tests (e.g. radiation exposure, bleeding, as defined in included studies).
-
Characteristics of diagnosed cancer (e.g. primary tumour, stage, localised (curable) versus advanced (palliative) as defined in included studies).
-
Time to cancer diagnosis, as defined in included studies.
-
Frequency of an underlying cancer diagnosis (i.e. the number of times cancer was diagnosed through screening following an unprovoked VTE as defined in included studies) at the time of VTE presentation and overall over the follow‐up period.
-
Participant satisfaction (if assessed in individual studies, we reported results descriptively using the definition provided by the trialists).
-
Quality of life.
Search methods for identification of studies
There were no restrictions on date or language of publication.
Electronic searches
The Cochrane Vascular Information Specialist conducted systematic searches of the following databases for randomised controlled trials and quasi‐randomised trials.
-
The Cochrane Vascular Specialised Register via the Cochrane Register of Studies (CRS‐Web searched on 5 May 2021).
-
The Cochrane Central Register of Controlled Trials (CENTRAL) Cochrane Register of Studies Online (CRSO 2021, Issue 4).
-
MEDLINE (Ovid MEDLINE Epub Ahead of Print, In‐Process & Other Non‐Indexed Citations, Ovid MEDLINE Daily and Ovid MEDLINE) (searched from 11 July 2018 to 5 May 2021).
-
Embase Ovid (searched from 11 July 2018 to 5 May 2021).
-
CINAHL Ebsco (searched from 11 July 2018 to 5 May 2021).
-
AMED Ovid (searched from 11 July 2018 to 5 May 2021).
The Information Specialist modelled search strategies for other databases on the search strategy designed for CENTRAL. Where appropriate, they were combined with adaptations of the highly sensitive search strategy designed by the Cochrane Collaboration for identifying randomised controlled trials and controlled clinical trials (as described in the Cochrane Handbook for Systematic Reviews of Interventions Chapter 6, Lefebvre 2011). Search strategies for major databases are provided in Appendix 1.
The Information Specialist searched the following trials registries on 5 May 2021:
-
The World Health Organization International Clinical Trials Registry Platform (who.int/trialsearch);
-
ClinicalTrials.gov (clinicaltrials.gov).
Searching other resources
We searched the reference lists of relevant articles retrieved by the electronic searches for additional citations.
Data collection and analysis
Selection of studies
Two review authors (LR, CB) independently used the selection criteria to identify trials for inclusion. We resolved any disagreements by discussion.
Data extraction and management
Two review authors (LR, SEY) independently extracted the data and recorded information about the trial design, VTE definition and investigations to confirm diagnosis, baseline characteristics of participants and tests for cancer. All‐cause mortality, cancer‐related mortality and VTE‐related mortality data were recorded as the primary outcome measures. Information on VTE‐related morbidity (e.g. frequency of recurrent VTE), complications of anticoagulation (e.g. warfarin‐ versus LMWH‐associated bleeding), adverse effects of cancer tests (e.g. radiation exposure, bleeding), characteristics of diagnosed cancer (e.g. primary tumour, stage, localised (curable) versus advanced (palliative)), time to cancer diagnosis, frequency of an underlying cancer diagnosis and participant satisfaction was collected in accordance with the secondary outcome measures. Where more than one publication of one study existed, reports were grouped together and the most recent or most complete data set were used. We contacted authors of included studies for further information if clarification was required. We resolved any disagreements in data extraction and management by discussion.
Assessment of risk of bias in included studies
Two review authors (LR, SEY) independently used the Cochrane tool to assess the risk of bias for each of the included studies (Higgins 2011). The tool provides a protocol for judgements on sequence generation, allocation methods, blinding, incomplete outcome data, selective outcome reporting and any other relevant biases. We judged each of these domains at high, low or unclear risk of bias according to Higgins 2011 and provided support for each judgement. The conclusions are presented in a 'Risk of bias' table. Any disagreements were resolved by discussion.
Measures of treatment effect
We planned to base the analysis on intention‐to‐treat data from the individual clinical trials. The majority of outcomes were binary measures (mortality, morbidity, complications, adverse effects, characteristics of diagnosed cancer, frequency of an underlying cancer diagnosis). For these outcomes, we computed odds ratios (ORs) using a random‐effects model and calculated the 95% CI of the effect sizes. For time to cancer diagnosis, we aimed to compute hazard ratios (HR), while for participant satisfaction, we planned to report results descriptively (Deeks 2011).
Unit of analysis issues
The unit of analysis within each trial was the individual participant.
Dealing with missing data
We sought information about dropouts, withdrawals and other missing data and, if not reported, we contacted the study authors.
Assessment of heterogeneity
We assessed heterogeneity between the pooled studies by visual examination of the forest plot to check for overlapping CIs, and used the Chi2 test for homogeneity with a 10% level of significance. We used the I2 statistic to measure the degree of inconsistency between the studies. An I2 result of over 50% may represent moderate to substantial heterogeneity (Deeks 2011).
Assessment of reporting biases
We planned to assess reporting biases such as publication bias using funnel plots when there were more than 10 studies in the meta‐analyses (Sterne 2011). However, as there were only four studies in the review it was not possible to test for funnel plot asymmetry.
Data synthesis
The review authors independently extracted the data. One review author (LR) entered the data into Review Manager 5 (RevMan 2014). A second review author (SEY) cross‐checked data entry and resolved any discrepancies by consulting the source publication.
We used a random‐effects model for meta‐analysis of the data. We planned to stratify analyses according to the individual cancer test being assessed and the combination of tests as used in the SOMIT trial (Piccioli 2004a).
Subgroup analysis and investigation of heterogeneity
Where possible, we planned to analyse clinically relevant subgroups based on the following:
-
DVT or PE at time of randomisation;
-
cancer site;
-
treatment post‐investigation with vitamin K antagonist or LMWH;
-
duration of anticoagulation (e.g. three or six months);
-
age and gender of participants (comparing those in age and gender groups for national screening programmes to those not in these age and gender groups);
-
time of randomisation after VTE diagnosis (within three months compared with after three months).
However, due to lack of data in the studies, it was not possible to perform subgroup analysis.
Sensitivity analysis
We planned to conduct a sensitivity analysis by excluding studies at high risk of bias to measure the effect on the results. We were not able to carry out sensitivity analysis due to the limited number of studies in each comparison.
Summary of findings and assessment of the certainty of the evidence
We presented the main findings of the review results concerning the certainty of evidence, the magnitude of effect of the interventions examined and the sum of available data for all outcomes of this review (Types of outcome measures) in a Summary of findings table, according to the GRADE principles as described by Higgins 2011 and Atkins 2004. We calculated assumed control intervention risks from the mean number of events in the control groups of the selected studies for each outcome. We used the GRADEprofiler (GRADEpro) software to assist in the preparation of the Summary of findings table.
Results
Description of studies
Results of the search
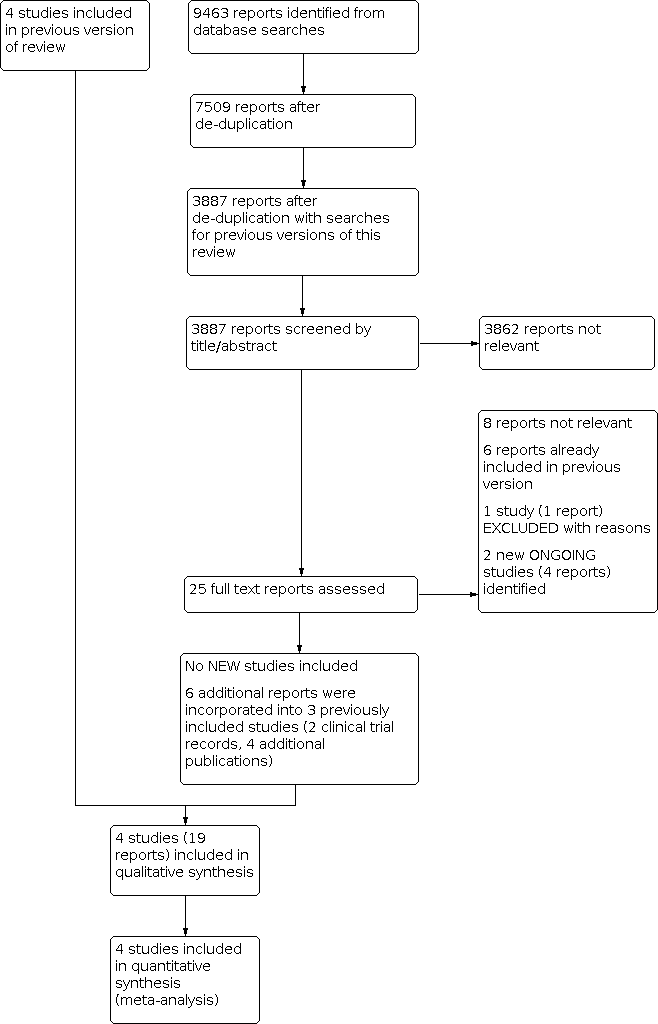
No new studies were identified for inclusion in this 2021 update. See Figure 1.

Study flow diagram.
We identified four additional reports relating to the previously included study Robin 2016 (Robin 2017a; Robin 2017b; Robin 2018; Robin 2020); and one additional report each for Carrier 2015 (NCT00773448) and Prandoni 2016 (NCT00361647). One new study was assessed as excluded (Kraaijpoel 2018). We identified two new ongoing studies (EUCTR2018‐003958‐25‐ES; EUCTR2020‐002210‐41‐FR).
Included studies
Four studies fulfilled the eligibility criteria for inclusion in this review (Carrier 2015; Piccioli 2004b; Prandoni 2016; Robin 2016).
See Characteristics of included studies table.
The first study was a randomised multicentre study of 201 apparently cancer‐free people with acute unprovoked VTE (Piccioli 2004b). Extensive investigations for occult malignant disease were compared with testing at the physician's discretion. Ninety‐nine participants were randomised to the extensive screening group and 102 were randomised to the control group. Participants in the extensive investigations group were offered ultrasound and CT scans of the abdomen and pelvis, double contrast barium swallowing, colonoscopy or sigmoidoscopy followed by a barium enema, haemoccult test, sputum cytology and tumour markers including carcinoembryonic antigen (CEA), alpha‐fetoprotein (α‐FP) and CA125. Women also underwent mammography and Papanicolaou (Pap) smears while men had transabdominal ultrasound of the prostate and a total prostate‐specific antigen (PSA) test. All tests were completed within a four‐week period from the diagnosis of VTE. Participants in the control group were investigated at the physician's discretion. If the investigations suggested the presence of a malignant process, further investigations were performed according to current standards. Participants were followed up at 3, 12 and 24 months following the diagnosis of VTE. The primary outcome was cancer‐related morbidity, defined as death due to a malignant disease itself, or death due to complications of diagnostic or surgical procedures performed to diagnose or treat cancer. A secondary outcome of this study consisted of the cluster of cancer‐related mortality and documented residual malignancy or recurrent malignancy at 24 months. The authors also measured the frequency of an underlying cancer diagnosis including type and stage as well as mean time to cancer diagnosis.
The second study was a randomised study in which 195 participants with a first episode of unprovoked VTE were randomised to extensive investigations (98 participants) or a discretionary diagnostic approach excluding CT scans (97 participants) (Prandoni 2016). Extensive investigations comprised a mandatory CT scan of the thorax, abdomen and pelvis together with faecal haemoccult testing or any test at physician's discretion according to good clinical practice. Participants allocated to the discretionary diagnostic approach or personalised strategy underwent additional testing based on physicians' judgements and participants' preferences, including a 'no‐further testing' option. Participants were followed at 3, 6, 12 and 24 months to document the incidence of newly discovered cancer and cancer‐related mortality. The primary outcomes were cancer‐related mortality (defined as death due to malignancy, or death due to the complications of the diagnostic or surgical procedures performed to diagnose or treat cancer) and incidence of newly discovered cancer. The secondary outcomes were cancer stage, using the tumours‐nodes‐metastases classification, at which tumours were diagnosed in the two study groups and the incidence of cancer‐related mortality in the two randomisation groups,
The third study was an open‐label randomised study in which 854 participants with a first episode of unprovoked VTE were randomised to limited occult‐cancer screening plus CT scanning of the abdomen and pelvis (423 participants) or limited occult‐cancer screening alone (431 participants) (Carrier 2015). The limited occult‐cancer screening comprised complete history and physical examination, measurement of complete blood counts and serum electrolyte and creatinine levels, liver‐function testing and chest radiography. Sex‐specific screening was conducted if it had not been performed in the previous year. A breast examination, mammography, or both were performed in women over 50 years of age and Pap testing and a pelvic examination were performed in women 18 to 70 years of age who had ever been sexually active. A prostate examination, PSA test, or both were performed in men over 40 years of age. The additional CT investigations comprised a virtual colonoscopy and gastroscopy, biphasic enhanced CT of the liver, parenchymal pancreatography and uniphasic enhanced CT of the distended bladder. Participants were followed up for one year to document the incidence of newly diagnosed cancer, type of cancer diagnosed, one‐year cancer‐related mortality, one‐year overall mortality, time to cancer diagnosis and incidence of recurrent VTE.
The fourth study was an open‐label randomised study in which 394 participants with a first episode of unprovoked VTE were randomised to a limited screening strategy (197 participants) or a screening strategy consisting of the limited strategy plus an 18‐fluorodeoxyglucose (18F‐FDG) PET/CT scan of the chest, abdomen and pelvis (197 participants) (Robin 2016). The limited screening comprised medical history taking, physical examination, routine laboratory tests (including complete blood count, erythrocyte sedimentation rate or C‐reactive protein, aminotransferases, alkaline phosphatase and calcium), chest radiograph, and recommended age‐specific and sex‐specific cancer screening tests (i.e. PSA in men older than 50 years, mammography in women older than 50 years and Pap smear in all women). Participants were followed up for two years to determine the proportion of people with a cancer diagnosis in each group after the initial screening assessment.
Excluded studies
We identified one new excluded study (Kraaijpoel 2018). See Characteristics of excluded studies.
Studies that were not randomised controlled trials were deemed not relevant and therefore not listed as an excluded study.
Ongoing studies
We identified two new ongoing studies (EUCTR2018‐003958‐25‐ES; EUCTR2020‐002210‐41‐FR). See Characteristics of ongoing studies.
Risk of bias in included studies

Risk of bias graph: review authors' judgements about each risk of bias item presented as percentages across all included studies.

Risk of bias summary: review authors' judgements about each risk of bias item for each included study.
Allocation
All four studies were randomised. Prandoni 2016 used envelopes. Piccioli 2004b used a Zelen approach (participants are randomised to either the treatment or control group before giving informed consent), Carrier 2015 used random number tables and Robin 2016 used a computer random number generator. Therefore, these four studies were judged at low risk of selection bias. In terms of concealing the allocation of treatment, Piccioli 2004b performed randomisation centrally and Carrier 2015 and Robin 2016 used a central web‐based randomisation system and, therefore, these three were judged at low risk of selection bias. The Prandoni 2016 study used serially numbered, opaque, sealed envelopes to conceal allocation and was, therefore, judged at low risk of selection bias too.
Blinding
As the study groups in all four trials were randomised to extensive screening or no further testing, it was impossible to blind participants and study personnel. However, we believe it was unlikely that the lack of blinding would have affected the outcome and, therefore, all studies were judged at low risk of performance bias.
In Piccioli 2004b, the physician at the follow‐up examination was unaware of the allocation of participants and, therefore, detection bias for outcome assessors was low. Similarly, for Carrier 2015 a blinded adjudication committee reviewed all suspected outcome events and, therefore, the risk of detection bias was low. Robin 2016 did not blind outcome assessors to treatment allocation and was, therefore, judged at high risk of detection bias. In Prandoni 2016, investigators performing the follow‐up visits were blinded to the participants' randomisation group and the study was, therefore, judged at low risk of detection bias.
Incomplete outcome data
The treatment groups in all four studies were well‐balanced with respect to baseline characteristics, completion of the study protocol and discontinuation of treatment. Furthermore, all missing data were accounted for and reported. Therefore, all four studies were judged at low risk of attrition bias (Carrier 2015; Piccioli 2004b; Prandoni 2016; Robin 2016).
Selective reporting
All four studies clearly prespecified all primary and secondary outcomes and data on all outcomes were reported (low risk of reporting bias) (Carrier 2015; Piccioli 2004b; Prandoni 2016; Robin 2016).
Other potential sources of bias
Two studies were deemed at low risk (Carrier 2015; Robin 2016), and two studies were deemed to be at high risk of other bias (Piccioli 2004b; Prandoni 2016). The study by Piccioli 2004b was terminated early after the inclusion of only 201 participants after five years for several reasons. First, only five of the more than 40 potential participating centres could contribute participants to the study. Second, some medical ethics committees rejected the protocol because of the absence of screening for occult cancer in the control group, other centres could not start because the proposed extensive screening was judged to be unethical. Finally, the identification of cancer at an apparent early stage in the extensive screening group led to an increasing tendency among physicians in the participating hospitals to initiate screening for cancer in the control participants. The study by Prandoni 2016 was judged at high risk of bias as results of an interim analysis, scheduled after the inclusion of approximately half of the planned sample size, showed no appreciable advantage of the CT‐based strategy over the control strategy for detection of occult cancers. In addition, there was a low recruitment rate, so the study promoters decided to terminate the study early.
Effects of interventions
See: Summary of findings 1 Extensive tests versus tests at the physician's discretion; Summary of findings 2 Standard testing plus PET/CT scanning versus standard testing alone
Extensive tests versus tests at the physician's discretion
Two studies assessed the effect of testing for cancer versus clinically indicated tests only (Piccioli 2004b; Prandoni 2016).
Both studies measured the primary outcome cancer‐related mortality. In Piccioli 2004b, 2/99 participants in the extensive testing group died of cancer compared to 4/102 in the group who underwent tests at the physician's discretion (OR 0.51, 95% CI 0.09 to 2.82). In Prandoni 2016, 2/98 participants who underwent extensive testing and 4/97 participants who underwent tests at the physician's discretion died of cancer (OR 0.48, 95% CI 0.09 to 2.71). Meta‐analysis showed an OR of 0.49 (95% CI 0.15 to 1.67; low‐certainty evidence) in favour of extensive testing, which did not reach statistical significance (P = 0.26) (Analysis 1.1).
However, neither Piccioli 2004b nor Prandoni 2016 measured the review's other primary outcomes of all‐cause mortality and VTE‐related mortality, or the secondary outcomes VTE‐related morbidity, complications of anticoagulation, adverse effects of cancer tests, participant satisfaction and quality of life.
Piccioli 2004b looked at the location of the malignancy and found no clear difference in the incidence of any particular cancer between participants who underwent extensive tests and participants who were tested at the physician's discretion (lung: OR 2.08, 95% CI 0.19 to 23.34; bladder: OR 2.08, 95% CI 0.19 to 23.34; stomach: OR 1.03, 95% CI 0.06 to 16.71; kidney: OR 3.12, 95% CI 0.13 to 77.55; adrenal gland: OR 3.12, 95% CI 0.13 to 77.55; liver: OR 3.12, 95% CI 0.13 to 77.55; uterus: OR 3.12, 95% CI 0.13 to 77.55; breast: OR 1.03, 95% CI 0.06 to 16.71; ovary: OR 3.12, 95% CI 0.13 to 77.55; colon: OR 0.51, 95% CI 0.05 to 5.72; prostate: OR 0.51, 95% CI 0.05 to 5.72; pancreas: OR 0.20, 95% CI 0.01 to 4.26) (Analysis 1.2).
Piccioli 2004b compared the characteristics of the diagnosed cancer by assessing the proportion of early‐stage malignancies, defined as T1 or T2 without locoregional or distant metastases (N0 M0). Overall, malignancies were less advanced in participants who had undergone extensive testing. In total, 9/13 participants diagnosed with cancer in the tested group had a T1‐ or T2‐stage malignancy without locoregional or distant metastases compared to 2/10 participants diagnosed with cancer in the control group (OR 5.00, 95% CI 1.05 to 23.76; P = 0.04; low‐certainty evidence). There was no difference in detection of advanced stages between groups: one participant in the tested group had stage T3 compared with four participants in the control group (OR 0.25, 95% CI 0.03 to 2.28; P = 0.22; low‐certainty evidence) (Analysis 1.3).
One study measured time to cancer diagnosis (measured from the time of diagnosis of VTE) (Piccioli 2004b), reported as a mean of one month in tested participants compared to 11.6 months in participants who were tested at the physician's discretion (P < 0.001). Standard deviations for the means were not given. We attempted to contact the author for these data but received no response.
Both studies measured the frequency of an underlying cancer diagnosis. Piccioli 2004b detected underlying cancer in 13/99 participants who underwent extensive testing, whereas it became symptomatic in 10/102 control participants (OR 1.39, 95% CI 0.58 to 3.34). Prandoni 2016 detected cancer in 2/98 participants who had further tests and it became apparent in 2/97 participants who were tested at the physician's discretion (OR 0.99, 95% CI 0.14 to 7.17). The combined incidence of an underlying cancer diagnosis was 15/197 in the tested group and 12/199 in the control group (OR 1.32, 95% CI 0.59 to 2.93; low‐certainty evidence) (Analysis 1.4). Therefore, after 24 months of follow‐up, the incidence of cancer was no different in the tested and control groups.
Standard testing plus PET/CT scanning versus standard testing alone
Two studies assessed the effect of standard testing plus PET/CT scanning versus standard testing alone (Carrier 2015; Robin 2016).
Both studies measured the primary outcome all‐cause mortality. In the standard testing plus CT scanning group, 11/620 participants died during follow‐up compared to 9/628 participants who received standard testing alone (OR 1.22, 95% CI 0.49 to 3.04; moderate‐certainty evidence) (Analysis 2.1).
Carrier 2015 and Robin 2016 also measured cancer‐related mortality and reported an incidence of 6/620 participants with standard testing plus CT scanning compared to 11/628 participants who received standard testing alone (OR 0.55, 95% CI 0.20 to 1.52; moderate‐certainty evidence) (Analysis 2.2).
The study by Carrier 2015 measured VTE‐related morbidity. The incidence of recurrent VTE was 14/423 participants who underwent standard testing plus CT scanning compared to 14/431 participants who had standard testing alone (OR 1.02, 95% CI 0.48 to 2.17; moderate‐certainty evidence) (Analysis 2.3).
Carrier 2015 and Robin 2016 also looked at the location of the malignancy and found no clear difference in the incidence of any particular cancer between the two groups (acute leukaemia: OR 1.62, 95% CI 0.20 to 13.22; gynaecological: OR 2.39, 95% CI 0.43 to 13.36; melanoma: OR 1.02, 95% CI 0.06 to 16.34; colorectal: OR 0.43, 95% CI 0.08 to 2.40; prostate: OR 2.52, 95% CI 0.48 to 13.12; pancreatic: OR 4.81, 95% CI 0.55 to 42.48; cholangiocarcinoma: OR 0.51, 95% CI 0.05 to 5.63; lymphoma: OR 0.74, 95% CI 0.09 to 5.83; breast: OR 0.20, 95% CI 0.01 to 4.24; urological: OR 0.62, 95% CI 0.03 to 12.32; liver: OR 0.33, 95% CI 0.01 to 8.19; head and neck: OR 3.02, 95% CI 0.12 to 74.47; lung: OR 3.02, 95% CI 0.12 to 74.47; unknown primary origin: OR 0.34, 95% CI 0.01 to 8.34) (Analysis 2.4).
Robin 2016 also measured the stage of cancer. Early‐stage cancer was detected in 7/197 participants who underwent standard testing plus CT scanning compared to 4/197 participants who underwent standard testing alone (OR 1.78, 95% CI 0.51 to 6.17; low‐certainty evidence), while advanced‐stage cancer was detected in two participants in each group (OR 1.00, 95% CI 0.14 to 7.17; low‐certainty evidence) (Analysis 2.5).
Time to cancer diagnosis was 4.0 months in the standard testing plus PET/CT group and 4.2 months in the standard testing group in one study (P = 0.88) (Carrier 2015). However, standard deviations for these means were not given. We attempted to contact the author for these data but received no response. Robin 2016 did not measure time to cancer diagnosis.
Carrier 2015 and Robin 2016 measured the frequency of underlying cancer diagnosis. Underlying cancer was detected in 30/620 participants who underwent standard testing plus CT scanning compared to 18/628 participants who underwent standard testing alone (OR 1.71, 95% CI 0.91 to 3.20; moderate‐certainty evidence) (Analysis 2.6).
The studies by Carrier 2015 and Robin 2016 did not measure the other review outcomes of VTE‐related mortality, complications of anticoagulation, adverse effects of cancer tests, participant satisfaction or quality of life.
Discussion
Summary of main results
Four studies fulfilled the eligibility criteria for inclusion in this review (Carrier 2015; Piccioli 2004b; Prandoni 2016; Robin 2016). In total, 1644 participants were studied. We found no studies that were potentially eligible but then excluded.
Extensive tests versus tests at the physician's discretion
Two studies compared the effectiveness of testing for cancer on cancer‐related mortality in people with a first unprovoked VTE (Piccioli 2004b; Prandoni 2016). Piccioli 2004b performed an extensive list of tests while Prandoni 2016 carried out fewer tests. Pooled analysis showed that testing for cancer was consistent with either a benefit or no benefit on cancer‐related mortality. Testing did not increase the frequency of an underlying cancer diagnosis. However, the time to cancer diagnosis was shorter in tested participants (mean: one month with extensive tests versus 11 months with tests at the physician's discretion). Furthermore, more people had a detection of early‐stage cancer with extensive tests compared to people who were tested at the physician's discretion (Piccioli 2004b). However, standard deviations for the mean time to diagnosis were not reported and, therefore, it was impossible to independently test the statistical significance of this result. Neither study measured all‐cause mortality, VTE‐related morbidity and mortality, adverse effects of anticoagulation, adverse effects of cancer tests, participant satisfaction or quality of life.
Standard testing plus PET/CT scanning versus standard testing alone
Two studies compared limited screening plus PET/CT scanning of the abdomen and pelvis with limited screening alone in people with a first unprovoked VTE (Carrier 2015; Robin 2016). Standard testing plus PET/CT scanning was consistent with either a benefit or no benefit on all‐cause mortality, cancer‐related mortality and VTE‐related morbidity. Extensive testing did not increase the frequency of an underlying cancer diagnosis. Furthermore, there was no clear difference in the incidence of particular types of cancer or the stage of cancer between the extensive and standard testing groups. One study measured time to cancer diagnosis but standard deviations for the mean time to diagnosis were not reported and, therefore, it was impossible to independently test the statistical significance of this result (Carrier 2015). Carrier 2015 and Robin 2016 did not measure VTE‐related mortality, adverse effects of anticoagulation, adverse effects of cancer tests, participant satisfaction or quality of life.
A follow‐up publication to Robin 2016 assessed the cost‐effectiveness of screening plus PET/CT in comparison with limited screening from the publicly‐funded health care systems perspective (Ontario, Canada and France; Robin 2018). This post‐hoc analysis found that the addition of PET/CT scan to screening for occult cancer diagnosis is more expensive than standard screening (screening and follow‐up total cost per patient (SD): Ontario health system screening plus PET/CT CAD 1324.08 (236.89) versus standard screening CAD 211.75 (315.51); French health system screening plus PET/CT EUR 817.52 (111.43) versus standard screening EUR 96.89 (187.81)). Compared to standard screening, the incremental cost per quality‐adjusted life year (QALY) gained was CAD 3412.85 (95% CI 1463.89 to 13,935.88) from the Ontario health system perspective, and EUR 2162.83 (95% CI 958.78 to 10,544.42) from the French health system perspective (Robin 2018).
Overall completeness and applicability of evidence
At present, there is limited evidence concerning whether testing for undiagnosed cancer in people with a first episode of unprovoked VTE (DVT or PE) is effective in reducing cancer‐ and VTE‐related mortality and morbidity and which tests for cancer are most useful. Only four studies met the inclusion criteria for this review (Carrier 2015; Piccioli 2004b; Prandoni 2016; Robin 2016). While the losses to follow‐up were equally balanced within each study, the number of participants in each study was relatively small and pooled analysis is based on 1644 participants. Furthermore, the four studies primarily looked at cancer‐related mortality and incidence of cancer diagnosis as their main outcomes. Other outcomes of interest for this review, such as VTE‐related mortality, adverse effects of anticoagulation, adverse effects of cancer tests and quality of life, were not studied and, therefore, remain unknown.
Quality of the evidence
One study included in the review was judged at low risk of bias (Carrier 2015). Piccioli 2004b was judged at high risk of bias as the study was terminated early for several reasons. First, only five of the more than 40 potential participating centres could contribute participants to the study. Second, some medical ethics committees rejected the protocol because of the absence of screening for occult cancer in the control group, other centres could not start because the proposed extensive screening was judged to be unethical. Finally, the identification of cancer at an apparent early stage in the extensive screening group led to an increasing tendency among physicians in the participating hospitals to initiate screening for cancer in the control participants. Prandoni 2016 was judged at low risk for all domains except other bias, where the risk was deemed to be high as, based on an interim analysis, the study was terminated early because of the low recruitment rate and of the failure to show an appreciable advantage of the CT‐based strategy over the control strategy for detection of cancers. Robin 2016 was judged at low risk for all domains except detection bias, where the risk was deemed high due to lack of blinding of outcome assessors.
For the comparison extensive tests for cancer versus tests at the physician's discretion, the certainty of the evidence for cancer‐related mortality and frequency of an underlying cancer diagnosis was downgraded to low as there was a high risk of bias in both studies due to them both being terminated early. However, the outcome was direct and effect estimates were consistent and precise, as reflected in the narrow CIs around the ORs (summary of findings Table 1). The certainty of evidence for type of cancer are presented in a Summary of findings table (Appendix 2). For type of cancer, the evidence was downgraded to low certainty as there was imprecision due to low number of events combined with the study being terminated early.
For the comparison standard testing plus PET/CT scanning versus standard testing alone, the certainty of the evidence was graded as moderate for all‐cause mortality and cancer‐related mortality due to the high risk of detection bias in Robin 2016. For VTE‐related morbidity, the certainty of the evidence was downgraded to moderate as only one study measured this outcome. For stage of cancer, the evidence was downgraded to low as there was imprecision due to low number of events and there was a high risk of detection bias (summary of findings Table 2). The certainty of evidence for type of cancer are presented in a summary of findings table in Appendix 3. For type of cancer, the evidence was judged to be moderate if there was imprecision due to low number of events or where the study was at high risk of detection bias. Where both imprecision and detection bias occurred together, the certainty of the evidence was downgraded to low.
Potential biases in the review process
None of the authors of this review were involved in any of the included or excluded studies. Furthermore, none have any commercial or other conflicts of interest. The search was as comprehensive as possible, and all studies were independently assessed for inclusion by two review authors. We are confident that we have included all relevant studies and we have attempted to reduce bias in the review process by performing data extraction and assessing study quality independently. However, the possibility remains that we may have missed studies that have not been published.
We judged blinding of investigators and participants to be at low risk of bias. It would have been impossible to blind participants and staff to tests such as scans. Therefore, there is a risk of cross‐over bias in participants in the control group with them having further tests. However, the effect of this would be to minimise the apparent benefit from testing that was observed, and, therefore, this does not detract from the conclusions of the study or review.
In this review, we presented the studies by Piccioli 2004b and Prandoni 2016 together as both studies compared extensive tests for cancer versus "tests at the physicians discretion". The studies by Carrier 2015 and Robin 2016 were reported in a separate analysis as both studies compared limited screening plus PET/CT scanning versus limited screening alone. Combining all four studies in a meta‐analysis would have been problematic due to the different definitions of the comparator groups. However, the control group of the Carrier 2015 and Robin 2016 studies included some of the tests in the test group of the studies by Piccioli 2004b and Prandoni 2016, which may account for why there was no clear difference observed, along with participation of all people in breast and colorectal cancer screening programmes. This may also be the reason for the very low incidence of cancer in the studies by Carrier 2015 and Robin 2016 compared to the studies by Piccioli 2004b and Prandoni 2016.
Agreements and disagreements with other studies or reviews
To date, three other systematic reviews have assessed the effectiveness of testing for cancer on cancer‐related mortality in people with an unprovoked VTE. van Es 2017 conducted a systematic review and meta‐analysis of individual patient data from ten prospective studies. Only two of these were randomised controlled trials, both of which were also included in our meta‐analysis (Carrier 2015; Robin 2016). The primary outcome was prevalence of occult cancer in patients with an unprovoked VTE. The prevalence of cancer 12 months after VTE diagnosis was 5.2% (95% CI 4.1% to 6.5%). The prevalence of cancer was higher in patients who had extensive testing than in those who had more limited testing initially (OR 2.0, 95% CI 1.2 to 3.4) but not at 12 months (OR 1.4 95% CI 0.89 to 2.1). Furthermore, the prevalence of cancer increased with age, and was seven‐fold higher in patients aged 50 years or older, than in younger patients (OR 7.1, 95% CI 3.1 to 16.0). Systematic reviews by Klein 2017 and Zhou 2017 evaluated the efficacy of an extensive testing strategy for occult malignant diseases in patients with unprovoked VTE. Both reviews included five studies; the same four studies included in our review (Carrier 2015; Piccioli 2004b; Prandoni 2016; Robin 2016) and a fifth study which was a prospective cohort study (van Doormaal 2011). This did not meet the inclusion criteria for our review as we considered randomised controlled trials only. Neither review demonstrated a significant difference between extensive and limited testing for all‐cause mortality (with risk ratios (RR) of 0.86, 95% CI 0.58 to 1.27 and RR 0.86, 95% CI, 0.58 to1.27 for Klein 2017 and Zhou 2017, respectively), nor cancer‐related mortality (RR 0.93, 95% CI 0.54 to 1.58 and RR 0.86, 95% CI, 0.46 to 1.62 for Klein 2017 and Zhou 2017, respectively). Zhou 2017 found no significant difference between the extensive and limited testing groups with regard to risk of missed cancer diagnosis (RR 0.51, 95% CI 0.20 to 1.28). However, Klein 2017 determined that extensive testing yielded more diagnoses of cancer (RR 2.17, 95% CI 1.42 to 3.32). A more recent narrative review reported similar findings to this Cochrane Review as well as highlighting ongoing studies involving high‐risk patients (D'Astous 2020). These ongoing studies were identified in our searches and will be included in future updates of this Cochrane Review. D'Astous 2020 also mentioned that other means of occult cancer detection, such as biomarkers, are being investigated. Biomarkers may allow more targeted screening, and platelet RNA profiling is currently being evaluated in a prospective cohort study to detect occult cancer in patients with unprovoked VTE (NCT02739867).
Study flow diagram.

Risk of bias graph: review authors' judgements about each risk of bias item presented as percentages across all included studies.

Risk of bias summary: review authors' judgements about each risk of bias item for each included study.

Comparison 1: Extensive tests versus tests at the physician's discretion, Outcome 1: Cancer‐related mortality

Comparison 1: Extensive tests versus tests at the physician's discretion, Outcome 2: Characteristics of diagnosed cancer: type of cancer

Comparison 1: Extensive tests versus tests at the physician's discretion, Outcome 3: Characteristics of diagnosed cancer: stage of cancer

Comparison 1: Extensive tests versus tests at the physician's discretion, Outcome 4: Frequency of underlying cancer diagnosis

Comparison 2: Standard testing plus PET/CT scanning versus standard testing alone, Outcome 1: All‐cause mortality

Comparison 2: Standard testing plus PET/CT scanning versus standard testing alone, Outcome 2: Cancer‐related mortality

Comparison 2: Standard testing plus PET/CT scanning versus standard testing alone, Outcome 3: Venous thromboembolism‐related morbidity

Comparison 2: Standard testing plus PET/CT scanning versus standard testing alone, Outcome 4: Characteristics of diagnosed cancer: type of cancer

Comparison 2: Standard testing plus PET/CT scanning versus standard testing alone, Outcome 5: Characteristics of diagnosed cancer: stage of cancer

Comparison 2: Standard testing plus PET/CT scanning versus standard testing alone, Outcome 6: Frequency of an underlying cancer diagnosis
| Extensive tests versus tests at the physician's discretion | ||||||
| Patient or population: people with unprovoked VTE Setting: hospital Intervention: extensive tests Comparison: tests at the physician's discretion | ||||||
| Outcomes | Anticipated absolute effects* (95% CI) | Relative effect | No of participants | Certainty of the evidence | Comments | |
|---|---|---|---|---|---|---|
| Risk with tests at physician's discretion | Risk with extensive tests | |||||
| All‐cause mortality1 | See comment | See comment | See comment | See comment | See comment | No study measured this outcome. |
| Cancer‐related mortality2 | Study population | OR 0.49 | 396 | ⊕⊕⊝⊝ | ‐ | |
| 40 per 1000 | 20 per 1000 | |||||
| VTE‐related mortality4 | See comment | See comment | See comment | See comment | See comment | No study measured this outcome. |
| VTE‐related morbidity5 | See comment | See comment | See comment | See comment | See comment | No study measured this outcome. |
| Stage of cancer ‐ early6 | Study population | OR 5.00 | 201 (1 RCT) | ⊕⊕⊝⊝ | ‐ | |
| 20 per 1000 | 91 per 1000 | |||||
| Stage of cancer ‐ advanced8 | Study population | OR 0.25 | 201 | ⊕⊕⊝⊝ | ‐ | |
| 39 per 1000 | 10 per 1000 | |||||
| Time to cancer diagnosis9 | See comments | See comments | See comments | 201 (1 RCT) | See comments | Time to cancer diagnosis (measured from time of diagnosis of VTE) measured in 1 study (Piccioli 2004b), and reported as a mean of 1 month with extensive tests compared to 11.6 months with tests at physician's discretion (P < 0.001). Standard deviations for these means not given. Attempts to contact author for these data made but no response received. |
| Frequency of underlying cancer diagnosis10 | 60 per 1000 | 78 per 1000 | OR 1.32 | 396 | ⊕⊕⊝⊝ | ‐ |
| *The risk in the intervention group (and its 95% confidence interval) is based on the assumed risk in the comparison group and the relative effect of the intervention (and its 95% CI). CI: confidence interval; OR: odds ratio; RCT: randomised controlled trial; VTE: venous thromboembolism. | ||||||
| GRADE Working Group grades of evidence | ||||||
| 1 Death due to any cause. | ||||||
| Standard testing plus PET/CT scanning versus standard testing alone | ||||||
| Patient or population: people with unprovoked VTE Setting: hospital Intervention: standard testing + PET/CT scanning Comparison: standard testing alone | ||||||
| Outcomes | Anticipated absolute effects* (95% CI) | Relative effect | No of participants | Certainty of the evidence | Comments | |
|---|---|---|---|---|---|---|
| Risk with standard testing alone | Risk with standard testing + PET/CT scanning | |||||
| All‐cause mortality1 | Study population | OR 1.22 | 1248 | ⊕⊕⊕⊝ | ‐ | |
| 14 per 1000 | 17 per 1000 | |||||
| Cancer‐related mortality3 | Study population | OR 0.55 | 1248 | ⊕⊕⊕⊝ | ‐ | |
| 18 per 1000 | 10 per 1000 | |||||
| VTE‐related mortality4 | See comment | See comment | See comment | See comment | See comment | No study measured this outcome. |
| VTE‐related morbidity5 | Study population | OR 1.02 | 854 | ⊕⊕⊕⊝ | ‐ | |
| 32 per 1000 | 33 per 1000 | |||||
| Stage of cancer ‐ early | Study population | OR 1.78 | 394 | ⊕⊕⊝⊝ | ‐ | |
| 20 per 1000 | 36 per 1000 | |||||
| Stage of cancer ‐ advanced | Study population | OR 1.00 | 394 | ⊕⊕⊝⊝ | ‐ | |
| 10 per 1000 | 10 per 1000 | |||||
| Time to cancer diagnosis7 | See comments | See comments | See comments | 854 (1 RCT) | See comments | Time to cancer diagnosis measured in Carrier 2015 as 4.2 months in standard testing group and 4.0 months in standard testing + PET/CT group (P = 0.88). However, standard deviations for these means not given. Attempts made to contact author for these data but no response received. |
| Frequency of an underlying cancer diagnosis8 | Study population | OR 1.71 | 1248 | ⊕⊕⊕⊝ | ‐ | |
| 29 per 1000 | 48 per 1000 | |||||
| *The risk in the intervention group (and its 95% confidence interval) is based on the assumed risk in the comparison group and the relative effect of the intervention (and its 95% CI). CI: confidence interval; OR: odds ratio; PET/CT: positron emission tomography/computed tomography; RCT: randomised controlled trial; VTE: venous thromboembolism. | ||||||
| GRADE Working Group grades of evidence | ||||||
| 1 Death due to any cause. | ||||||
| Outcome or subgroup title | No. of studies | No. of participants | Statistical method | Effect size |
| 1.1 Cancer‐related mortality Show forest plot | 2 | 396 | Odds Ratio (M‐H, Random, 95% CI) | 0.49 [0.15, 1.67] |
| 1.2 Characteristics of diagnosed cancer: type of cancer Show forest plot | 1 | Odds Ratio (M‐H, Random, 95% CI) | Subtotals only | |
| 1.2.1 Lung | 1 | 201 | Odds Ratio (M‐H, Random, 95% CI) | 2.08 [0.19, 23.34] |
| 1.2.2 Bladder | 1 | 201 | Odds Ratio (M‐H, Random, 95% CI) | 2.08 [0.19, 23.34] |
| 1.2.3 Stomach | 1 | 201 | Odds Ratio (M‐H, Random, 95% CI) | 1.03 [0.06, 16.71] |
| 1.2.4 Kidney | 1 | 201 | Odds Ratio (M‐H, Random, 95% CI) | 3.12 [0.13, 77.55] |
| 1.2.5 Adrenal gland | 1 | 201 | Odds Ratio (M‐H, Random, 95% CI) | 3.12 [0.13, 77.55] |
| 1.2.6 Liver | 1 | 201 | Odds Ratio (M‐H, Random, 95% CI) | 3.12 [0.13, 77.55] |
| 1.2.7 Uterus | 1 | 201 | Odds Ratio (M‐H, Random, 95% CI) | 3.12 [0.13, 77.55] |
| 1.2.8 Breast | 1 | 201 | Odds Ratio (M‐H, Random, 95% CI) | 1.03 [0.06, 16.71] |
| 1.2.9 Ovary | 1 | 201 | Odds Ratio (M‐H, Random, 95% CI) | 3.12 [0.13, 77.55] |
| 1.2.10 Colon | 1 | 201 | Odds Ratio (M‐H, Random, 95% CI) | 0.51 [0.05, 5.72] |
| 1.2.11 Prostate | 1 | 201 | Odds Ratio (M‐H, Random, 95% CI) | 0.51 [0.05, 5.72] |
| 1.2.12 Pancreas | 1 | 201 | Odds Ratio (M‐H, Random, 95% CI) | 0.20 [0.01, 4.26] |
| 1.3 Characteristics of diagnosed cancer: stage of cancer Show forest plot | 1 | Odds Ratio (M‐H, Random, 95% CI) | Subtotals only | |
| 1.3.1 T1 or T2 (N0 M0) | 1 | 201 | Odds Ratio (M‐H, Random, 95% CI) | 5.00 [1.05, 23.76] |
| 1.3.2 T3 | 1 | 201 | Odds Ratio (M‐H, Random, 95% CI) | 0.25 [0.03, 2.28] |
| 1.4 Frequency of underlying cancer diagnosis Show forest plot | 2 | 396 | Odds Ratio (M‐H, Random, 95% CI) | 1.32 [0.59, 2.93] |
| Outcome or subgroup title | No. of studies | No. of participants | Statistical method | Effect size |
| 2.1 All‐cause mortality Show forest plot | 2 | 1248 | Odds Ratio (M‐H, Random, 95% CI) | 1.22 [0.49, 3.04] |
| 2.2 Cancer‐related mortality Show forest plot | 2 | 1248 | Odds Ratio (M‐H, Random, 95% CI) | 0.55 [0.20, 1.52] |
| 2.3 Venous thromboembolism‐related morbidity Show forest plot | 1 | 854 | Odds Ratio (M‐H, Random, 95% CI) | 1.02 [0.48, 2.17] |
| 2.4 Characteristics of diagnosed cancer: type of cancer Show forest plot | 2 | Odds Ratio (M‐H, Random, 95% CI) | Subtotals only | |
| 2.4.1 Acute leukaemia | 2 | 1248 | Odds Ratio (M‐H, Random, 95% CI) | 1.62 [0.20, 13.22] |
| 2.4.2 Gynaecological | 2 | 1248 | Odds Ratio (M‐H, Random, 95% CI) | 2.39 [0.43, 13.36] |
| 2.4.3 Skin: melanoma | 1 | 854 | Odds Ratio (M‐H, Random, 95% CI) | 1.02 [0.06, 16.34] |
| 2.4.4 Colorectal | 2 | 1248 | Odds Ratio (M‐H, Random, 95% CI) | 0.43 [0.08, 2.40] |
| 2.4.5 Prostate | 2 | 1248 | Odds Ratio (M‐H, Random, 95% CI) | 2.52 [0.48, 13.12] |
| 2.4.6 Pancreatic | 2 | 1248 | Odds Ratio (M‐H, Random, 95% CI) | 4.81 [0.55, 42.48] |
| 2.4.7 Cholangiocarcinoma | 1 | 854 | Odds Ratio (M‐H, Random, 95% CI) | 0.51 [0.05, 5.63] |
| 2.4.8 Lymphoma | 2 | 1248 | Odds Ratio (M‐H, Random, 95% CI) | 0.74 [0.09, 5.83] |
| 2.4.9 Breast | 1 | 854 | Odds Ratio (M‐H, Random, 95% CI) | 0.20 [0.01, 4.24] |
| 2.4.10 Urological | 2 | 1248 | Odds Ratio (M‐H, Random, 95% CI) | 0.62 [0.03, 12.32] |
| 2.4.11 Liver | 1 | 394 | Odds Ratio (M‐H, Random, 95% CI) | 0.33 [0.01, 8.19] |
| 2.4.12 Head and neck | 1 | 394 | Odds Ratio (M‐H, Random, 95% CI) | 3.02 [0.12, 74.47] |
| 2.4.13 Lung | 1 | 394 | Odds Ratio (M‐H, Random, 95% CI) | 3.02 [0.12, 74.47] |
| 2.4.14 Unknown primary | 1 | 854 | Odds Ratio (M‐H, Random, 95% CI) | 0.34 [0.01, 8.34] |
| 2.5 Characteristics of diagnosed cancer: stage of cancer Show forest plot | 1 | Odds Ratio (M‐H, Random, 95% CI) | Subtotals only | |
| 2.5.1 Early | 1 | 394 | Odds Ratio (M‐H, Random, 95% CI) | 1.78 [0.51, 6.17] |
| 2.5.2 Advanced | 1 | 394 | Odds Ratio (M‐H, Random, 95% CI) | 1.00 [0.14, 7.17] |
| 2.6 Frequency of an underlying cancer diagnosis Show forest plot | 2 | 1248 | Odds Ratio (M‐H, Random, 95% CI) | 1.71 [0.91, 3.20] |