Anticonvulsivos para fibromialgia
Información
- DOI:
- https://doi.org/10.1002/14651858.CD010782Copiar DOI

- Base de datos:
-
- Cochrane Database of Systematic Reviews
- Versión publicada:
-
- 16 octubre 2013see what's new
- Tipo:
-
- Intervention
- Etapa:
-
- Review
- Grupo Editorial Cochrane:
-
Grupo Cochrane de Salud musculoesquelética
- Copyright:
-
- Copyright © 2013 The Cochrane Collaboration. Published by John Wiley & Sons, Ltd.
Cifras del artículo
Altmetric:
Citado por:
Autores
Contributions of authors
NÜ: systematic review study selection, data extraction, data analysis, interpretation of findings; review final proof.
CS: data extraction, data analysis, interpretation of findings; review final proof.
BW: protocol review and revision; interpretation of findings; review final proof.
WH: topic conception and methodological aspects; protocol revision; systematic review study selection, data extraction, data analysis, interpretation of findings and author of review.
Declarations of interest
NÜ received consultancy honoraria from Grünenthal GmbH and travel grants from Pfizer, Astellas, Grünenthal GmbH and CSL Behring. CS received honoraria for educational lectures from Eli‐Lilly and Pfizer. BW received a consulting fee from Jazz Pharmaceuticals and was a site investigator for a milnacipran trial in FM. WH received honoraria for educational lectures from Eli‐Lilly, Janssen‐Cilag, Mundipharma and Pfizer and a travel grant from Eli‐Lilly. He serves on the advisory board of Daiichi Sankyo.
Acknowledgements
We thank Dr. Petra Klose, Internal Medicine V (Integrative Medicine), Kliniken Essen‐Mitte, Essen, Germany, for her assistance in the search of literature.
Version history
| Published | Title | Stage | Authors | Version |
| 2017 Oct 09 | Anticonvulsants for fibromyalgia | Review | Nurcan Üçeyler, Claudia Sommer, Brian Walitt, Winfried Häuser | |
| 2013 Oct 16 | Anticonvulsants for fibromyalgia | Review | Nurcan Üçeyler, Claudia Sommer, Brian Walitt, Winfried Häuser | |
Differences between protocol and review
The protocol 'Antidepressants and centrally active agents for fibromyalgia syndrome' (Nishishinya 2006), has been split into several systematic reviews. A random‐effects model was used for all analyses irrespective of the amount of heterogeneity. The intended subgroup analyses with gender and pain were not conducted because individual participant data were not available. The intended sensitivity analyses (different statistical models applied, presence of temporal differences, diagnostic criteria used in the trial, according to the presence/absence of any mental disorder, according to the presence/absence of any concomitant systemic disease) were not conducted because the studies did not differ in these characteristics. The GRADE approach was used for the grading of evidence.
Keywords
MeSH
Medical Subject Headings (MeSH) Keywords
- Acetamides [therapeutic use];
- Amines [therapeutic use];
- Anticonvulsants [*therapeutic use];
- Conflict of Interest;
- Cyclohexanecarboxylic Acids [therapeutic use];
- Fibromyalgia [*drug therapy];
- Piracetam [analogs & derivatives, therapeutic use];
- Pregabalin [therapeutic use];
- gamma‐Aminobutyric Acid [analogs & derivatives, therapeutic use];
Medical Subject Headings Check Words
Humans;

Study flow diagram.
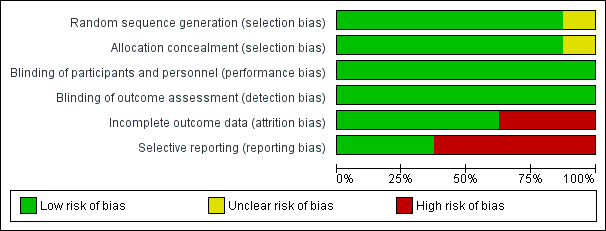
Risk of bias graph: review authors' judgements about each risk of bias item presented as percentages across all included studies.

Risk of bias summary: review authors' judgements about each risk of bias item for each included study.
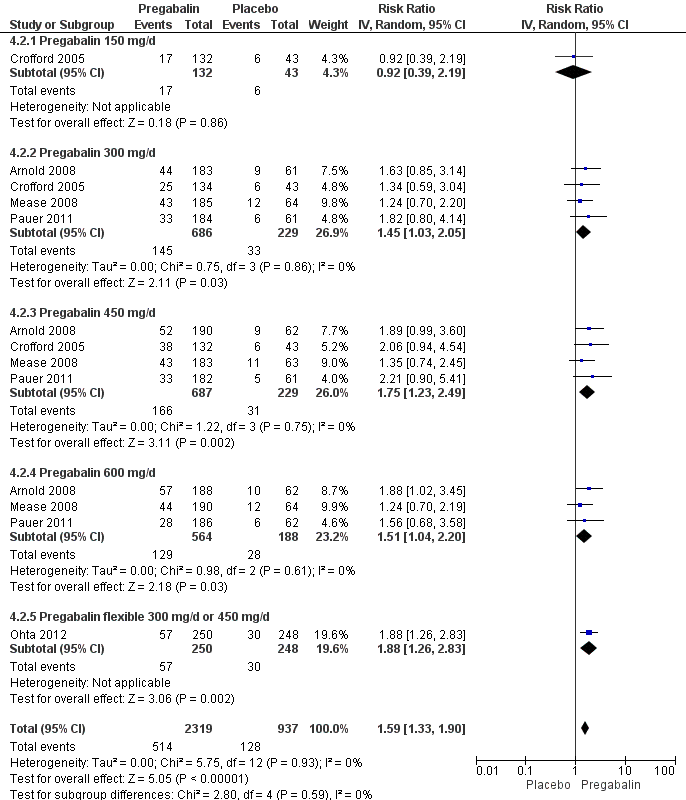
Forest plot of comparison: 4 Pregabalin versus placebo at end of treatment, outcome: 4.2 50% pain reduction.
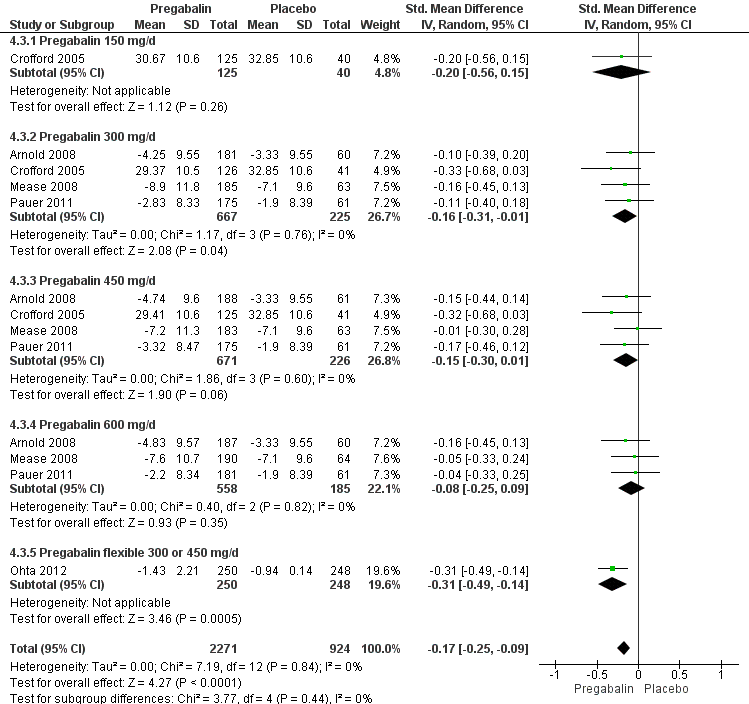
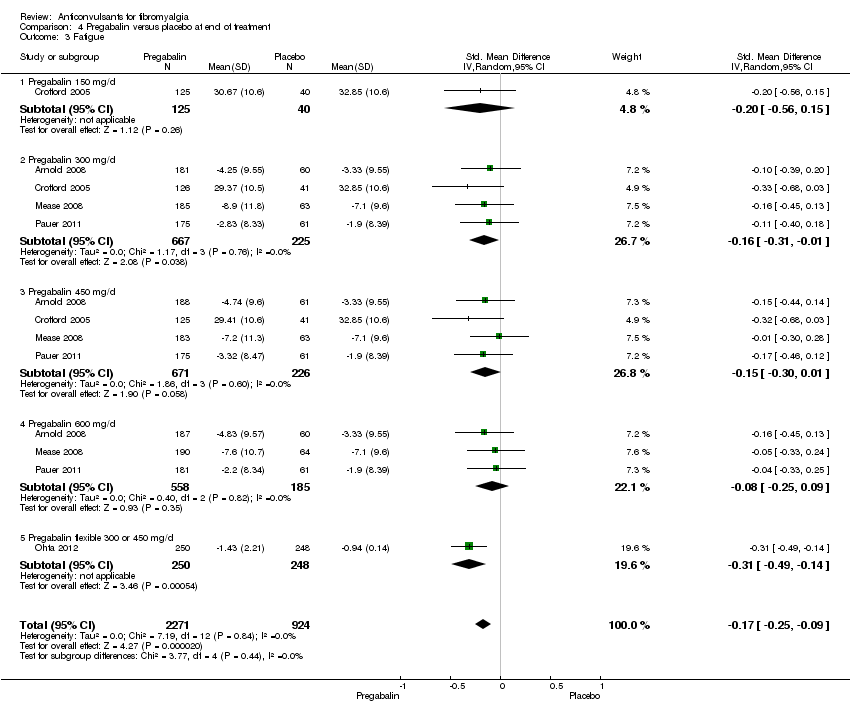
Forest plot of comparison: 4 Pregabalin versus placebo at end of treatment, outcome: 4.3 Fatigue.

Forest plot of comparison: 4 Pregabalin versus placebo at end of treatment, outcome: 4.4 Sleep problems.
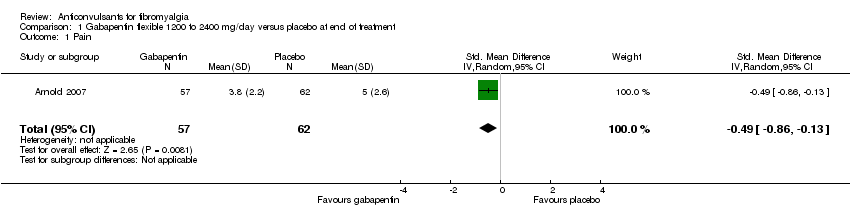
Comparison 1 Gabapentin flexible 1200 to 2400 mg/day versus placebo at end of treatment, Outcome 1 Pain.

Comparison 1 Gabapentin flexible 1200 to 2400 mg/day versus placebo at end of treatment, Outcome 2 50% pain reduction.

Comparison 1 Gabapentin flexible 1200 to 2400 mg/day versus placebo at end of treatment, Outcome 3 Sleep problems.
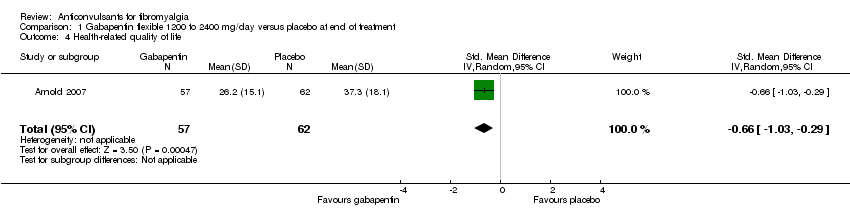
Comparison 1 Gabapentin flexible 1200 to 2400 mg/day versus placebo at end of treatment, Outcome 4 Health‐related quality of life.

Comparison 1 Gabapentin flexible 1200 to 2400 mg/day versus placebo at end of treatment, Outcome 5 Withdrawal due to adverse events.

Comparison 1 Gabapentin flexible 1200 to 2400 mg/day versus placebo at end of treatment, Outcome 6 Dizziness.
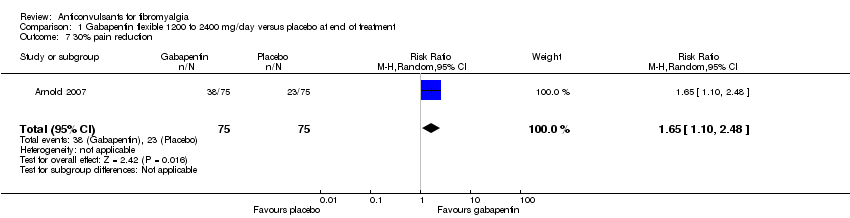
Comparison 1 Gabapentin flexible 1200 to 2400 mg/day versus placebo at end of treatment, Outcome 7 30% pain reduction.

Comparison 1 Gabapentin flexible 1200 to 2400 mg/day versus placebo at end of treatment, Outcome 8 Depression.

Comparison 1 Gabapentin flexible 1200 to 2400 mg/day versus placebo at end of treatment, Outcome 9 Disability.
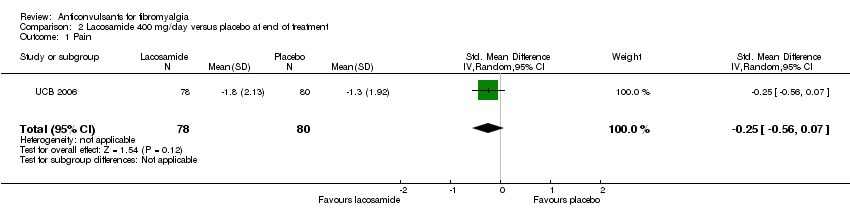
Comparison 2 Lacosamide 400 mg/day versus placebo at end of treatment, Outcome 1 Pain.

Comparison 2 Lacosamide 400 mg/day versus placebo at end of treatment, Outcome 2 Fatigue.
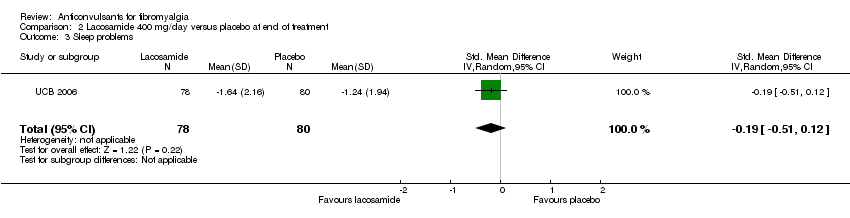
Comparison 2 Lacosamide 400 mg/day versus placebo at end of treatment, Outcome 3 Sleep problems.

Comparison 2 Lacosamide 400 mg/day versus placebo at end of treatment, Outcome 4 Health‐related quality of life.
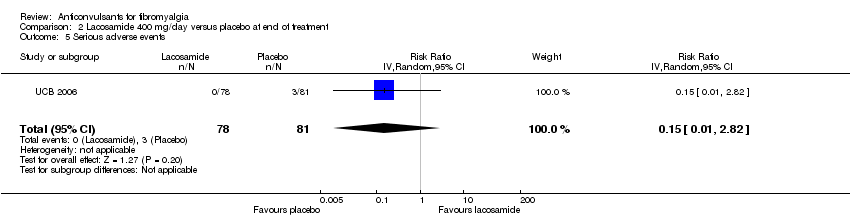
Comparison 2 Lacosamide 400 mg/day versus placebo at end of treatment, Outcome 5 Serious adverse events.
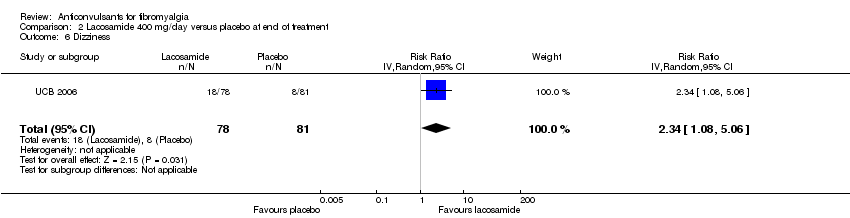
Comparison 2 Lacosamide 400 mg/day versus placebo at end of treatment, Outcome 6 Dizziness.

Comparison 2 Lacosamide 400 mg/day versus placebo at end of treatment, Outcome 7 Anxiety.

Comparison 2 Lacosamide 400 mg/day versus placebo at end of treatment, Outcome 8 Depression.

Comparison 2 Lacosamide 400 mg/day versus placebo at end of treatment, Outcome 9 Disability.

Comparison 2 Lacosamide 400 mg/day versus placebo at end of treatment, Outcome 10 Patient Global Impression of Change 'much' or 'very much' improved.
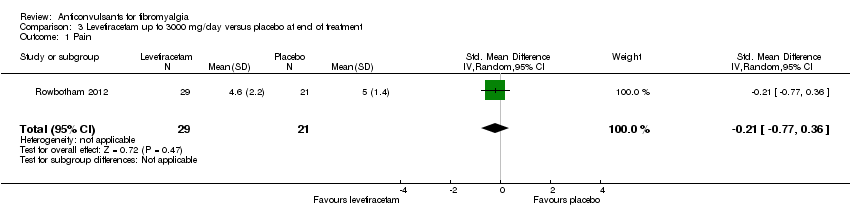
Comparison 3 Levetiracetam up to 3000 mg/day versus placebo at end of treatment, Outcome 1 Pain.

Comparison 3 Levetiracetam up to 3000 mg/day versus placebo at end of treatment, Outcome 2 50% pain reduction.

Comparison 3 Levetiracetam up to 3000 mg/day versus placebo at end of treatment, Outcome 3 Sleep problems.

Comparison 3 Levetiracetam up to 3000 mg/day versus placebo at end of treatment, Outcome 4 Health‐related quality of life.

Comparison 3 Levetiracetam up to 3000 mg/day versus placebo at end of treatment, Outcome 5 Withdrawal due to adverse events.

Comparison 3 Levetiracetam up to 3000 mg/day versus placebo at end of treatment, Outcome 6 Dizziness.

Comparison 3 Levetiracetam up to 3000 mg/day versus placebo at end of treatment, Outcome 7 30% pain reduction.
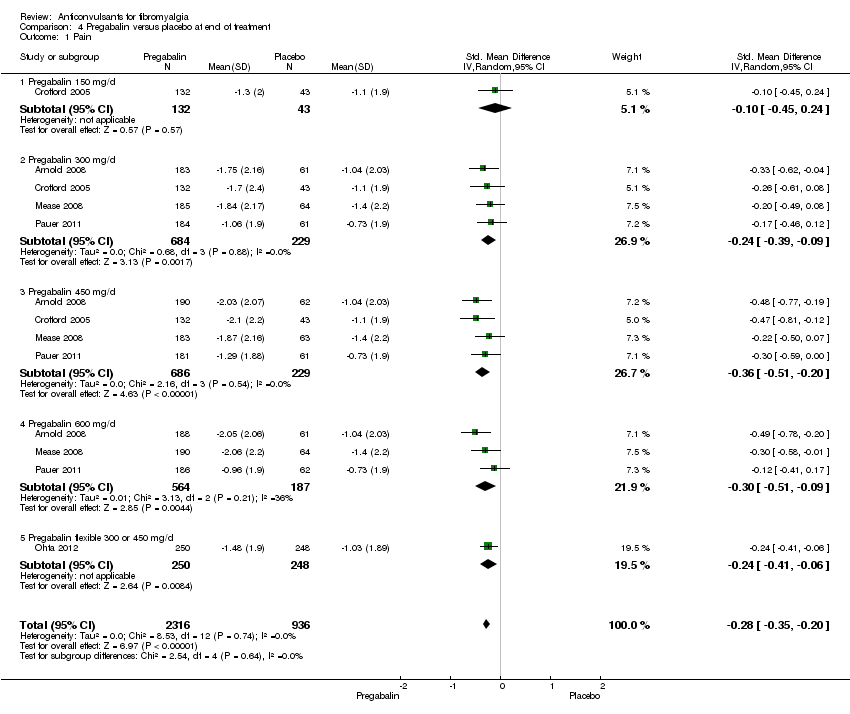
Comparison 4 Pregabalin versus placebo at end of treatment, Outcome 1 Pain.

Comparison 4 Pregabalin versus placebo at end of treatment, Outcome 2 50% pain reduction.
Comparison 4 Pregabalin versus placebo at end of treatment, Outcome 3 Fatigue.

Comparison 4 Pregabalin versus placebo at end of treatment, Outcome 4 Sleep problems.
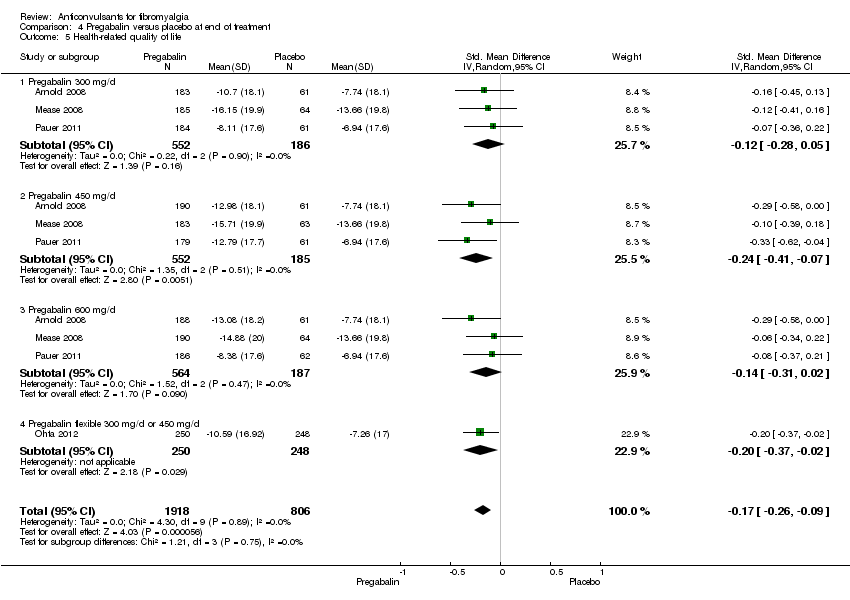
Comparison 4 Pregabalin versus placebo at end of treatment, Outcome 5 Health‐related quality of life.

Comparison 4 Pregabalin versus placebo at end of treatment, Outcome 6 Withdrawal due to adverse events.
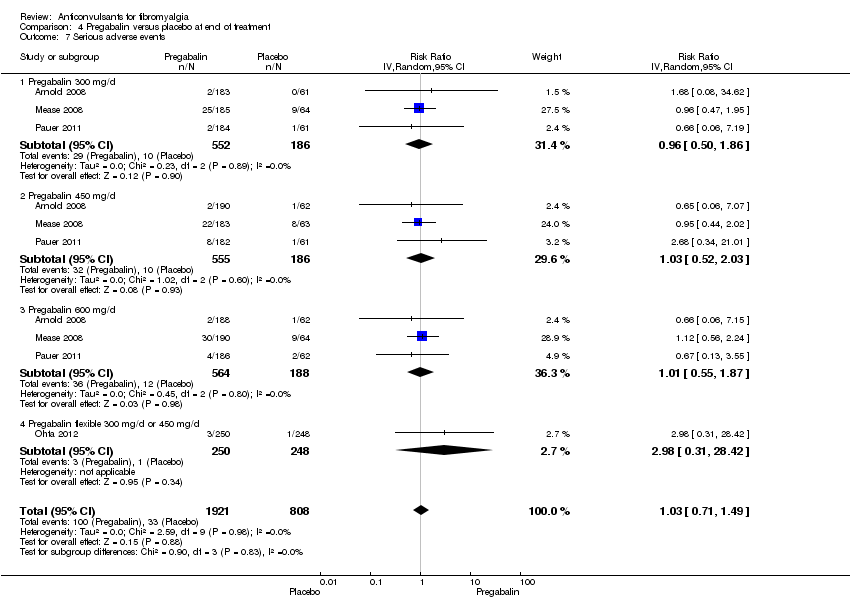
Comparison 4 Pregabalin versus placebo at end of treatment, Outcome 7 Serious adverse events.

Comparison 4 Pregabalin versus placebo at end of treatment, Outcome 8 Dizziness.
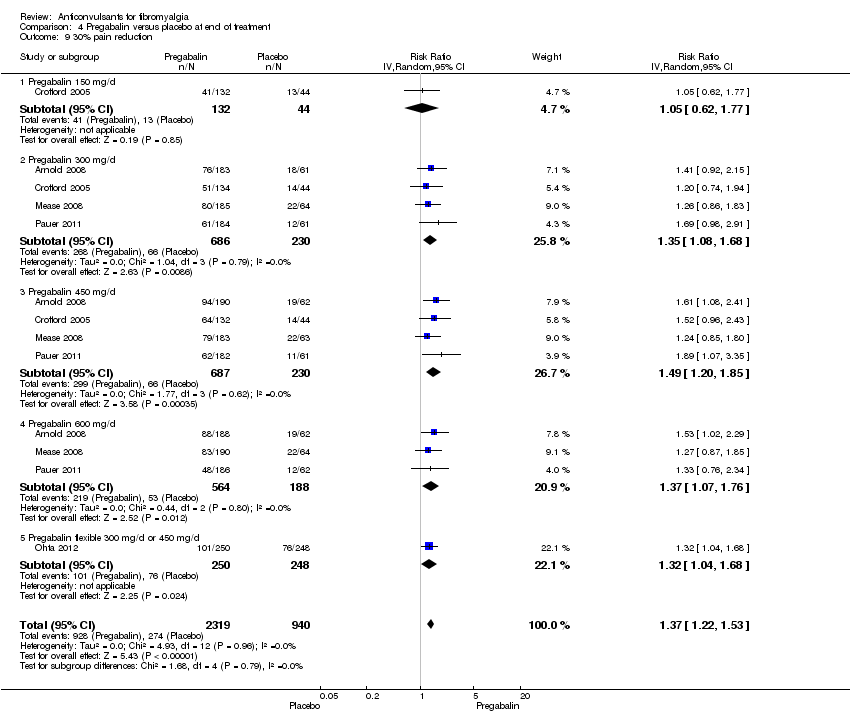
Comparison 4 Pregabalin versus placebo at end of treatment, Outcome 9 30% pain reduction.
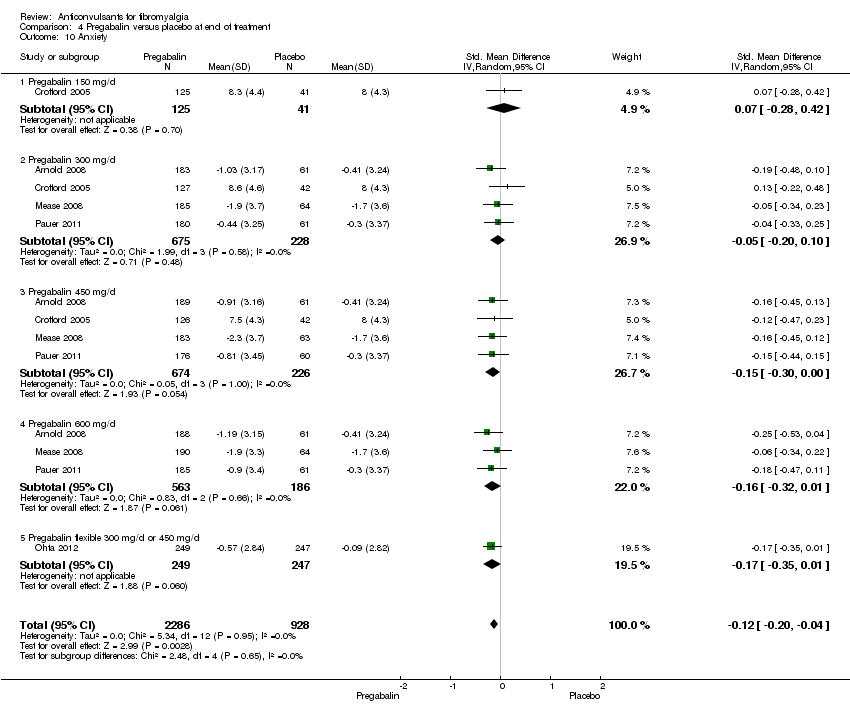
Comparison 4 Pregabalin versus placebo at end of treatment, Outcome 10 Anxiety.

Comparison 4 Pregabalin versus placebo at end of treatment, Outcome 11 Depression.

Comparison 4 Pregabalin versus placebo at end of treatment, Outcome 12 Disability.

Comparison 4 Pregabalin versus placebo at end of treatment, Outcome 13 Patient Global Impression of Change 'much' or 'very much' improved.
| Pregabalin versus placebo at final treatment for fibromyalgia | ||||||
| Patient or population: People with fibromyalgia | ||||||
| Outcomes | Illustrative comparative risks* (95% CI) | Relative effect | No of participants | Quality of the evidence | Comments | |
| Assumed risk | Corresponding risk | |||||
| Control | Anticonvulsants versus placebo at final treatment | |||||
| 50% pain reduction | 137 per 1000 | 217 per 1000 | RR 1.59 | 3256 | ⊕⊕⊕⊕ | Absolute risk difference (fewer pain) 8% (95% CI 6% to 11%) Relative per cent improvement 59% (95% CI 33% to 90%) NNTB 12 (95% CI 9 to 21) |
| Patient Global Impression of Change of 'much' or 'very much' improved | 279 per 1000 | 385 per 1000 | RR 1.38 | 3183 | ⊕⊕⊕⊕ | Absolute risk difference (more global impression of 'much' and 'very much' improved) 12% (95% CI 4% to 20%) Relative per cent improvement 38% (95% CI 23% to 55%) NNTB 9 (95% CI 7 to 15) |
| Fatigue (1‐50 scale) Higher scores indicate higher fatigue levels | MAF baseline fatigue score control group 35.6 (standard deviation 8.0) ** | The mean fatigue in the intervention groups was | 3195 | ⊕⊕⊕⊕ | SMD ‐0.17 (‐0.25 to ‐0.09) 2.7% (95% CI 1.4% to 4.0%) fewer points on the fatigue scale (absolute improvement) 3.8% (95% CI 2.0% to 5.6%) relative improvement NNTB 13 (95% CI 9 to 25) | |
| Sleep problems (0‐100 scale). Higher scores indicate more sleep problems | MOS baseline overall sleep problem index control group 58.5 (17.8) *** | The mean sleep problems in the intervention groups was | 3139 | ⊕⊕⊕⊕ | SMD ‐0.35 (‐0.43 to ‐0.27) 6.2% (95% CI 4.8% to 7.7%) fewer points on the sleep problem scale (absolute improvement) 10.6% (95% CI 82.% to 13.1%) relative improvement NNTB 7 (95% CI 5 to 8) | |
| Withdrawal due to adverse events | 110 per 1000 | 185 per 1000 | RR 1.68 | 3259 | ⊕⊕⊕⊕ | Absolute risk difference (more withdrawal due to adverse events) 8% (95% CI 5% to 12%) Relative per cent worsening 68% (95% CI 36% to 107%) NNTH 13 (95% CI 9 to 23) |
| Serious adverse events | 41 per 1000 | 42 per 1000 | RR 1.03 | 2729 | ⊕⊕⊕⊝ | Absolute risk difference 0 (95% CI ‐1 to 1) Relative per cent change 0 (95% CI ‐1 to 1) Not statistically significant |
| Dizziness reported to be an adverse event | 93 per 1000 | 350 per 1000 | RR 3.77 | 3257 | ⊕⊕⊕⊕ | Absolute risk difference (more dizziness) 28% (95% CI 24% to 32%) Relative per cent worsening 277% (95% CI 206% to 363%) NNTH 4 (95% CI 3 to 5) |
| *The basis for the assumed risk (e.g. the median control group risk across studies) is provided in footnotes. The corresponding risk (and its 95% confidence interval) is based on the assumed risk in the comparison group and the relative effect of the intervention (and its 95% CI). CI: confidence interval; MAF: Multidimensional Assessment of Fatigue; MOS: Medical Outcomes Study; NNTB: number needed to treat for an additional beneficial outcome; NNTH: number needed to treat for an additional harmful outcome; NRS: numeric rating scale; RR: risk ratio; SMD: standardised mean difference. | ||||||
| GRADE Working Group grades of evidence | ||||||
| 1 Frequency of serious adverse events not reported by one study. ** Arnold 2008: n = 190 participants; MAF (NRS 1‐50). *** Arnold 2008: n = 190 participants; MOS Overall Sleep Problems Index (NRS 0‐100). | ||||||
| Outcome or subgroup title | No. of studies | No. of participants | Statistical method | Effect size |
| 1 Pain Show forest plot | 1 | 119 | Std. Mean Difference (IV, Random, 95% CI) | ‐0.49 [‐0.86, ‐0.13] |
| 2 50% pain reduction Show forest plot | 1 | 150 | Risk Ratio (IV, Random, 95% CI) | 1.6 [1.01, 2.53] |
| 3 Sleep problems Show forest plot | 1 | 119 | Std. Mean Difference (IV, Random, 95% CI) | ‐0.71 [‐1.08, ‐0.34] |
| 4 Health‐related quality of life Show forest plot | 1 | 119 | Std. Mean Difference (IV, Random, 95% CI) | ‐0.66 [‐1.03, ‐0.29] |
| 5 Withdrawal due to adverse events Show forest plot | 1 | 150 | Risk Ratio (IV, Random, 95% CI) | 1.71 [0.71, 4.11] |
| 6 Dizziness Show forest plot | 1 | 150 | Risk Ratio (IV, Random, 95% CI) | 2.71 [1.21, 6.07] |
| 7 30% pain reduction Show forest plot | 1 | 150 | Risk Ratio (M‐H, Random, 95% CI) | 1.65 [1.10, 2.48] |
| 8 Depression Show forest plot | 1 | 119 | Std. Mean Difference (IV, Random, 95% CI) | ‐0.52 [‐0.89, ‐0.16] |
| 9 Disability Show forest plot | 1 | 119 | Std. Mean Difference (IV, Random, 95% CI) | ‐0.94 [‐1.32, ‐0.56] |
| Outcome or subgroup title | No. of studies | No. of participants | Statistical method | Effect size |
| 1 Pain Show forest plot | 1 | 158 | Std. Mean Difference (IV, Random, 95% CI) | ‐0.25 [‐0.56, 0.07] |
| 2 Fatigue Show forest plot | 1 | 121 | Std. Mean Difference (IV, Random, 95% CI) | ‐0.07 [‐0.43, 0.28] |
| 3 Sleep problems Show forest plot | 1 | 158 | Std. Mean Difference (IV, Random, 95% CI) | ‐0.19 [‐0.51, 0.12] |
| 4 Health‐related quality of life Show forest plot | 1 | 157 | Std. Mean Difference (IV, Random, 95% CI) | ‐0.15 [‐0.47, 0.16] |
| 5 Serious adverse events Show forest plot | 1 | 159 | Risk Ratio (IV, Random, 95% CI) | 0.15 [0.01, 2.82] |
| 6 Dizziness Show forest plot | 1 | 159 | Risk Ratio (IV, Random, 95% CI) | 2.34 [1.08, 5.06] |
| 7 Anxiety Show forest plot | 1 | 133 | Std. Mean Difference (IV, Random, 95% CI) | 0.0 [‐0.34, 0.34] |
| 8 Depression Show forest plot | 1 | 134 | Std. Mean Difference (IV, Random, 95% CI) | 0.11 [‐0.23, 0.45] |
| 9 Disability Show forest plot | 1 | 158 | Std. Mean Difference (IV, Random, 95% CI) | ‐0.19 [‐0.51, 0.12] |
| 10 Patient Global Impression of Change 'much' or 'very much' improved Show forest plot | 1 | 134 | Risk Ratio (IV, Random, 95% CI) | 1.32 [0.85, 2.04] |
| Outcome or subgroup title | No. of studies | No. of participants | Statistical method | Effect size |
| 1 Pain Show forest plot | 1 | 50 | Std. Mean Difference (IV, Random, 95% CI) | ‐0.21 [‐0.77, 0.36] |
| 2 50% pain reduction Show forest plot | 1 | 66 | Risk Ratio (IV, Random, 95% CI) | 1.52 [0.43, 5.34] |
| 3 Sleep problems Show forest plot | 1 | 50 | Std. Mean Difference (IV, Random, 95% CI) | ‐0.16 [‐0.72, 0.40] |
| 4 Health‐related quality of life Show forest plot | 1 | 50 | Std. Mean Difference (IV, Random, 95% CI) | 0.14 [‐0.42, 0.70] |
| 5 Withdrawal due to adverse events Show forest plot | 1 | 66 | Risk Ratio (IV, Random, 95% CI) | 0.87 [0.21, 3.56] |
| 6 Dizziness Show forest plot | 1 | 66 | Risk Ratio (IV, Random, 95% CI) | 1.3 [1.02, 1.66] |
| 7 30% pain reduction Show forest plot | 1 | 66 | Risk Ratio (IV, Random, 95% CI) | 1.23 [0.65, 2.33] |
| Outcome or subgroup title | No. of studies | No. of participants | Statistical method | Effect size |
| 1 Pain Show forest plot | 5 | 3252 | Std. Mean Difference (IV, Random, 95% CI) | ‐0.28 [‐0.35, ‐0.20] |
| 1.1 Pregabalin 150 mg/d | 1 | 175 | Std. Mean Difference (IV, Random, 95% CI) | ‐0.10 [‐0.45, 0.24] |
| 1.2 Pregabalin 300 mg/d | 4 | 913 | Std. Mean Difference (IV, Random, 95% CI) | ‐0.24 [‐0.39, ‐0.09] |
| 1.3 Pregabalin 450 mg/d | 4 | 915 | Std. Mean Difference (IV, Random, 95% CI) | ‐0.36 [‐0.51, ‐0.20] |
| 1.4 Pregabalin 600 mg/d | 3 | 751 | Std. Mean Difference (IV, Random, 95% CI) | ‐0.30 [‐0.51, ‐0.09] |
| 1.5 Pregabalin flexible 300 or 450 mg/d | 1 | 498 | Std. Mean Difference (IV, Random, 95% CI) | ‐0.24 [‐0.41, ‐0.06] |
| 2 50% pain reduction Show forest plot | 5 | 3256 | Risk Ratio (IV, Random, 95% CI) | 1.59 [1.33, 1.90] |
| 2.1 Pregabalin 150 mg/d | 1 | 175 | Risk Ratio (IV, Random, 95% CI) | 0.92 [0.39, 2.19] |
| 2.2 Pregabalin 300 mg/d | 4 | 915 | Risk Ratio (IV, Random, 95% CI) | 1.45 [1.03, 2.05] |
| 2.3 Pregabalin 450 mg/d | 4 | 916 | Risk Ratio (IV, Random, 95% CI) | 1.75 [1.23, 2.49] |
| 2.4 Pregabalin 600 mg/d | 3 | 752 | Risk Ratio (IV, Random, 95% CI) | 1.51 [1.04, 2.20] |
| 2.5 Pregabalin flexible 300 mg/d or 450 mg/d | 1 | 498 | Risk Ratio (IV, Random, 95% CI) | 1.88 [1.26, 2.83] |
| 3 Fatigue Show forest plot | 5 | 3195 | Std. Mean Difference (IV, Random, 95% CI) | ‐0.17 [‐0.25, ‐0.09] |
| 3.1 Pregabalin 150 mg/d | 1 | 165 | Std. Mean Difference (IV, Random, 95% CI) | ‐0.20 [‐0.56, 0.15] |
| 3.2 Pregabalin 300 mg/d | 4 | 892 | Std. Mean Difference (IV, Random, 95% CI) | ‐0.16 [‐0.31, ‐0.01] |
| 3.3 Pregabalin 450 mg/d | 4 | 897 | Std. Mean Difference (IV, Random, 95% CI) | ‐0.15 [‐0.30, 0.01] |
| 3.4 Pregabalin 600 mg/d | 3 | 743 | Std. Mean Difference (IV, Random, 95% CI) | ‐0.08 [‐0.25, 0.09] |
| 3.5 Pregabalin flexible 300 or 450 mg/d | 1 | 498 | Std. Mean Difference (IV, Random, 95% CI) | ‐0.31 [‐0.49, ‐0.14] |
| 4 Sleep problems Show forest plot | 5 | 3193 | Std. Mean Difference (IV, Random, 95% CI) | ‐0.35 [‐0.43, ‐0.27] |
| 4.1 Pregabalin 150 mg/d | 1 | 163 | Std. Mean Difference (IV, Random, 95% CI) | ‐0.44 [‐0.80, ‐0.08] |
| 4.2 Pregabalin 300 mg/d | 4 | 897 | Std. Mean Difference (IV, Random, 95% CI) | ‐0.29 [‐0.44, ‐0.14] |
| 4.3 Pregabalin 450 mg/d | 4 | 893 | Std. Mean Difference (IV, Random, 95% CI) | ‐0.45 [‐0.63, ‐0.27] |
| 4.4 Pregabalin 600 mg/d | 3 | 744 | Std. Mean Difference (IV, Random, 95% CI) | ‐0.40 [‐0.57, ‐0.23] |
| 4.5 Pregabalin flexible 300 or 450 mg/d | 1 | 496 | Std. Mean Difference (IV, Random, 95% CI) | ‐0.20 [‐0.37, ‐0.02] |
| 5 Health‐related quality of life Show forest plot | 4 | 2724 | Std. Mean Difference (IV, Random, 95% CI) | ‐0.17 [‐0.26, ‐0.09] |
| 5.1 Pregabalin 300 mg/d | 3 | 738 | Std. Mean Difference (IV, Random, 95% CI) | ‐0.12 [‐0.28, 0.05] |
| 5.2 Pregabalin 450 mg/d | 3 | 737 | Std. Mean Difference (IV, Random, 95% CI) | ‐0.24 [‐0.41, ‐0.07] |
| 5.3 Pregabalin 600 mg/d | 3 | 751 | Std. Mean Difference (IV, Random, 95% CI) | ‐0.14 [‐0.31, 0.02] |
| 5.4 Pregabalin flexible 300 mg/d or 450 mg/d | 1 | 498 | Std. Mean Difference (IV, Random, 95% CI) | ‐0.20 [‐0.37, ‐0.02] |
| 6 Withdrawal due to adverse events Show forest plot | 5 | 3259 | Risk Ratio (IV, Random, 95% CI) | 1.68 [1.36, 2.07] |
| 6.1 Pregabalin 150 mg/d | 1 | 175 | Risk Ratio (IV, Random, 95% CI) | 1.19 [0.35, 4.08] |
| 6.2 Pregabalin 300 mg/d | 4 | 917 | Risk Ratio (IV, Random, 95% CI) | 1.54 [1.02, 2.34] |
| 6.3 Pregabalin 450 mg/d | 4 | 917 | Risk Ratio (IV, Random, 95% CI) | 2.02 [1.32, 3.09] |
| 6.4 Pregabalin 600 mg/d | 3 | 752 | Risk Ratio (IV, Random, 95% CI) | 2.53 [1.65, 3.86] |
| 6.5 Pregabalin flexible 300 mg/d or 450 mg/d | 1 | 498 | Risk Ratio (IV, Random, 95% CI) | 1.01 [0.65, 1.57] |
| 7 Serious adverse events Show forest plot | 4 | 2729 | Risk Ratio (IV, Random, 95% CI) | 1.03 [0.71, 1.49] |
| 7.1 Pregabalin 300 mg/d | 3 | 738 | Risk Ratio (IV, Random, 95% CI) | 0.96 [0.50, 1.86] |
| 7.2 Pregabalin 450 mg/d | 3 | 741 | Risk Ratio (IV, Random, 95% CI) | 1.03 [0.52, 2.03] |
| 7.3 Pregabalin 600 mg/d | 3 | 752 | Risk Ratio (IV, Random, 95% CI) | 1.01 [0.55, 1.87] |
| 7.4 Pregabalin flexible 300 mg/d or 450 mg/d | 1 | 498 | Risk Ratio (IV, Random, 95% CI) | 2.98 [0.31, 28.42] |
| 8 Dizziness Show forest plot | 5 | 3257 | Risk Ratio (IV, Random, 95% CI) | 3.77 [3.06, 4.63] |
| 8.1 Pregabalin 150 mg/d | 1 | 175 | Risk Ratio (IV, Random, 95% CI) | 2.44 [0.91, 6.54] |
| 8.2 Pregabalin 300 mg/d | 4 | 916 | Risk Ratio (IV, Random, 95% CI) | 3.11 [2.09, 4.65] |
| 8.3 Pregabalin 450 mg/d | 4 | 917 | Risk Ratio (IV, Random, 95% CI) | 3.95 [2.68, 5.82] |
| 8.4 Pregabalin 600 mg/d | 3 | 751 | Risk Ratio (IV, Random, 95% CI) | 4.00 [2.65, 6.03] |
| 8.5 Pregabalin flexible 300 mg/d or 450 mg/d | 1 | 498 | Risk Ratio (IV, Random, 95% CI) | 4.89 [2.89, 8.28] |
| 9 30% pain reduction Show forest plot | 5 | 3259 | Risk Ratio (IV, Random, 95% CI) | 1.37 [1.22, 1.53] |
| 9.1 Pregabalin 150 mg/d | 1 | 176 | Risk Ratio (IV, Random, 95% CI) | 1.05 [0.62, 1.77] |
| 9.2 Pregabalin 300 mg/d | 4 | 916 | Risk Ratio (IV, Random, 95% CI) | 1.35 [1.08, 1.68] |
| 9.3 Pregabalin 450 mg/d | 4 | 917 | Risk Ratio (IV, Random, 95% CI) | 1.49 [1.20, 1.85] |
| 9.4 Pregabalin 600 mg/d | 3 | 752 | Risk Ratio (IV, Random, 95% CI) | 1.37 [1.07, 1.76] |
| 9.5 Pregabalin flexible 300 mg/d or 450 mg/d | 1 | 498 | Risk Ratio (IV, Random, 95% CI) | 1.32 [1.04, 1.68] |
| 10 Anxiety Show forest plot | 5 | 3214 | Std. Mean Difference (IV, Random, 95% CI) | ‐0.12 [‐0.20, ‐0.04] |
| 10.1 Pregabalin 150 mg/d | 1 | 166 | Std. Mean Difference (IV, Random, 95% CI) | 0.07 [‐0.28, 0.42] |
| 10.2 Pregabalin 300 mg/d | 4 | 903 | Std. Mean Difference (IV, Random, 95% CI) | ‐0.05 [‐0.20, 0.10] |
| 10.3 Pregabalin 450 mg/d | 4 | 900 | Std. Mean Difference (IV, Random, 95% CI) | ‐0.15 [‐0.30, 0.00] |
| 10.4 Pregabalin 600 mg/d | 3 | 749 | Std. Mean Difference (IV, Random, 95% CI) | ‐0.16 [‐0.32, 0.01] |
| 10.5 Pregabalin flexible 300 mg/d or 450 mg/d | 1 | 496 | Std. Mean Difference (IV, Random, 95% CI) | ‐0.17 [‐0.35, 0.01] |
| 11 Depression Show forest plot | 5 | 3212 | Std. Mean Difference (IV, Random, 95% CI) | ‐0.09 [‐0.16, ‐0.01] |
| 11.1 Pregabalin 150 mg/d | 1 | 165 | Std. Mean Difference (IV, Random, 95% CI) | ‐0.10 [‐0.45, 0.25] |
| 11.2 Pregabalin 300 mg/d | 4 | 902 | Std. Mean Difference (IV, Random, 95% CI) | ‐0.05 [‐0.20, 0.10] |
| 11.3 Pregabalin 450 mg/d | 4 | 900 | Std. Mean Difference (IV, Random, 95% CI) | ‐0.13 [‐0.28, 0.02] |
| 11.4 Pregabalin 600 mg/d | 3 | 749 | Std. Mean Difference (IV, Random, 95% CI) | ‐0.06 [‐0.23, 0.10] |
| 11.5 Pregabalin flexible 300 mg/d or 450 mg/d | 1 | 496 | Std. Mean Difference (IV, Random, 95% CI) | ‐0.09 [‐0.27, 0.08] |
| 12 Disability Show forest plot | 5 | 3145 | Std. Mean Difference (IV, Random, 95% CI) | ‐0.01 [‐0.11, 0.09] |
| 12.1 Pregabalin 150 mg/d | 1 | 166 | Std. Mean Difference (IV, Random, 95% CI) | 0.11 [‐0.24, 0.47] |
| 12.2 Pregabalin 300 mg/d | 4 | 879 | Std. Mean Difference (IV, Random, 95% CI) | 0.04 [‐0.11, 0.20] |
| 12.3 Pregabalin 450 mg/d | 4 | 888 | Std. Mean Difference (IV, Random, 95% CI) | 0.00 [‐0.17, 0.18] |
| 12.4 Pregabalin 600 mg/d | 3 | 714 | Std. Mean Difference (IV, Random, 95% CI) | 0.03 [‐0.14, 0.21] |
| 12.5 Pregabalin flexible 300 mg/d or 450 mg/d | 1 | 498 | Std. Mean Difference (IV, Random, 95% CI) | ‐0.29 [‐0.47, ‐0.12] |
| 13 Patient Global Impression of Change 'much' or 'very much' improved Show forest plot | 5 | 3183 | Risk Ratio (IV, Random, 95% CI) | 1.38 [1.23, 1.55] |
| 13.1 Pregabalin 150 mg/d | 1 | 175 | Risk Ratio (IV, Random, 95% CI) | 1.30 [0.74, 2.29] |
| 13.2 Pregabalin 300 mg/d | 4 | 886 | Risk Ratio (IV, Random, 95% CI) | 1.25 [0.99, 1.57] |
| 13.3 Pregabalin 450 mg/d | 4 | 892 | Risk Ratio (IV, Random, 95% CI) | 1.54 [1.15, 2.06] |
| 13.4 Pregabalin 600 mg/d | 3 | 734 | Risk Ratio (IV, Random, 95% CI) | 1.37 [1.06, 1.76] |
| 13.5 Pregabalin flexible 300 mg/d or 450 mg/d | 1 | 496 | Risk Ratio (IV, Random, 95% CI) | 1.44 [1.11, 1.87] |