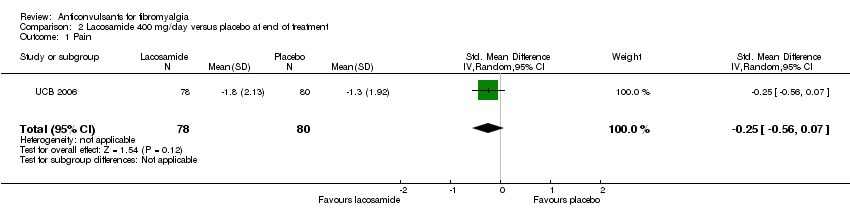
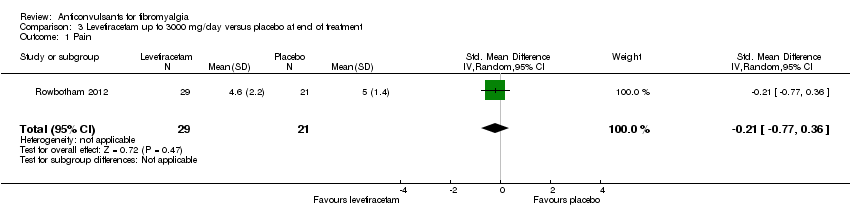
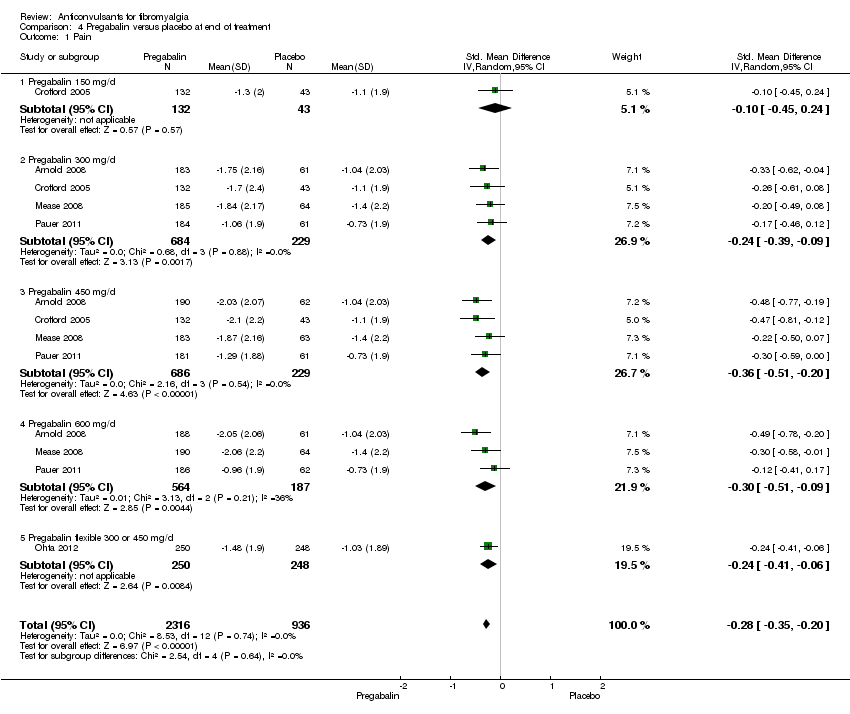
| 1 Pain Show forest plot | 5 | 3252 | Std. Mean Difference (IV, Random, 95% CI) | ‐0.28 [‐0.35, ‐0.20] |
|
| 1.1 Pregabalin 150 mg/d | 1 | 175 | Std. Mean Difference (IV, Random, 95% CI) | ‐0.10 [‐0.45, 0.24] |
| 1.2 Pregabalin 300 mg/d | 4 | 913 | Std. Mean Difference (IV, Random, 95% CI) | ‐0.24 [‐0.39, ‐0.09] |
| 1.3 Pregabalin 450 mg/d | 4 | 915 | Std. Mean Difference (IV, Random, 95% CI) | ‐0.36 [‐0.51, ‐0.20] |
| 1.4 Pregabalin 600 mg/d | 3 | 751 | Std. Mean Difference (IV, Random, 95% CI) | ‐0.30 [‐0.51, ‐0.09] |
| 1.5 Pregabalin flexible 300 or 450 mg/d | 1 | 498 | Std. Mean Difference (IV, Random, 95% CI) | ‐0.24 [‐0.41, ‐0.06] |
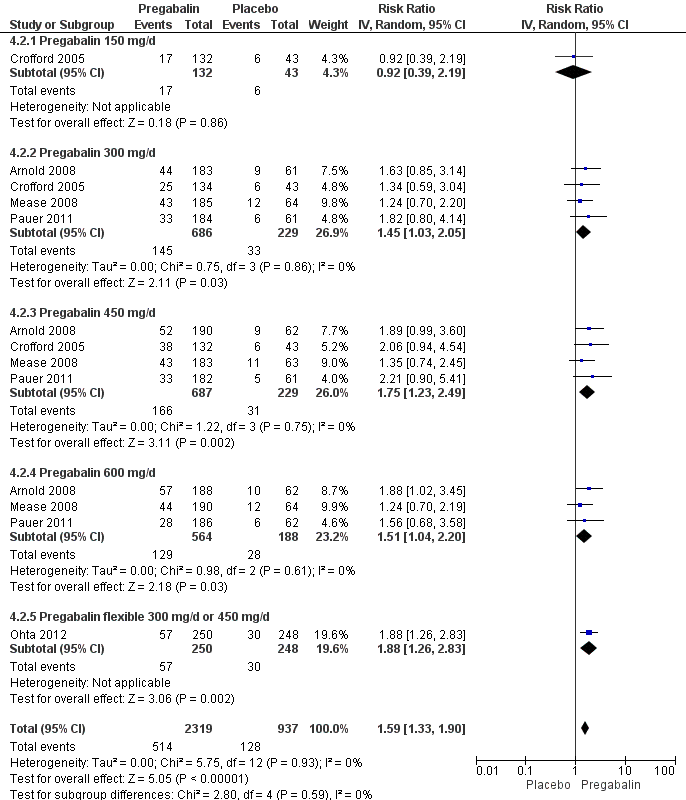
| 2 50% pain reduction Show forest plot | 5 | 3256 | Risk Ratio (IV, Random, 95% CI) | 1.59 [1.33, 1.90] |
|
| 2.1 Pregabalin 150 mg/d | 1 | 175 | Risk Ratio (IV, Random, 95% CI) | 0.92 [0.39, 2.19] |
| 2.2 Pregabalin 300 mg/d | 4 | 915 | Risk Ratio (IV, Random, 95% CI) | 1.45 [1.03, 2.05] |
| 2.3 Pregabalin 450 mg/d | 4 | 916 | Risk Ratio (IV, Random, 95% CI) | 1.75 [1.23, 2.49] |
| 2.4 Pregabalin 600 mg/d | 3 | 752 | Risk Ratio (IV, Random, 95% CI) | 1.51 [1.04, 2.20] |
| 2.5 Pregabalin flexible 300 mg/d or 450 mg/d | 1 | 498 | Risk Ratio (IV, Random, 95% CI) | 1.88 [1.26, 2.83] |
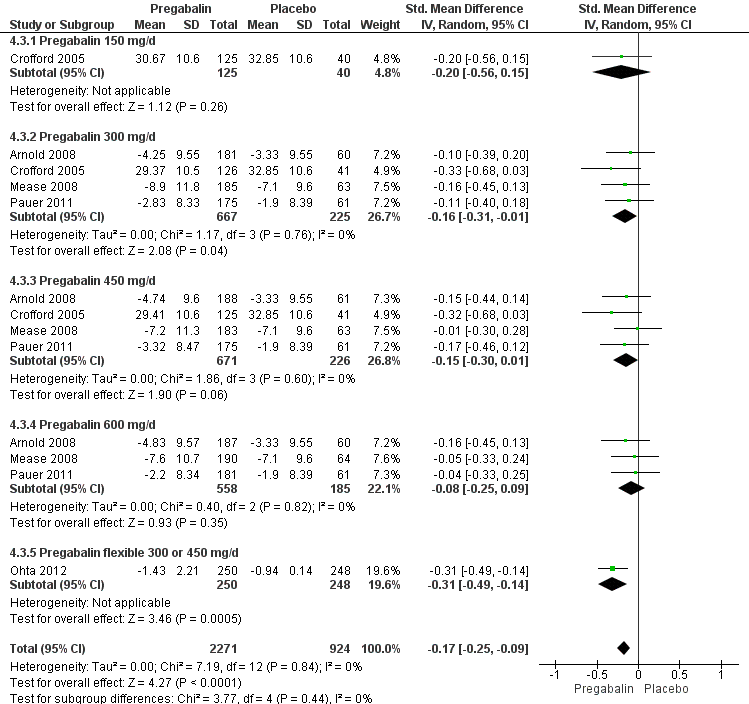
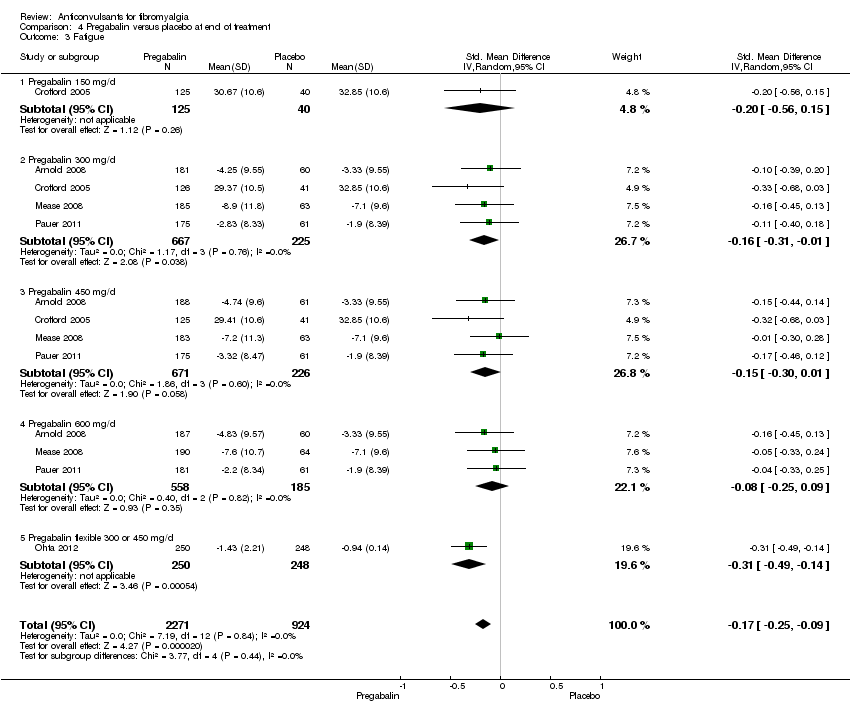
| 3 Fatigue Show forest plot | 5 | 3195 | Std. Mean Difference (IV, Random, 95% CI) | ‐0.17 [‐0.25, ‐0.09] |
|
| 3.1 Pregabalin 150 mg/d | 1 | 165 | Std. Mean Difference (IV, Random, 95% CI) | ‐0.20 [‐0.56, 0.15] |
| 3.2 Pregabalin 300 mg/d | 4 | 892 | Std. Mean Difference (IV, Random, 95% CI) | ‐0.16 [‐0.31, ‐0.01] |
| 3.3 Pregabalin 450 mg/d | 4 | 897 | Std. Mean Difference (IV, Random, 95% CI) | ‐0.15 [‐0.30, 0.01] |
| 3.4 Pregabalin 600 mg/d | 3 | 743 | Std. Mean Difference (IV, Random, 95% CI) | ‐0.08 [‐0.25, 0.09] |
| 3.5 Pregabalin flexible 300 or 450 mg/d | 1 | 498 | Std. Mean Difference (IV, Random, 95% CI) | ‐0.31 [‐0.49, ‐0.14] |
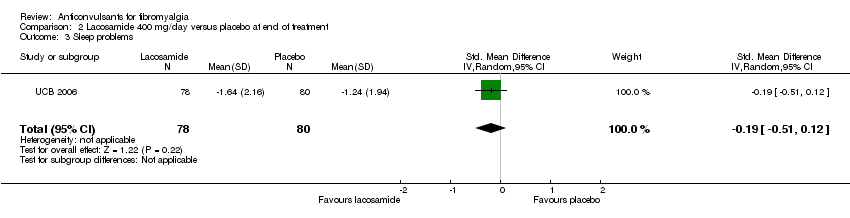
| 4 Sleep problems Show forest plot | 5 | 3193 | Std. Mean Difference (IV, Random, 95% CI) | ‐0.35 [‐0.43, ‐0.27] |
|
| 4.1 Pregabalin 150 mg/d | 1 | 163 | Std. Mean Difference (IV, Random, 95% CI) | ‐0.44 [‐0.80, ‐0.08] |
| 4.2 Pregabalin 300 mg/d | 4 | 897 | Std. Mean Difference (IV, Random, 95% CI) | ‐0.29 [‐0.44, ‐0.14] |
| 4.3 Pregabalin 450 mg/d | 4 | 893 | Std. Mean Difference (IV, Random, 95% CI) | ‐0.45 [‐0.63, ‐0.27] |
| 4.4 Pregabalin 600 mg/d | 3 | 744 | Std. Mean Difference (IV, Random, 95% CI) | ‐0.40 [‐0.57, ‐0.23] |
| 4.5 Pregabalin flexible 300 or 450 mg/d | 1 | 496 | Std. Mean Difference (IV, Random, 95% CI) | ‐0.20 [‐0.37, ‐0.02] |
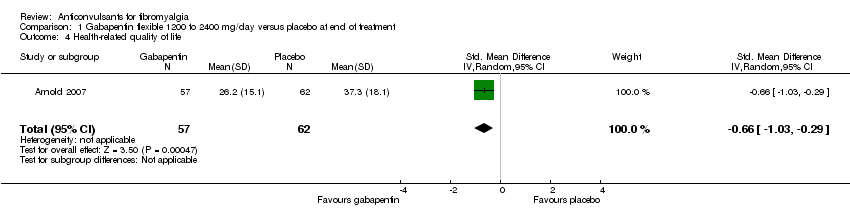
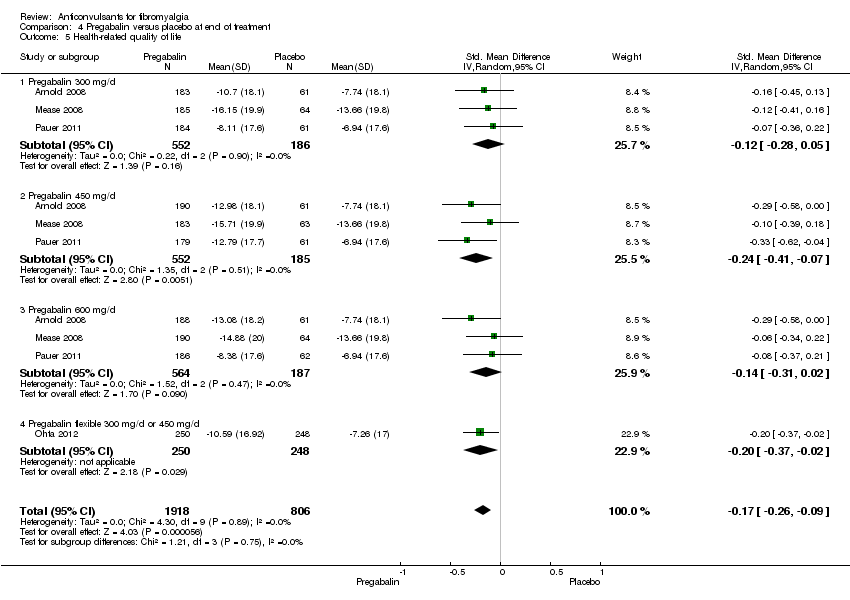
| 5 Health‐related quality of life Show forest plot | 4 | 2724 | Std. Mean Difference (IV, Random, 95% CI) | ‐0.17 [‐0.26, ‐0.09] |
|
| 5.1 Pregabalin 300 mg/d | 3 | 738 | Std. Mean Difference (IV, Random, 95% CI) | ‐0.12 [‐0.28, 0.05] |
| 5.2 Pregabalin 450 mg/d | 3 | 737 | Std. Mean Difference (IV, Random, 95% CI) | ‐0.24 [‐0.41, ‐0.07] |
| 5.3 Pregabalin 600 mg/d | 3 | 751 | Std. Mean Difference (IV, Random, 95% CI) | ‐0.14 [‐0.31, 0.02] |
| 5.4 Pregabalin flexible 300 mg/d or 450 mg/d | 1 | 498 | Std. Mean Difference (IV, Random, 95% CI) | ‐0.20 [‐0.37, ‐0.02] |
| 6 Withdrawal due to adverse events Show forest plot | 5 | 3259 | Risk Ratio (IV, Random, 95% CI) | 1.68 [1.36, 2.07] |
|
| 6.1 Pregabalin 150 mg/d | 1 | 175 | Risk Ratio (IV, Random, 95% CI) | 1.19 [0.35, 4.08] |
| 6.2 Pregabalin 300 mg/d | 4 | 917 | Risk Ratio (IV, Random, 95% CI) | 1.54 [1.02, 2.34] |
| 6.3 Pregabalin 450 mg/d | 4 | 917 | Risk Ratio (IV, Random, 95% CI) | 2.02 [1.32, 3.09] |
| 6.4 Pregabalin 600 mg/d | 3 | 752 | Risk Ratio (IV, Random, 95% CI) | 2.53 [1.65, 3.86] |
| 6.5 Pregabalin flexible 300 mg/d or 450 mg/d | 1 | 498 | Risk Ratio (IV, Random, 95% CI) | 1.01 [0.65, 1.57] |
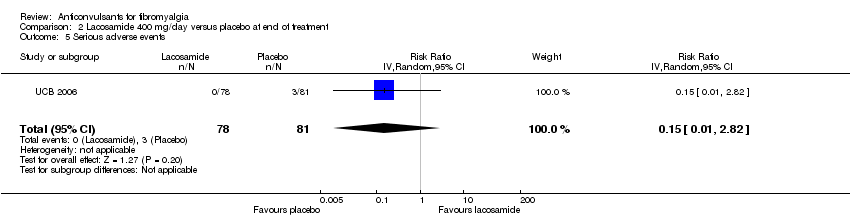
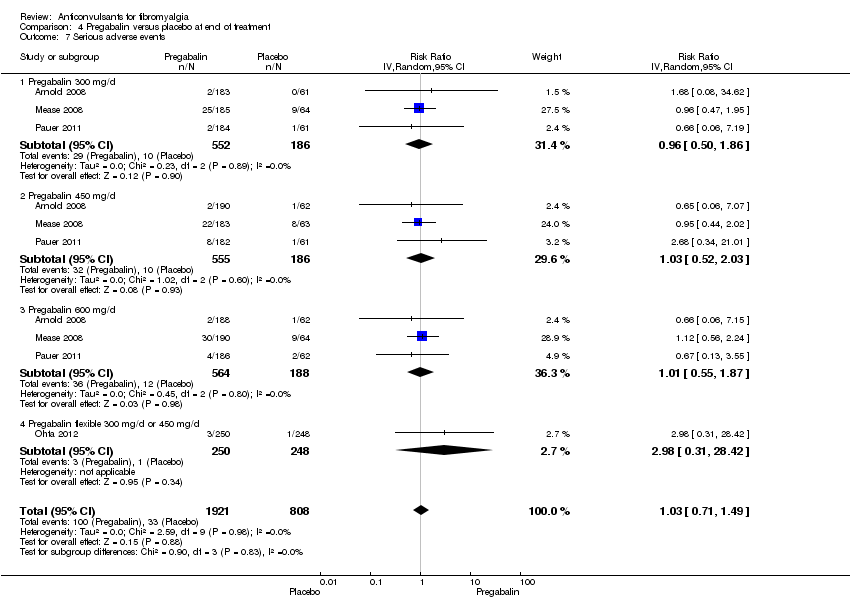
| 7 Serious adverse events Show forest plot | 4 | 2729 | Risk Ratio (IV, Random, 95% CI) | 1.03 [0.71, 1.49] |
|
| 7.1 Pregabalin 300 mg/d | 3 | 738 | Risk Ratio (IV, Random, 95% CI) | 0.96 [0.50, 1.86] |
| 7.2 Pregabalin 450 mg/d | 3 | 741 | Risk Ratio (IV, Random, 95% CI) | 1.03 [0.52, 2.03] |
| 7.3 Pregabalin 600 mg/d | 3 | 752 | Risk Ratio (IV, Random, 95% CI) | 1.01 [0.55, 1.87] |
| 7.4 Pregabalin flexible 300 mg/d or 450 mg/d | 1 | 498 | Risk Ratio (IV, Random, 95% CI) | 2.98 [0.31, 28.42] |
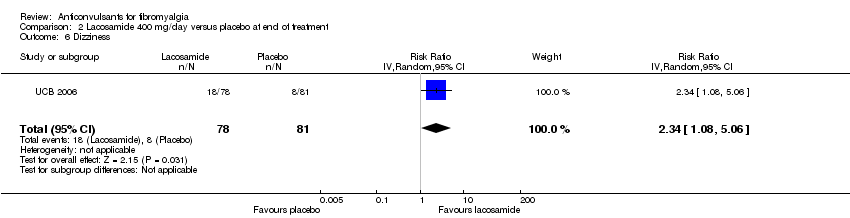
| 8 Dizziness Show forest plot | 5 | 3257 | Risk Ratio (IV, Random, 95% CI) | 3.77 [3.06, 4.63] |
|
| 8.1 Pregabalin 150 mg/d | 1 | 175 | Risk Ratio (IV, Random, 95% CI) | 2.44 [0.91, 6.54] |
| 8.2 Pregabalin 300 mg/d | 4 | 916 | Risk Ratio (IV, Random, 95% CI) | 3.11 [2.09, 4.65] |
| 8.3 Pregabalin 450 mg/d | 4 | 917 | Risk Ratio (IV, Random, 95% CI) | 3.95 [2.68, 5.82] |
| 8.4 Pregabalin 600 mg/d | 3 | 751 | Risk Ratio (IV, Random, 95% CI) | 4.00 [2.65, 6.03] |
| 8.5 Pregabalin flexible 300 mg/d or 450 mg/d | 1 | 498 | Risk Ratio (IV, Random, 95% CI) | 4.89 [2.89, 8.28] |
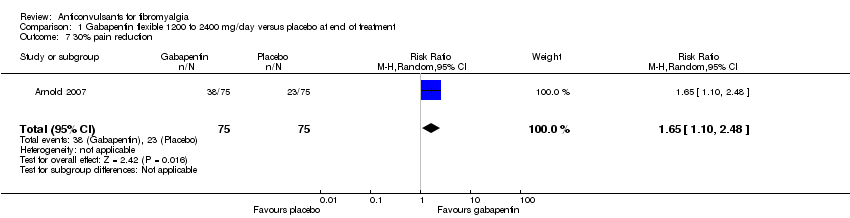
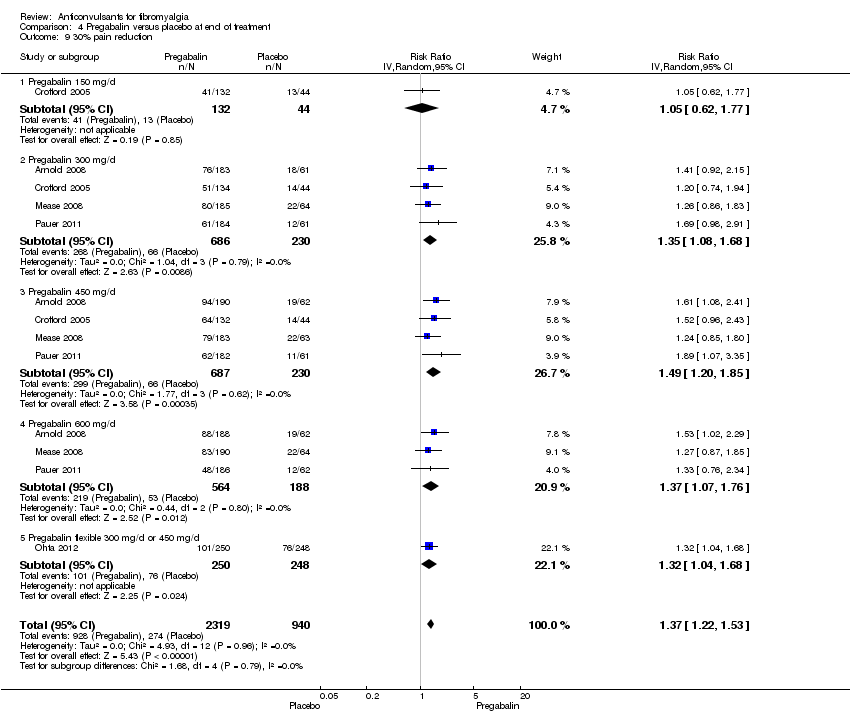
| 9 30% pain reduction Show forest plot | 5 | 3259 | Risk Ratio (IV, Random, 95% CI) | 1.37 [1.22, 1.53] |
|
| 9.1 Pregabalin 150 mg/d | 1 | 176 | Risk Ratio (IV, Random, 95% CI) | 1.05 [0.62, 1.77] |
| 9.2 Pregabalin 300 mg/d | 4 | 916 | Risk Ratio (IV, Random, 95% CI) | 1.35 [1.08, 1.68] |
| 9.3 Pregabalin 450 mg/d | 4 | 917 | Risk Ratio (IV, Random, 95% CI) | 1.49 [1.20, 1.85] |
| 9.4 Pregabalin 600 mg/d | 3 | 752 | Risk Ratio (IV, Random, 95% CI) | 1.37 [1.07, 1.76] |
| 9.5 Pregabalin flexible 300 mg/d or 450 mg/d | 1 | 498 | Risk Ratio (IV, Random, 95% CI) | 1.32 [1.04, 1.68] |
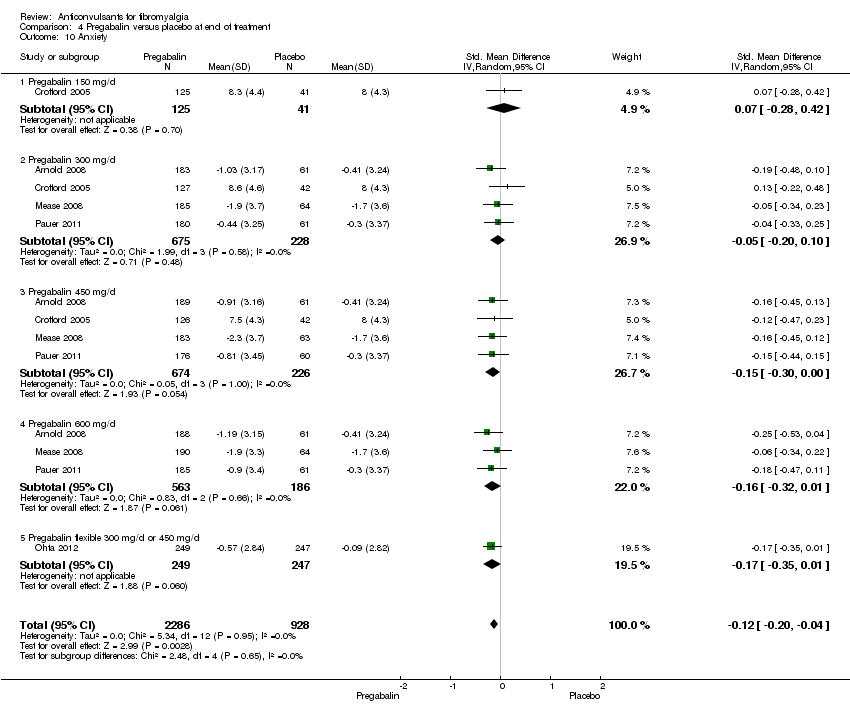
| 10 Anxiety Show forest plot | 5 | 3214 | Std. Mean Difference (IV, Random, 95% CI) | ‐0.12 [‐0.20, ‐0.04] |
|
| 10.1 Pregabalin 150 mg/d | 1 | 166 | Std. Mean Difference (IV, Random, 95% CI) | 0.07 [‐0.28, 0.42] |
| 10.2 Pregabalin 300 mg/d | 4 | 903 | Std. Mean Difference (IV, Random, 95% CI) | ‐0.05 [‐0.20, 0.10] |
| 10.3 Pregabalin 450 mg/d | 4 | 900 | Std. Mean Difference (IV, Random, 95% CI) | ‐0.15 [‐0.30, 0.00] |
| 10.4 Pregabalin 600 mg/d | 3 | 749 | Std. Mean Difference (IV, Random, 95% CI) | ‐0.16 [‐0.32, 0.01] |
| 10.5 Pregabalin flexible 300 mg/d or 450 mg/d | 1 | 496 | Std. Mean Difference (IV, Random, 95% CI) | ‐0.17 [‐0.35, 0.01] |
| 11 Depression Show forest plot | 5 | 3212 | Std. Mean Difference (IV, Random, 95% CI) | ‐0.09 [‐0.16, ‐0.01] |
|
| 11.1 Pregabalin 150 mg/d | 1 | 165 | Std. Mean Difference (IV, Random, 95% CI) | ‐0.10 [‐0.45, 0.25] |
| 11.2 Pregabalin 300 mg/d | 4 | 902 | Std. Mean Difference (IV, Random, 95% CI) | ‐0.05 [‐0.20, 0.10] |
| 11.3 Pregabalin 450 mg/d | 4 | 900 | Std. Mean Difference (IV, Random, 95% CI) | ‐0.13 [‐0.28, 0.02] |
| 11.4 Pregabalin 600 mg/d | 3 | 749 | Std. Mean Difference (IV, Random, 95% CI) | ‐0.06 [‐0.23, 0.10] |
| 11.5 Pregabalin flexible 300 mg/d or 450 mg/d | 1 | 496 | Std. Mean Difference (IV, Random, 95% CI) | ‐0.09 [‐0.27, 0.08] |
| 12 Disability Show forest plot | 5 | 3145 | Std. Mean Difference (IV, Random, 95% CI) | ‐0.01 [‐0.11, 0.09] |
|
| 12.1 Pregabalin 150 mg/d | 1 | 166 | Std. Mean Difference (IV, Random, 95% CI) | 0.11 [‐0.24, 0.47] |
| 12.2 Pregabalin 300 mg/d | 4 | 879 | Std. Mean Difference (IV, Random, 95% CI) | 0.04 [‐0.11, 0.20] |
| 12.3 Pregabalin 450 mg/d | 4 | 888 | Std. Mean Difference (IV, Random, 95% CI) | 0.00 [‐0.17, 0.18] |
| 12.4 Pregabalin 600 mg/d | 3 | 714 | Std. Mean Difference (IV, Random, 95% CI) | 0.03 [‐0.14, 0.21] |
| 12.5 Pregabalin flexible 300 mg/d or 450 mg/d | 1 | 498 | Std. Mean Difference (IV, Random, 95% CI) | ‐0.29 [‐0.47, ‐0.12] |
| 13 Patient Global Impression of Change 'much' or 'very much' improved Show forest plot | 5 | 3183 | Risk Ratio (IV, Random, 95% CI) | 1.38 [1.23, 1.55] |
|
| 13.1 Pregabalin 150 mg/d | 1 | 175 | Risk Ratio (IV, Random, 95% CI) | 1.30 [0.74, 2.29] |
| 13.2 Pregabalin 300 mg/d | 4 | 886 | Risk Ratio (IV, Random, 95% CI) | 1.25 [0.99, 1.57] |
| 13.3 Pregabalin 450 mg/d | 4 | 892 | Risk Ratio (IV, Random, 95% CI) | 1.54 [1.15, 2.06] |
| 13.4 Pregabalin 600 mg/d | 3 | 734 | Risk Ratio (IV, Random, 95% CI) | 1.37 [1.06, 1.76] |
| 13.5 Pregabalin flexible 300 mg/d or 450 mg/d | 1 | 496 | Risk Ratio (IV, Random, 95% CI) | 1.44 [1.11, 1.87] |