Anticonvulsivos para fibromialgia
Resumen
Antecedentes
La fibromialgia (FM) es una afección crónica clínicamente bien definida y de etiología desconocida que se caracteriza por dolor crónico difundido que a menudo coexiste con trastornos del sueño y fatiga. Los pacientes a menudo informan niveles altos de discapacidad y deterioro en la calidad de vida relacionada con la salud (CVRS). El tratamiento farmacológico se centra en la reducción de los síntomas clave y la discapacidad, y en la mejoría de la CVRS. Los anticonvulsivos (fármacos antiepilépticos) son fármacos utilizados con frecuencia para el tratamiento de los síndromes de dolor crónico.
Objetivos
Evaluar los efectos beneficiosos y perjudiciales de los anticonvulsivos para el tratamiento de los síntomas de FM.
Métodos de búsqueda
Se hicieron búsquedas de estudios publicados en el Registro Cochrane Central de Ensayos Controlados (Cochrane Central Register of Controlled Trials) (CENTRAL) (número 8, 2013), MEDLINE (1966 hasta agosto 2013), PsycINFO (1966 hasta agosto 2013), SCOPUS (1980 hasta agosto 2013) y en las listas de referencias de artículos revisados y en www.clinicaltrials.gov (hasta agosto 2013) de ensayos no publicados.
Criterios de selección
Se seleccionaron los ensayos controlados aleatorios de cualquier formulación de anticonvulsivos utilizados para el tratamiento de los pacientes con FM de cualquier edad.
Obtención y análisis de los datos
Dos autores de la revisión extrajeron de forma independiente los datos de todos los estudios incluidos y evaluaron el riesgo de sesgo de los estudios. Las discrepancias se resolvieron mediante discusión.
Resultados principales
Se incluyeron ocho estudios: cinco de la pregabalina, uno de la gabapentina, uno de la lacosamida y uno del levetiracetam. Se incluyó un total de 2480 pacientes en los grupos de anticonvulsivos y de 1099 pacientes en los grupos de placebo. La fase mediana de tratamiento de los estudios fue de 13 semanas. La cantidad y la calidad de las pruebas fueron insuficientes para establecer conclusiones definitivas sobre la eficacia y la seguridad de la gabapentina, la lacosamida y el levetiracetam en la FM. La cantidad y la calidad de las pruebas fueron suficientes para establecer conclusiones definitivas sobre la eficacia y la seguridad de la pregabalina en la FM. Por lo tanto, la revisión se centró en la interpretación de las pruebas sobre la pregabalina debido a la mayor certidumbre acerca de sus efectos y su mayor relevancia para la práctica clínica. Todos los estudios de pregabalina tenían bajo riesgo de sesgo. El informe sobre una reducción del 50% o mayor del dolor fue más frecuente con el uso de pregabalina que con placebo (cociente de riesgos [CR] 1,59; intervalo de confianza [IC] del 95%: 1,33 a 1,90; número necesario a tratar para un resultado beneficioso adicional [NNTB] de 12; IC del 95%: 9 a 21). El número de pacientes que informó mejorías significativas o muy significativas fue mayor con pregabalina que con placebo (CR 1,38; IC del 95%: 1,23 a 1,55; NNTB = 9; IC del 95%: 7 a 15). La pregabalina no redujo significativamente la fatiga (DME ‐0,17; IC del 95%: ‐0,25 a ‐0,09; mejoría absoluta del 2,7% en una escala de 1 a 50) en comparación con placebo. La pregabalina tuvo un beneficio pequeño sobre el placebo en cuanto a la reducción de los trastornos del sueño de 6,2 puntos menos en una escala de 0 a 100 (diferencia de medias estandarizada [DME] ‐0,35; IC del 95%: ‐0,43 a ‐0,27). La tasa de abandonos debido a los eventos adversos fue mayor con el uso de pregabalina que con el uso de placebo (CR 1,68; IC del 95%: 1,36 a 2,07; número necesario a tratar para un resultado perjudicial adicional [NNTD] de 13; IC del 95%: 9 a 23). No hubo diferencias significativas en los eventos adversos graves entre el uso de pregabalina y de placebo (CR 1,03; IC del 95%: 0,71 a 1,49). Se informaron mareos como un evento adverso más frecuente con el uso de pregabalina que con el uso de placebo (CR 3,77; IC del 95%: 3,06 a 4,63; NNTD 4; IC del 95%: 3 a 5).
Conclusiones de los autores
El anticonvulsivo pregabalina demostró un beneficio pequeño sobre el placebo en cuanto a la reducción del dolor y los trastornos del sueño. Se demostró que el uso de pregabalina no redujo significativamente la fatiga en comparación con placebo. Las tasas de abandonos del estudio debido a los eventos adversos fueron mayores con el uso de pregabalina en comparación con placebo. Los mareos fueron un evento adverso particularmente frecuente observado con el uso de pregabalina. En el momento en que se redactó esta revisión, la pregabalina era el único fármaco anticonvulsivo aprobado para el tratamiento de la FM en los EE.UU. y en otros 25 países no europeos. Sin embargo, la pregabalina no se ha aprobado para el tratamiento de la FM en Europa. La cantidad y la calidad de las pruebas fueron insuficientes para establecer conclusiones definitivas sobre la eficacia y la seguridad de la gabapentina, la lacosamida y el levetiracetam en la FM.
Resumen en términos sencillos
Anticonvulsivos para fibromialgia
Los investigadores de la Colaboración Cochrane realizaron una revisión de la investigación acerca de los efectos de los anticonvulsivos (fármacos antiepilépticos) sobre la fibromialgia (FM). Después de buscar todos los estudios relevantes, se encontraron ocho estudios con un máximo de 3579 personas. Los anticonvulsivos que estudiaron fueron gabapentina, lacosamida, levetiracetam y pregabalina. Se encontraron conclusiones fiables sólo en cuanto a la pregabalina.
Resultados clave: pregabalina en comparación con medicación falsa después de un promedio de 13 semanas
‐ La pregabalina reduce levemente el dolor y los trastornos del sueño.
‐ La pregabalina reduce levemente la fatiga.
‐ La pregabalina aumenta los efectos secundarios de la medicación, en particular los mareos.
‐ La pregabalina no difiere de la medicación falsa en cuanto a los efectos secundarios graves.
Los efectos secundarios posibles pueden incluir somnolencia, aumento de peso, inflamación en las piernas, visión borrosa y problemas de coordinación. Las complicaciones poco frecuentes pueden incluir angio‐edema (inflamación justo debajo de la superficie de la piel, en la mayoría de los casos alrededor de los labios y los ojos), alergias y enfermedades del sistema inmunológico, empeoramiento de la insuficiencia cardíaca, deterioro en la capacidad del paciente de manejar u operar maquinaria, y abuso o dependencia de pregabalina. Los efectos secundarios graves, como los pensamientos suicidas, son muy poco frecuentes.
¿Qué es la FM y qué son los anticonvulsivos?
Los pacientes con FM sufren dolor crónico difundido, trastornos del sueño y fatiga. Actualmente la FM es incurable. Los tratamientos tienen como objetivo aliviar los síntomas y mejorar la calidad de vida.
Los anticonvulsivos son fármacos que ayudan a los pacientes con crisis epilépticas. Las neuronas son células que envían mensajes al cerebro. Por ejemplo, algunas neuronas envían mensajes sobre la luz, el sonido o el tacto al cerebro. Si hay algún problema y las neuronas envían demasiados mensajes rápidamente, luego los pacientes pueden sentir dolor más intenso. Los anticonvulsivos pueden ayudar a ralentizar las neuronas de la médula espinal y el cerebro. Algunos anticonvulsivos pueden reducir el dolor y los trastornos del sueño en el dolor crónico debido al daño nervioso y pueden estabilizar el estado de ánimo en los pacientes con ansiedad y trastornos depresivos. Los pacientes con fibromialgia pueden presentar una mayor actividad cerebral y reacciones más fuertes al estímulo de los sentidos, para lo cual los anticonvulsivos podrían ser de ayuda. La pregabalina está aprobada para el uso en pacientes con FM en la mayoría de los países de América del Norte, América del Sur y Asia, pero no en Europa.
Mejor cálculo de lo que les sucede a los pacientes con FM cuando se les administra pregabalina
:
‐ Nueve pacientes más de cada 100 que recibieron pregabalina lograron una reducción del 50% o mayor del dolor en comparación con los pacientes que recibieron la medicación falsa (mejoría absoluta del 9%).
‐ 23 de cada 100 pacientes presentaron una reducción del dolor del 50% o mayor cuando recibieron pregabalina en comparación con 14 de cada 100 pacientes cuando recibieron una medicación falsa.
:
‐ 11 pacientes más de cada 100 que recibieron pregabalina presentaron una mejoría significativa y muy significativa a nivel global en comparación con los pacientes que recibieron la medicación falsa (mejoría absoluta del 12%).
‐ 39 de cada 100 pacientes presentaron mejorías significativas y muy significativas a nivel global cuando recibieron pregabalina en comparación con 28 de cada 100 pacientes cuando recibieron una medicación falsa.
:
‐ Los pacientes que recibieron pregabalina informaron una reducción leve de la fatiga (mejoría absoluta del 2,7%) en comparación con los pacientes que recibieron una medicación falsa.
‐ Los pacientes que recibieron pregabalina calificaron la fatiga como de 34,6 en comparación con 35,6 en los pacientes que recibieron una medicación falsa.
:
‐ Los pacientes que recibieron pregabalina informaron una reducción de los trastornos del sueño (mejoría absoluta del 6,2%) en comparación con los pacientes que recibieron una medicación falsa.
‐ Los pacientes que recibieron pregabalina calificaron los trastornos del sueño como de 54,9 en comparación con 58,6 en los pacientes que recibieron la medicación falsa
:
‐ Siete pacientes más de cada 100 interrumpieron el uso de pregabalina en comparación con la medicación falsa debido a los efectos secundarios (deterioro absoluto del 8%).
‐ 18 pacientes de cada 100 que recibieron anticonvulsivos interrumpieron el uso de la medicación debido a los efectos secundarios en comparación con 11 pacientes de cada 100 que recibieron una medicación falsa.
:
‐ No hubo diferencias entre la pregabalina (5,2%) y la medicación falsa (4,1%) en cuanto al número de eventos adversos graves.
:
‐ 24 pacientes más de cada 100 informaron mareos como un efecto secundario de la pregabalina (deterioro absoluto del 28%).
‐ 35 pacientes de cada 100 que recibieron pregabalina informaron mareos como un efecto secundario en comparación con 11 pacientes de cada 100 que recibieron una medicación falsa.
Authors' conclusions
Summary of findings
| Pregabalin versus placebo at final treatment for fibromyalgia | ||||||
| Patient or population: People with fibromyalgia | ||||||
| Outcomes | Illustrative comparative risks* (95% CI) | Relative effect | No of participants | Quality of the evidence | Comments | |
| Assumed risk | Corresponding risk | |||||
| Control | Anticonvulsants versus placebo at final treatment | |||||
| 50% pain reduction | 137 per 1000 | 217 per 1000 | RR 1.59 | 3256 | ⊕⊕⊕⊕ | Absolute risk difference (fewer pain) 8% (95% CI 6% to 11%) Relative per cent improvement 59% (95% CI 33% to 90%) NNTB 12 (95% CI 9 to 21) |
| Patient Global Impression of Change of 'much' or 'very much' improved | 279 per 1000 | 385 per 1000 | RR 1.38 | 3183 | ⊕⊕⊕⊕ | Absolute risk difference (more global impression of 'much' and 'very much' improved) 12% (95% CI 4% to 20%) Relative per cent improvement 38% (95% CI 23% to 55%) NNTB 9 (95% CI 7 to 15) |
| Fatigue (1‐50 scale) Higher scores indicate higher fatigue levels | MAF baseline fatigue score control group 35.6 (standard deviation 8.0) ** | The mean fatigue in the intervention groups was | 3195 | ⊕⊕⊕⊕ | SMD ‐0.17 (‐0.25 to ‐0.09) 2.7% (95% CI 1.4% to 4.0%) fewer points on the fatigue scale (absolute improvement) 3.8% (95% CI 2.0% to 5.6%) relative improvement NNTB 13 (95% CI 9 to 25) | |
| Sleep problems (0‐100 scale). Higher scores indicate more sleep problems | MOS baseline overall sleep problem index control group 58.5 (17.8) *** | The mean sleep problems in the intervention groups was | 3139 | ⊕⊕⊕⊕ | SMD ‐0.35 (‐0.43 to ‐0.27) 6.2% (95% CI 4.8% to 7.7%) fewer points on the sleep problem scale (absolute improvement) 10.6% (95% CI 82.% to 13.1%) relative improvement NNTB 7 (95% CI 5 to 8) | |
| Withdrawal due to adverse events | 110 per 1000 | 185 per 1000 | RR 1.68 | 3259 | ⊕⊕⊕⊕ | Absolute risk difference (more withdrawal due to adverse events) 8% (95% CI 5% to 12%) Relative per cent worsening 68% (95% CI 36% to 107%) NNTH 13 (95% CI 9 to 23) |
| Serious adverse events | 41 per 1000 | 42 per 1000 | RR 1.03 | 2729 | ⊕⊕⊕⊝ | Absolute risk difference 0 (95% CI ‐1 to 1) Relative per cent change 0 (95% CI ‐1 to 1) Not statistically significant |
| Dizziness reported to be an adverse event | 93 per 1000 | 350 per 1000 | RR 3.77 | 3257 | ⊕⊕⊕⊕ | Absolute risk difference (more dizziness) 28% (95% CI 24% to 32%) Relative per cent worsening 277% (95% CI 206% to 363%) NNTH 4 (95% CI 3 to 5) |
| *The basis for the assumed risk (e.g. the median control group risk across studies) is provided in footnotes. The corresponding risk (and its 95% confidence interval) is based on the assumed risk in the comparison group and the relative effect of the intervention (and its 95% CI). CI: confidence interval; MAF: Multidimensional Assessment of Fatigue; MOS: Medical Outcomes Study; NNTB: number needed to treat for an additional beneficial outcome; NNTH: number needed to treat for an additional harmful outcome; NRS: numeric rating scale; RR: risk ratio; SMD: standardised mean difference. | ||||||
| GRADE Working Group grades of evidence | ||||||
| 1 Frequency of serious adverse events not reported by one study. ** Arnold 2008: n = 190 participants; MAF (NRS 1‐50). *** Arnold 2008: n = 190 participants; MOS Overall Sleep Problems Index (NRS 0‐100). | ||||||
Background
Fibromyalgia (FM) is a common disorder occurring in all populations across the world. It has been estimated that five million adults have FM in the US (Lawrence 2008). The estimated overall prevalence of FM in the general population in European countries ranges from 2.1% (Wolfe 2013a) to 2.9% (Branco 2010). People often report high disability levels and poor quality of life, and make extensive use of medical care (Marschall 2011; Winkelmann 2011; Wolfe 1997). People with FM use a wide range of different types of drugs and non‐pharmacological therapies (Bennett 2007; Bernardy 2013; Birse 2012; Corrigan 2012; Deare 2013; Derry 2012; Eccleston 2012; Häuser 2012a; Häuser 2013; Hearn 2012; Moore 2012a; Seidel 2013; Tort 2012; Wiffen 2013a; Wiffen 2013b).
Description of the condition
The key symptoms of FM are chronic widespread pain associated with sleep problems, cognitive dysfunction and physical fatigue (Häuser 2008; Wolfe 2010). Lacking a specific laboratory test, diagnosis is established by the patient's report of the key symptoms and a physician's exclusion of other illnesses that would account for the key symptoms (Eich 2012a; Wolfe 2010). For clinical diagnosis, the American College of Rheumatology (ACR) 1990 classification criteria (Wolfe 1990), the ACR 2010 preliminary diagnostic criteria (Wolfe 2010), and the Fibromyalgia Survey Diagnostic Criteria (Wolfe 2011a), can be used.
A biopsychosocial model of factors predisposing, triggering and perpetuating FM symptoms has been suggested (Sommer 2012). Polymorphisms of genes in the serotoninergic, dopaminergic and catecholaminergic systems (Buskila 2009), and physical and sexual abuse in childhood and adolescence (Häuser 2011a), predispose to FM. Social disadvantage, psychological and physical stress, and somatic diseases such as rheumatoid arthritis trigger the development of FM symptoms (Buskila 2009; Wolfe 2011). A small fibre pathology was detected in people with FM (Üçeyler 2013). Depressive disorders have a negative impact on the clinical outcome of FM (Lange 2010). Several factors, such as alterations of central pain pathways, hyporeactivity of the hypothalamus‐pituitary‐adrenal axis, increased systemic pro‐inflammatory and reduced anti‐inflammatory cytokine profiles, and disturbances in the dopaminergic and serotonergic systems have been associated with FM pathophysiology. However, none of these factors has been demonstrated to have a causal relationship to FM or to be specific for FM (Sommer 2012). The current pathophysiology concept views FM as the result of alterations in central processing of sensory input and its cognitive‐emotional appraisal, along with aberrations in the endogenous inhibition of pain (Buskila 2009). Exposure to physical or psychosocial stressors as outlined above may contribute to dysfunctional pain processing (Bradley 2009; Sommer 2012).
Since specific treatment aimed at altering the pathogenesis is not possible, drug therapy focusing on symptom reduction is widely employed.
Description of the intervention
Central pain conditions, in which persistent pain occurs in the absence of objective anatomic abnormality, are presumed to respond best to centrally active neuromodulating agents such as antidepressants and anticonvulsants (Phillips 2011). Anticonvulsants reduce the release of several neurotransmitters and peptides including glutamate, noradrenaline (norepinephrine) and substance P (Dooley 2007). The reduced neurotransmitter release is presumed to account for the analgesic, anticonvulsant and anxiolytic effects of anticonvulsants.
How the intervention might work
Augmented central nervous system processing of stimuli might be one pathophysiological mechanism underlying FM (Gracely 2011). Pregabalin and gabapentin are structural analogues of the neurotransmitter gamma‐aminobutyric acid (GABA). These second‐generation anticonvulsants are alpha‐2‐delta ligands that bind to, and modulate, voltage‐gated calcium channels. By reducing calcium influx at nerve terminals, both drugs diminish the release of several neurotransmitters, including glutamate, noradrenaline and substance P. This mechanism is assumed to be the basis for the analgesic, anticonvulsant and anxiolytic actions of the drugs (Dooley 2007). Both drugs differ in their pharmacokinetic and pharmacodynamic characteristics (Bockbrader 2010). Lacosamide, another anticonvulsant, is described as a functionalised amino acid molecule that selectively enhances the slow inactivation of voltage‐gated sodium channels and interacts with the collapsin‐response mediator protein‐2. Voltage‐gated sodium channels play an important role in the excitability of nociceptors (Beydoun 2009). The mode of action of the anticonvulsant, levetiracetam, is not fully elucidated, but it has been found to target high‐voltage, N‐type calcium channels, as well as the synaptic vesicle protein 2A (Ulloa 2009).
Why it is important to do this review
Previous Cochrane reviews have studied the efficacy and safety of gabapentin (Moore 2011), pregabalin (Moore 2009) and lacosamide (Hearn 2012) in chronic neuropathic pain and FM in adults. These reviews did not report on outcomes relevant for FM such as fatigue, sleep problems and psychological symptoms. The approach of combining different neuropathic pain syndromes and FM is continued in the protocol on antiepileptic drugs for neuropathic pain and FM (Wiffen 2013a).
There is a transatlantic difference in the approval of the anticonvulsant pregabalin as a treatment of FM by regulatory authorities (Briley 2010). Pregabalin has been approved by the US Food and Drug Administration (FDA) and by the Japanese Pharmaceutical and Medical Devices Agency but not by the European Medical Agency (EMA) for the management of FM. The FDA stated that the sponsors of pregabalin had provided adequate evidence of the benefits to support the indication for the management of FM (FDA 2007). The EMA denied clinically relevant effects for pregabalin in European patients. The adverse effects profile was considered to outweigh the benefits, given the lack of robust evidence of efficacy (European Medicines Agency 2009). Because of the divergent appraisals of pregabalin by the FDA and EMA, we saw the need to evaluate the benefits and harms of anticonvulsants according to more recently established methodological standards of pain medicine (Moore 2010b), to assist people with FM and doctors to share decision making on pharmacological treatment options.
Objectives
To assess the benefits and harms of anticonvulsant use in the treatment of FM.
Methods
Criteria for considering studies for this review
Types of studies
We included randomised controlled trials (RCTs), double‐blind, with anticonvulsants and with a study duration of eight weeks and longer. We required a parallel design. We excluded RCTs with a cross‐over or an enriched enrolment withdrawal design. We required full journal publication, with the exception of online clinical trial result summaries of otherwise unpublished clinical trials and abstracts with data for analysis. We excluded studies that were non‐randomised, studies of experimental pain, case reports or series and clinical observations.
Types of participants
Participants of any age having a clinical diagnosis of FM by any published standardised criteria (Häuser 2010a; Wolfe 1990; Wolfe 2010; Wolfe 2011a).
Types of interventions
We included trials with anticonvulsants at any dose, administered by any route to reduce FM symptoms compared with placebo or another active drug administered by any route.
We allowed co‐interventions, such as physical therapy or other drugs different from those being assessed in the trial.
We considered the following anticonvulsants used in pain therapy for this review (Attal 2010): carbamazepine, clonazepam, felbamate, gabapentin, hydantoin, levetiracetam, lacosamide, lamotrigine, oxcarbazepine, pregabalin, tiagabine, topiramate, valproic acid and vigabatrin.
Types of outcome measures
We followed some suggestions of the OMERACT (Outcome Measures in Rheumatology) Fibromyalgia Working Group on the key domains of FM (Mease 2009); the Initiative of Methods, Measurement and Pain Assessment in Clinical trials (IMMPACT) (Dworkin 2009); and of best practice in the reporting of systematic reviews in chronic pain (Moore 2010a), for selecting outcome measures. Furthermore, we selected a specific adverse event, namely self reported dizziness, as a measure of tolerability: dizziness had been reported to be the most frequent side effect of pregabalin (Straube 2010), and to be a major symptom of 'fibro fog' (Centers for Disease Control and Prevention 2011).
We derived the outcomes of efficacy (benefits) from the key domains as defined by a consensus among experts and people with FM (Mease 2009). We assessed harms by the safety and tolerability of anticonvulsants. We defined safety as the frequency of serious adverse events independent of any determination of study‐relatedness by the investigators. We defined tolerability by the frequency of study withdrawals due to adverse event and by the frequency of dizziness reported as adverse event.
Major outcomes
-
Self reported 50% or greater pain reduction: we used the following preference a. electronic diaries, paper diaries; b. 24‐hour recall pain, weekly recall pain (visual analogue scale (VAS)); c. paper VAS, paper numeric 11‐point ordinal numeric rating scale (NRS); d. combined pain measures.
-
Patient‐perceived improvement (Patient Global Impression of Change (PGIC)): number of participants who reported to be 'much' or 'very much' improved.
-
Self reported fatigue: we used the following preference: validated combined scales (e.g. Multidimensional Fatigue Inventory (MFI), Fatigue Severity Scale (FSS), other validated scales (single‐item scales (e.g. Fibromyalgia Impact Questionnaire (FIQ) fatigue VAS).
-
Self reported sleep problems: we used the following preference: validated combined scales (e.g. Medical Outcomes Study (MOS) Sleep Problem Index, other validated combined scales), single‐item assessment (e.g. FIQ sleep VAS, other single‐item scales).
-
Safety: serious adverse events.
-
Tolerability:
-
withdrawals due to adverse event;
-
specific adverse event: dizziness.
-
Minor outcomes
-
Self reported pain intensity.
-
Self reported 30% or greater pain reduction.
-
Self reported health‐related quality of life (HRQoL) measured by the total score of the FIQ.
-
Self reported depression: we used the following preference: validated combined scales (Hospital Anxiety and Depression Scale (HADS), Beck Depression Inventory (BDI), other validated scales), single‐item assessment (e.g. FIQ subscale for depression, other single‐item scales).
-
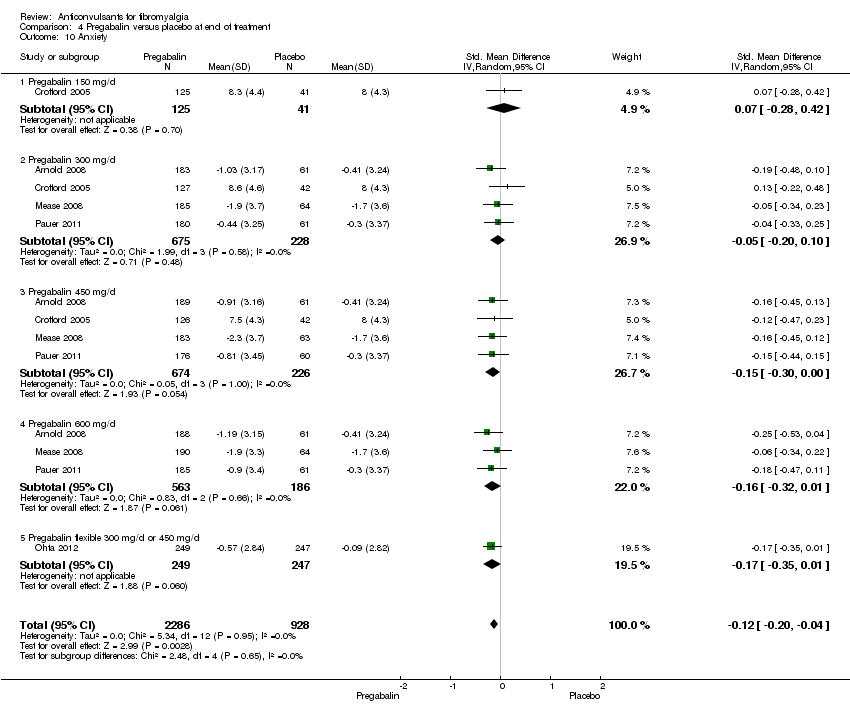
Self reported anxiety: we used the following preference: validated combined scales (HADS, BAI Beck Anxiety Inventory, State Trait Anxiety Inventory (STAI), other validated scales), single‐item scale (FIQ anxiety VAS, other single‐item scales).
-
Self reported disability (impairment of physical function): we used the following preference: validated combined scale (Short‐Form Health Survey (SF‐36) Physical Functioning, FIQ physical impairment, Brief Pain Inventory (BPI) interference from pain, other validated combined scales), single‐item scale.
Search methods for identification of studies
Electronic searches
We performed an electronic search in the Cochrane Central Register of Controlled Trials (CENTRAL) (Issue 8, 2013), MEDLINE accessed through PubMed (1966 to August 2013) and SCOPUS accessed through Ovid (1980 to August 2013). The search strategy used for MEDLINE is detailed in Appendix 1. Furthermore, we searched www.clinicaltrials.gov (website of the US National Institute of Health) to August 2013 for unpublished trials. Our search included all languages.
Searching other resources
We searched bibliographies from reviewed articles and we retrieved relevant articles. We contacted content experts to assist in locating other relevant or unpublished studies.
Data collection and analysis
Selection of studies
Two review authors (WH, NÜ) independently scrutinised all the titles and abstracts revealed by the searches and determined which fulfilled the selection criteria. A third review author (CS) verified that the selection had been properly realised.
Data extraction and management
Two review authors (NÜ, WH) extracted data independently into a specially designed data extraction form. We resolved disagreements by discussion if necessary with the third review author (CS). One review author (WH) entered data into Review Manager 5 (RevMan 2012), and a second author (NÜ) checked them. We resolved discrepancies by discussion.
Assessment of risk of bias in included studies
Two review authors (NÜ, WH) independently extracted the following information from reports of included studies into standardised forms: methods (setting, design, duration, follow‐up and statistical analysis of study), participants (mean age, gender, race, inclusion and exclusion criteria), intervention (dosages of anticonvulsants, rescue and co‐medication allowed), type of outcome measures, type of safety assessment and sponsoring. Two review authors (NÜ, WH) independently assessed the risk of bias of each included trial. We resolved disagreements by consensus and, if needed, referral to a third review author (CS). For each included study, we assessed risk of bias against key criteria: random sequence generation (selection bias); allocation concealment (selection bias); incomplete outcome data (attrition bias); selective outcome reporting (reporting bias); blinding of participants and personnel (performance bias); blinding of outcome assessment (detection bias) in accordance with methods recommended by The Cochrane Collaboration (Higgins 2011). We judged each of these criteria explicitly using: 'low risk' of bias, 'high risk' of bias and 'unclear risk' of bias (either lack of information or uncertainty over the potential for bias).
Measures of treatment effect
The effect measures of choice were risk ratio (RR) for dichotomous data and standardised mean difference (SMD) (when different scales were used to measure the same outcomes) for continuous data. We expressed uncertainty using 95% confidence intervals (CIs). We used Cohen's categories to evaluate the magnitude of the effect size, calculated by SMD, with Hedges' g of 0.2 = small, 0.5 = medium and 0.8 = large (Cohen 1988). We labelled g < 0.2 to be a 'not substantial' effect size.
Unit of analysis issues
In the case of multiple anticonvulsant dosage arms compared with one placebo group, we adjusted the number of participants in the placebo group according to the number of participants in the different anticonvulsant‐dosage arms for continuous outcomes.
Dealing with missing data
If both intention‐to‐treat (ITT) and per protocol data were reported, we used ITT data for analysis. The ITT population consisted of participants who were randomised, took the assigned study medication and provided at least one post‐baseline assessment (modified ITT). Wherever possible, we assigned zero improvement to missing participants. However, most studies in chronic pain report results, including responder results, using last observation carried forward. This has been questioned as being potentially biased with outcomes of withdrawal being important outcomes that make last observation carried forward unreliable. Last observation carried forward can lead to overestimation of efficacy, particularly in situations where adverse event withdrawal rates differ between active and control groups. At this time, it is unclear what strategy can actually be used to deal with missing data inside studies (Moore 2012b). We examined and clearly reported imputation strategies.
Where means or standard deviations (SD) were missing, we attempted to obtain these data through contacting trial authors. Where SDs were not available from trial authors, we calculated them from t‐values, CIs or standard errors, where reported in articles (Higgins 2011). Where missing SDs could not be calculated from t values, CIs or standard errors, we calculated them from SDs of studies with the same drug and the same outcome scale by a validated imputation method (Furukawa 2006). Where 30% and 50% pain reduction rates were not reported and not provided on request, we calculated them from means and SDs by a validated imputation method (Furukawa 2005).
Assessment of heterogeneity
We used the I2 statistic for heterogeneity. I2 statistic values less than 25% indicated low, 25% to 50% indicated moderate and 50% or greater indicated substantial heterogeneity (Higgins 2003).
Assessment of reporting biases
We addressed publication bias by visual inspection of funnel plots and tests for funnel plot asymmetry (Begg 1994; Egger 1997), when there were at least 10 studies included in the meta‐analysis (Higgins 2011).
We addressed outcome reporting bias by checking if the means and SDs of all primary and secondary outcomes as outlined in the methods section of the studies published had been reported or had been provided on request.
Data synthesis
We undertook each meta‐analysis using a random‐effects model in Review Manager 5 (RevMan 2012).
Subgroup analysis and investigation of heterogeneity
We performed subgroup comparisons of different dosages of pregabalin since differences in the efficacy and adverse events of different dosages of pregabalin had been reported (Straube 2010). We performed subgroup comparisons of different types of anticonvulsants. We post‐hoc decided not to perform the planned subgroup analysis of studies with American, European, and Japanese participants to test for potential transatlantic differences between the efficacy and adverse events of anticonvulsants for the following reasons. There was no study with only European participants available. We decided to report the results of the comparisons of European and Non‐European participants as presented in the publication and provided on request (Pauer 2011), and by the EMA report (European Medicines Agency 2009). The comparison of American and Japanese participants would have been biased by the different dosage regimens in the studies with fixed dosages in the US studies and flexible dosage in the Japanese study (Ohta 2012).
Sensitivity analysis
The protocol "Antidepressants and centrally active agents for fibromyalgia syndrome" intended to perform sensitivity analyses (different statistical models applied, presence of temporal differences, diagnostic criteria used in the trial, according to the presence/absence of any mental disorder, according to the presence/absence of any concomitant systemic disease) (Nishishinya 2006).
'Summary of findings' table
The quality of evidence was rated by the GRADE approach with GRADEprofiler (Guyatt 2011).
The numbers needed to treat for an additional beneficial (NNTB) or harmful (NNTH) outcome for continuous variables (fatigue, sleep problems) in the 'Summary of findings' table were calculated using the Wells calculator software available at the Cochrane Musculoskeletal Group editorial office, which estimates the proportion of participants who will benefit from treatment from SMDs. The estimation of responders is nearly independent from the minimally important difference (MID) (Norman 2001). We used a minimal clinically important difference of 15% for calculation.
Results
Description of studies
See Characteristics of excluded studies and Characteristics of included studies tables for full description of studies.
Results of the search
We identified 710 studies. We excluded 700 references, as they did not meet inclusion criteria related with the interventions evaluated in this review. We did not find head‐to‐head comparisons of anticonvulsants or of anticonvulsants with other drugs used for FM treatment. We identified 10 studies potentially related with anticonvulsants and obtained the full text for each of them. We excluded two studies after full‐text review (Crofford 2008; Roth 2012) (see Figure 1).

Study flow diagram.
Included studies
We included five studies with pregabalin (Arnold 2008; Crofford 2005; Mease 2008; Ohta 2012; Pauer 2011), and one study each with gabapentin (Arnold 2007), lacosamide (UCB 2006), and levetiracetam (Rowbotham 2012) into analysis.
Study characteristics
Two studies were initiated by investigators and were financially supported by grants from the National Institute of Health (Arnold 2007; Rowbotham 2012). The gabapentin study also received support from the manufacturer (Arnold 2007). The remaining studies were initiated and financed by the manufacturer of pregabalin (Arnold 2008; Crofford 2005; Mease 2008; Ohta 2012; Pauer 2011) and lacosamide (UCB 2006). Conflicts of interest of the study investigators were reported by all except three studies (Pauer 2011; Rowbotham 2012; UCB 2006). All studies were conducted in research centres. The median number of study centres was 44 (range 1 to 84). One study did not report the number of study centres (UCB 2006). Of the five studies with pregabalin, three studies were conducted in the US (Arnold 2008; Crofford 2005; Mease 2008), one study in Japan (Ohta 2012), and one study included countries all over the world except for the US (Europe, Middle America, Australia, Canada, India and Korea) (Pauer 2011). The studies with gabapentin (Arnold 2007), lacosamide (UCB 2006), and levetiracetam (Rowbotham 2012), were conducted in the US. All studies had a parallel design. The median therapy phase of the studies was 13 (range 8 to 15) weeks.
Participant characteristics
The lacosamide study did not report details of inclusion and exclusion criteria and participant characteristics except for age and gender (UCB 2006). Race was not reported by the levetiracetam study (Rowbotham 2012). All studies included people over 18 years old. All studies excluded people with somatic diseases including inflammatory rheumatic diseases. All studies excluded people with unstable or severe mental disorders or psychological conditions. Details regarding the exclusion of people with moderate and severe depressive or anxiety disorders were not reported by any study. All studies excluded people taking centrally acting drugs such as antidepressants. The median of screened participants who were randomised was 64 (range 56 to 76). A total of 2480 participants were included into true drug and of 1099 participants in placebo groups. Middle‐aged white women prevailed in all studies: the median of the mean age was 49 (range 47 to 50) years. The median of the percentage of women was 93% (range 89% to 96%). The median of the percentage of white women was 91% (range 0% to 97%).
Interventions
Four pregabalin studies tested three fixed dosage arms against placebo. Three studies tested 300, 450, and 600 mg/day against placebo (Arnold 2008; Mease 2008; Pauer 2011), and one study tested 150, 300, and 450 mg/day against placebo (Crofford 2005). One study each used a flexible dosage of pregabalin (300 or 450 mg/day) (Ohta 2012), of gabapentin (between 1200 and 2400 mg/day) (Arnold 2007), and of levetiracetam (up to 3000 mg/day) (Rowbotham 2012), according to efficacy and tolerability. The study with lacosamide used a fixed dosage of 400 mg/day (UCB 2006). The rescue medication was paracetamol (acetaminophen) or over‐the‐counter non‐steroidal anti‐inflammatory drugs (dosage not reported) in two trials (Arnold 2007; Ohta 2012), paracetamol less than 4 g/day and aspirin less than 325 mg/day in two trials (Arnold 2008; Crofford 2005), and paracetamol up to 4 g/day (Mease 2008). Three studies did not report details of rescue medication (Pauer 2011; Rowbotham 2012; UCB 2006).
Outcomes
Pain was assessed in one study by the BPI 24 mean pain score (Arnold 2007), in one study by the pain score of the McGill Pain Questionnaire (Crofford 2005), and in the other studies by a 0 to 10 or 0 to 100 NRS daily pain scale. Fatigue was assessed by the sum score of Multidimensional Assessment of Fatigue Questionnaire (MAF) in three studies (Arnold 2008; Crofford 2005; Mease 2008), in the remaining studies by the single‐item fatigue score of the FIQ. Sleep disturbances were assessed by a single‐item sleep interference scale in three studies (Arnold 2007; Rowbotham 2012; UCB 2006), and by the MOS Sleep Problems Index in the remaining studies.Depression and anxiety were assessed in all studies by the HADS except for one study that used the Montgomery Depression Rating Scale (MDRS) for depression and the FIQ single‐item scale for anxiety (Arnold 2007), and one study that used the FIQ single‐item scales (Rowbotham 2012). Disability was assessed by the BPI mean interference scale in two studies (Arnold 2007; UCB 2006), by the FIQ disability scale in one study (Rowbotham 2012), and by the physical functioning scale of the SF‐36 in the remaining studies. HRQoL was assessed in all studies by the FIQ total score. No study assessed sexual function or cognitive disturbances. Tender point pain threshold measurements were only conducted in one study with gabapentin (Arnold 2007).
Excluded studies
We excluded one study with three dosage arms of pregabalin (300, 450 and 600 mg/day), 1051 participants and 26 weeks' double‐blind duration and an enriched enrolment withdrawal design (primary endpoint: loss of therapeutic response, defined as < 30% pain reduction) from meta‐analysis because the outcomes were different from the ones of the studies with a parallel design (Crofford 2008). We excluded one study with cross‐over design and flexible dosages of pregabalin (300 or 450 mg/day) and 115 participants because of short (four weeks) study duration and because of cross‐over design (Roth 2012).
Risk of bias in included studies
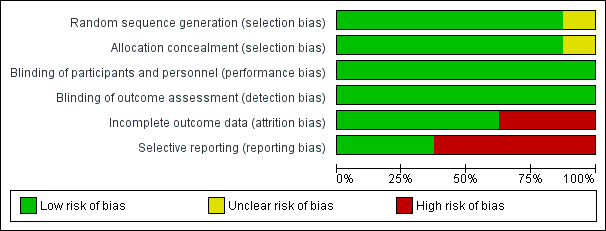
We compiled a 'Risk of bias' table (See Figure 2 and Figure 3 for 'Risk of bias' summary and graph). Most risks of bias were low. The only criteria indicating high risk of bias were incomplete outcome data and selective non‐reporting by some studies. Detailed information regarding risk of bias assessments of every study are given in the Characteristics of included studies table.

Risk of bias graph: review authors' judgements about each risk of bias item presented as percentages across all included studies.

Risk of bias summary: review authors' judgements about each risk of bias item for each included study.
Allocation
Random sequence generation and allocation concealment were adequate in all studies except for one that did not report details (UCB 2006).
Blinding
Blinding of participants, personnel and outcome assessors were adequate in all studies.
Incomplete outcome data
Three studies reported observed cases analyses (Arnold 2007; Rowbotham 2012; UCB 2006). All other studies used ITT analysis. These studies imputed missing data by last observation carried forward method.
Selective reporting
Visual inspection of funnel plots was not indicative for a publication bias. The studies with pregabalin had been registered for the application of an approval for FM management by regulatory agencies. We had searched these databases. Therefore, we do not assume a non‐publication of RCTs with pregabalin in FM.
Arnold 2007 did not report anxiety and fatigue outcomes. Crofford 2005 did not report HRQoL outcomes and serious adverse events. Mease 2008 did not report the details of disability outcomes. Rowbotham 2012 did not report fatigue, anxiety, depression and disability outcomes. UCB 2006 did not report details of adverse events.
Other potential sources of bias
All studies excluded people with unstable mental disorders or psychological conditions. The external validity of the pregabalin studies is difficult to assess, because the exclusion criteria for mental disorders were not well defined and a standardised psychiatric interview was not conducted by any of the studies reviewed. A pooled analysis of three studies with pregabalin (Arnold 2008; Crofford 2005; Mease 2008), reported that baseline HADS scores indicated moderate‐to‐severe anxiety in 38% of participants and moderate‐to‐severe depressive symptoms in 27% of participants (Arnold 2010a). These HADS scores indicate that some participants with anxiety or depressive disorders, or both, were included in the trials.
Effects of interventions
Gabapentin versus placebo
50% or greater pain reduction: one study with 150 participants was entered into an analysis of a 50% or greater pain reduction. A total of 32 of 75 (42.7%) participants with gabapentin and 20 of 75 (26.7%) participants with placebo reported a 50% or greater pain reduction. The RR of a 50% or greater pain reduction by anticonvulsants versus placebo was statistically significant (RR 1.60; 95% CI 1.01 to 2.53; P value = 0.04) (Analysis 1.2).
Sleep problems: one study with 119 participants was entered into an analysis of the effects of gabapentin on reduction of sleep problems. The overall effect on sleep problems was statistically significant (SMD ‐0.71; 95% CI ‐1.08 to ‐0.24; P value < 0.001). Based on Cohen's categories, the effect of gabapentin versus placebo on fatigue was small (Analysis 1.3).
Withdrawal due to adverse events: one study with 150 participants was entered into an analysis of withdrawals due to adverse events. A total of 12 of 75 (16.0%) participants dropped out due to adverse events with gabapentin and 7 of 75 (9.3%) participants with placebo. The RR of dropping out due to adverse events was not statistically significant (RR 1.71; 95% CI 0.71 to 4.11; P value = 0.23) (Analysis 1.5).
Dizziness: one study with 150 participants was entered into an analysis of dizziness attributed to be an adverse event of gabapentin. A total of 38 of 75 (50.7%) participants with gabapentin and 23 of 75 (30.7%) participants with placebo reported dizziness that was attributed to therapy. The RR of dizziness attributed to gabapentin versus placebo was statistically significant (RR 2.71; 95% CI 1.21 to 6.07; P value = 0.02) (Analysis 1.6).
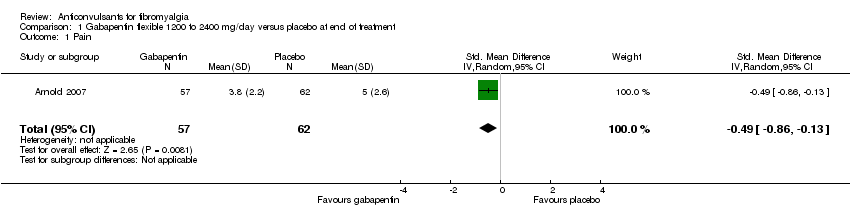
Pain: one study with 119 participants was entered into an analysis of the effects of gabapentin on pain reduction. The overall effect on pain was statistically significant (SMD ‐0.49; 95% CI ‐0.86 to ‐0.13; P value = 0.008) (Analysis 1.1).
30% or greater pain reduction: one study with 150 participants were entered into an analysis of a 30% or greater pain reduction. A total of 38 of 75 (50.7%) participants with gabapentin and 23 of 75 (30.7%) participants with placebo reported a 30% or greater pain reduction. The RR of a 30% or greater pain reduction by gabapentin versus placebo was statistically significant (RR 1.65; 95% CI 1.10 to 2.48; P value = 0.02) (Analysis 1.7).
Health‐related quality of life (HRQoL): one study with 119 participants was entered into an analysis of the effects of gabapentin on the total score of the FIQ. The overall effect on HRQoL was statistically significant (SMD ‐0.66; 95% CI ‐1.03 to ‐0.29; P value < 0.001). Based on Cohen's categories, the effect of gabapentin versus placebo on HRQoL was not substantial (Analysis 1.4).
Depression: one study with 119 participants was entered into an analysis of the antidepressive effects of gabapentin. The overall effect on depression was statistically significant (SMD ‐0.52; 95% CI ‐0.89 to ‐0.16; P value = 0.0005). Based on Cohen's categories, the effect of gabapentin versus placebo on depression was moderate (Analysis 1.8).
Disability: one study with 119 participants was entered into an analysis of the effects of gabapentin on disability reduction. The overall effect on disability was statistically significant (SMD ‐0.94; 95% CI ‐1.32 to ‐0.56; P value < 0.0001). Based on Cohen's categories, the effect of gabapentin versus placebo on depression was large (Analysis 1.9).
Lacosamide versus placebo
One study was analysed. The number of participants with reported or analysable results ranged from 121 to 159. The imputation method could not be applied because baseline values were not reported. There was no significant difference on effect sizes and RRs for pain reduction (SMD ‐0.25; 95% CI ‐0.56 to 0.07) (Analysis 2.1), fatigue reduction (SMD ‐0.07; 95% CI ‐0.43 to 0.28) (Analysis 2.2), sleep problems (SMD ‐0.19; 95% CI ‐0.51 to 0.12) (Analysis 2.3), reductions of limitations of HRQoL (SMD ‐0.15; 95% CI ‐0.47 to 0.16) (Analysis 2.4), serious adverse events (RR 0.15; 95% CI 0.01 to 2.82) (Analysis 2.5), anxiety (SMD 0.00; 95% CI ‐0.34 to 0.34) (Analysis 2.7), depression reduction (SMD 0.11; 95% CI ‐0.23 to 0.45) (Analysis 2.8), disability reduction (RR ‐0.19; 95% CI ‐0.51 to 0.12) (Analysis 2.9), or PGIC 'much' or 'very much' improved (RR 1.32; 95% CI 0.85 to 2.04) (Analysis 2.10). However, the RR of dizziness attributed to lacosamide versus placebo was statistically significant (RR 2.34; 95% CI 1.08 to 5.06; P value = 0.03) (Analysis 2.6).
Levetiracetam versus placebo
One study was analysed. The number of participants with reported or analysable results ranged from 50 to 66. The pain response rates had to be calculated by an imputation method because the data had not been reported and were not provided on request. There was no significant difference on effect sizes or RRs of mean pain reduction (SMD ‐0.21; 95% CI ‐0.77 to 0.36) (Analysis 3.1), 50% pain reduction (RR 1.52; 95% CI 0.43 to 5.34) (Analysis 3.2), reduction of sleep problems (SMD ‐0.16; 95% CI ‐0.72 to 0.40) (Analysis 3.3), withdrawals due to adverse events (RR 0.87; 95% CI 0.21 to 3.56) (Analysis 3.5), and 30% pain reduction (RR 1.23; 95% CI 0.65 to 2.33) (Analysis 3.7). However, the RR of dizziness attributed to levetiracetam versus placebo was statistically significant (RR 1.30; (95% CI 1.02 to 1.66; P value = 0.04) (Analysis 3.6).
Pregabalin versus placebo
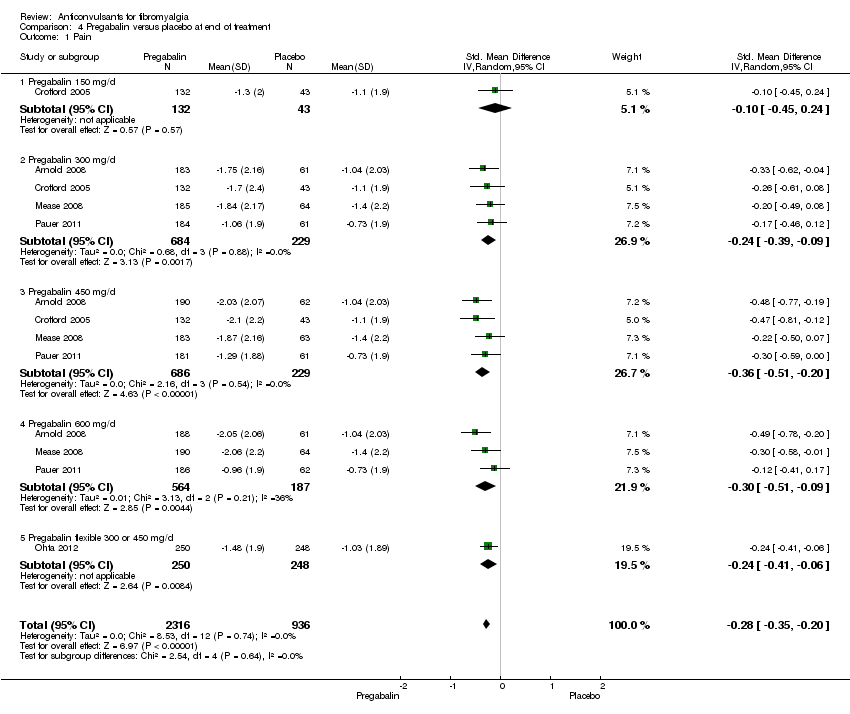
50% or greater pain reduction: five studies with 3256 participants were entered into an analysis of a 50% or greater pain reduction. A total of 514 of 2319 (22.2%) participants with pregabalin and 128 of 937 (13.7%) participants with placebo reported a 50% or greater pain reduction. The RR of a 50% or greater pain reduction by anticonvulsants versus placebo was significant (RR 1.59; 95% CI 1.33 to 1.90; P value < 0.0001). The NNTB by drug over placebo was 12 (95% CI 9 to 21) (Figure 4).
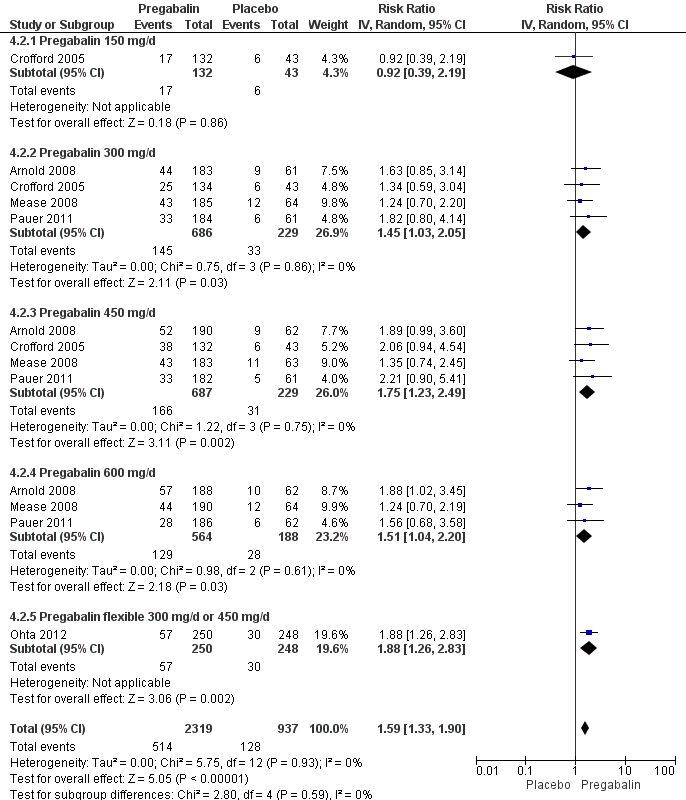
Forest plot of comparison: 4 Pregabalin versus placebo at end of treatment, outcome: 4.2 50% pain reduction.
Patient global impression of change (PGIC): five studies with 3183 participants were entered into an analysis of the effects of anticonvulsants on PGIC 'much' or 'very much' improved. A total of 892 of 2265 (39.4%) participants with pregabalin and 256 of 918 (27.9%) participants with placebo reported to be 'much' or 'very much' improved. The RR of a PGIC 'much' or 'very much' improved by pregabalin versus placebo was statistically significant (RR 1.38; 95% CI 1.23 to 1.55; P value < 0.0001). The NNTB to achieve a benefit by pregabalin over placebo was 9 (95% CI 7 to 13) (see Analysis 4.13).
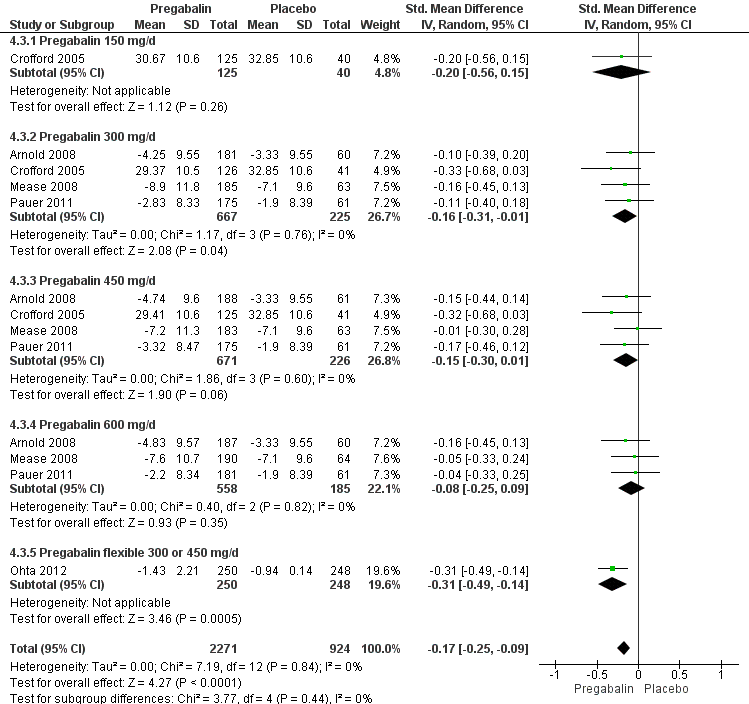
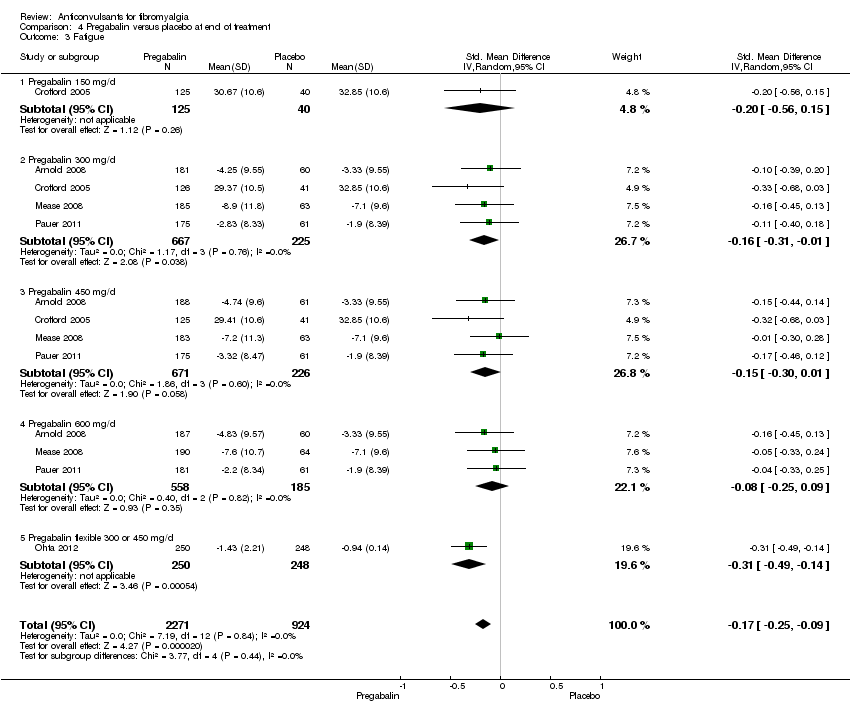
Fatigue: five studies with 3195 participants were entered into an analysis of the effects of pregabalin on fatigue reduction. The overall effect on fatigue was statistically significant (SMD ‐0.17; 95% CI ‐0.25 to ‐0.09; P value < 0.001). Based on Cohen's categories, the effect of pregabalin versus placebo on fatigue was not substantial (see Figure 5).

Forest plot of comparison: 4 Pregabalin versus placebo at end of treatment, outcome: 4.3 Fatigue.
Sleep problems: five studies with 3193 participants were entered into an analysis of the effects of pregabalin on reduction of sleep problems. The overall effect on sleep problems was statistically significant (SMD ‐0.35; 95% CI ‐0.43 to ‐0.27; P value < 0.001). Based on Cohen's categories, the effect of anticonvulsants versus placebo on fatigue was small (see Figure 6).

Forest plot of comparison: 4 Pregabalin versus placebo at end of treatment, outcome: 4.4 Sleep problems.
Withdrawal due to adverse events: five studies with 3259 participants were entered into an analysis of withdrawals due to adverse events. A total of 449 of 2317 (19.4%) participants dropped out due to adverse events with pregabalin and 104 of 942 (11.0%) participants with placebo. The RR of dropping out due to adverse events was statistically significant (RR 1.68; 95% CI 1.36 to 2.07; P value < 0.001). The NNTH by pregabalin over placebo was 12 (95% CI 9 to 17) (see Analysis 4.6).
Serious adverse events: four studies with 2729 participants were entered into an analysis of withdrawals due to serious adverse events. In 100 of 1921 (5.2%) participants with pregabalin and in 33 of 808 (4.1%) participants with placebo a serious adverse event was recorded. The RR of dropping out due to serious adverse events was not statistically significant (RR 1.03; 95% CI 0.71 to 1.49; P value = 0.99) (Analysis 4.7).
Dizziness: five studies with 3257 participants were entered into an analysis of dizziness attributed to be an adverse event of drug therapy. A total of 883 of 2319 (38.1%) participants with pregabalin and 87 of 938 (9.3%) participants with placebo reported dizziness that was attributed to drug therapy. The RR of dizziness attributed to pregabalin versus placebo was statistically significant (RR 3.77; 95% CI 3.06 to 4.63; P value < 0.001). The NNTH by pregabalin over placebo was 4 (95% CI 3 to 5) (see Analysis 4.8).
Mean pain reduction: five studies with 3252 participants were entered into an analysis of the effects of pregabalin on pain reduction. The overall effect on pain was statistically significant (SMD ‐0.28; 95% CI ‐0.35 to ‐0.20; P value < 0.001). According to Cohen's categories, the effect of pregabalin compared with placebo on pain was small (Analysis 4.1).
30% or greater pain reduction: five studies with 3259 participants were entered into an analysis of a 30% or greater pain reduction. A total of 928 of 2319 (40.0%) participants with pregabalin and 274 of 940 (29.1%) participants with placebo reported a 30% or greater pain reduction. The RR of a 30% or greater pain reduction by pregabalin versus placebo was significant (RR 1.37; 95% CI 1.22 to 1.53; P value < 0.0001). The NNTB by pregabalin over placebo was 9 (96% CI 7 to 13) (Analysis 4.9).
Health‐related quality of life (HRQoL): four studies with 2724 participants were entered into an analysis of the effects of pregabalin on the total score of the FIQ. The overall effect on HRQoL was statistically significant (SMD ‐0.17; 95% CI ‐0.26 to ‐0.09; P value < 0.001). Based on Cohen's categories, the effect of pregabalin versus placebo on HRQoL was not substantial (Analysis 4.5).
Depression: five studies with 3212 participants were entered into an analysis of the antidepressive effects of pregabalin. The overall effect on depression was statistically significant (SMD ‐0.09; 95% CI ‐0.16 to ‐0.01; P value < 0.001). Based on Cohen's categories, the effect of pregabalin versus placebo on depression was not substantial (Analysis 4.11).
Anxiety: five studies with 3214 participants were entered into an analysis of the effects of pregabalin on anxiety reduction. The overall effect on anxiety was statistically significant (SMD ‐0.12; 95% CI ‐0.20 to ‐0.04; P value < 0.001). Based on Cohen's categories, the effect of pregabalin versus placebo on anxiety was not substantial (Analysis 4.10).
Disability: five studies with 3145 participants were entered into an analysis of the effects of pregabalin on disability reduction. The overall effect on disability was not statistically significant (SMD ‐0.01; 95% CI ‐0.11 to 0.09; P value = 0.82) (Analysis 4.12).
Subgroup analysis
Different dosages of pregabalin: there were no statistically significant overall subgroup differences in the reduction of mean pain (P value = 0.64), 30% or greater pain reduction (P value = 0.79), 50% or greater pain reduction (P value = 0.59), fatigue (P value = 0.49), sleep problems (P value = 0.29), limitations of disease‐related HRQoL (P value = 0.75), anxiety (P value = 0.65), depression (P value = 0.96), PGIC (P value = 0.84), dropout due to adverse events (P value = 0.10), and serious adverse events (P value = 0.83). There was a statistically significant overall subgroup difference in the dropout rate due to adverse events (P value = 0.04), which was highest in the 600 mg/day arm. There was a statistically significant overall subgroup difference in the reduction of disability (P value = 0.03). The effect size of pregabalin flexible (SMD ‐0.29; 95% CI ‐0.47 to ‐0.12) on disability was statistically significant and small, the one for pregabalin 600 mg/day arm included zero and the ones for other pregabalin dosages arms were statistically significant but not substantial.
Studies with and without European participants: Pauer 2011 reported that the placebo‐adjusted results demonstrated greater improvement in PGIC and sleep endpoints in European participants (n = 379) and greater improvement in pain and FIQ total score in non‐European participants (n = 357). Discontinuation rates due to adverse events were more frequent in European participants (23.0%) than in non‐European participants (16.0%). The EMA presented in its refusal assessment report for pregabalin the effect sizes of pregabalin 300, 450 and 600 mg/day on pain in European participants (European Medicines Agency 2009). The 95% CIs of all three dosages included zero indicating a non‐significant superiority of pregabalin over placebo.
We did not conduct the intended subgroup analyses with gender and pain because individual participant data were not available.
Sensitivity analyses
The intended sensitivity analyses (different statistical models applied, presence of temporal differences, diagnostic criteria used in the trial, according to the presence/absence of any mental disorder, according to the presence or absence of any concomitant systemic disease) were not conducted, because the studies did not differ in these characteristics.
Discussion
Summary of main results
There is high‐quality evidence that pregabalin has a small benefit compared with placebo in reducing pain and sleep problems. There is high‐quality evidence that the effects of pregabalin compared with placebo in reducing fatigue, depression, anxiety and limitations of HRQoL are not substantial. There is high‐quality evidence that there is no significant difference between pregabalin and placebo in the reduction of disability. There is high‐quality evidence that the dropout rate due to adverse events with pregabalin is significantly higher than with placebo. There is moderate‐quality evidence that the frequency of serious adverse events is similar between pregabalin and placebo. The amount and quality of evidence are insufficient to draw definite conclusions on the efficacy and safety of gabapentin, lacosamide and levetiracetam in FM. It would be inappropriate to suggest a class effect of anticonvulsants on FM symptoms.
Overall completeness and applicability of evidence
We are confident that we have identified all available evidence on pregabalin because all of the trials had been registered as part of the application for regulatory approval for FM management. We cannot rule out the possibility that negative study results with other anticonvulsants had not been published or have been missed by our search strategy.
The applicability (external validity) of evidence is strongly limited for the following reasons:
1. The studies were performed in research centres and not in routine clinical care. It is known that the efficacy of drug therapies is higher in the context of RCTs than in routine clinical care (Routman 2010).
2. The exclusion criteria were strict. Participants were not allowed to take some defined concomitant medications for their FM symptoms. This excluded a large number of people who were unwilling or unable to come off medications such as other antidepressants and anticonvulsants. For this reason, participant selection in the RCTs was biased towards recruiting participants better able to manage their symptoms without medication than seen in the community. Participants with other medical disorders, such as inflammatory rheumatic diseases, were also excluded. The study results also cannot be applied to people with FM complicated by other medical disorders. The study results cannot be applied to people with FM and concomitant mental disease, because no subgroup analysis of people with depressive or anxiety disorders had been presented by the manufacturer.
3. The majority of the participants were middle‐aged women, making it difficult to apply the results to the general population. The manufacturer did not perform subgroup analyses of participants over 65 years of age or of male participants. The results of anticonvulsants cannot be applied to children and adolescents with FM because they had also been excluded.
Quality of the evidence
All of the reviewed studies except for one (Rowbotham 2012) had been sponsored by pharmaceutical companies. The quality of evidence of this review is based on the data presented in peer reviewed journals and some additional details which were provided on request by the pharmaceutical companies or principal investigators. However, not all data requested were provided. We had no access to individual participant data. A selective non‐reporting of serious adverse events by one study is possible (Crofford 2005). Despite these limitations, the overall quality of evidence was high for most primary outcomes in the majority of studies (see summary of findings Table for the main comparison).
Potential biases in the review process
Absence of a publication bias can never be confirmed.
Efficacy outcomes were analysed using last observation carried forward to impute for missing data. This procedure may lead to an overestimation of efficacy (Moore 2012b). The use of the baseline observation carried forward method has been recommended for analysis (Moore 2010b).
In addition, the 30% and 50% pain reduction rates of one study were not reported and not provided on request (Rowbotham 2012). We calculated these values using an established imputation method (Furukawa 2005).
The influence of allowed co‐interventions (e.g. rescue medication) on positive effects and adverse events was unclear because type and dosage of co‐interventions were not clearly reported or controlled for.
Agreements and disagreements with other studies or reviews
Our results on the efficacy, tolerability and safety of pregabalin are in line with those of one systematic review (Straube 2010), with individual participant data of four studies that we included in our review (Arnold 2008; Crofford 2005; Mease 2008; Pauer 2011). Significant benefit of pregabalin over placebo was seen for mean pain and sleep scores and the proportion of participants achieving at least 50% pain relief. A minority of participants had substantial benefit with pregabalin, and more had moderate benefit. Many participants had only marginal or no benefit (Moore 2009; Straube 2010). Straube 2010 reported a benefit of pregabalin over placebo on most of the individual domains of the SF‐36. However, the authors found no significant effect on disability (physical role limitation) or any positive effect on physical functioning. In line with Tzellos 2010 and Straube 2010, we found no significant differences in the efficacy of pregabalin 300, 450, and 600 mg/day. The proportions of participants with somnolence, dizziness and more than 7% weight gain were significantly greater with pregabalin than with placebo (Straube 2010). The tolerability of pregabalin by people with FM was limited, because 18% of participants with anticonvulsants dropped out due to adverse events. In accordance with Straube 2010, we found a dose‐response relationship of adverse events (dizziness, dropout rate). There was no difference with regard to serious adverse events between pregabalin and placebo (Straube 2010). However, it should be noted that rare serious adverse events with pregabalin, such as heart failure exacerbation (Page 2008), psychosis (Olaizola 2006), suicidal tendencies (Mutschler 2011), and abuse and dependency (Gahr 2013), had been reported outside the context of RCTs.
The EERW (Enriched Enrollment Randomized Withdrawal) trial of Crofford 2008, which could not be combined with the studies with a parallel design for meta‐analysis, confirmed the efficacy of pregabalin in people with FM. The trial used a six‐week open titration to allow participants to obtain a substantial benefit (at least 50% pain relief and 'much' or 'very much' improved on PGIC) and have tolerable adverse events. Participants who achieved this outcome then entered a randomised, double‐blind, 26‐week withdrawal phase in which either the established dose or placebo was used. During the open‐label phase, 54% had at least 50% pain relief on a VAS over baseline and a PGIC of 'much' or 'very much' improved and so were able to enter the randomised double‐blind phase. For pregabalin, 90 of 279 (32%) participants experienced loss of therapeutic response over 26 weeks, compared with 174 of 287 (61%) participants with placebo. The NNTH to prevent one person experiencing a loss of treatment response for FM was 4 (95% CI 3 to 5). A total of 37 of 279 (13.3%) participants dropped out due to adverse events with pregabalin and 20 of 287 (7.0%) participants with placebo (NNTH 16; 95% CI 9 to 75).
Our results on gabapentin are in line with a Cochrane review on gabapentin in neuropathic pain syndromes that included one study in FM (Arnold 2007). The amount of evidence for gabapentin in FM was low, excluding any confidence on its efficacy (Moore 2011). Our results that lacosamide is not effective in FM is in line with a Cochrane review on lacosamide in neuropathic pain syndromes (Hearn 2012), which included one study in FM (UCB 2006). We found no other studies or reviews on levetiracetam in FM. Of note, gabapentin, lacosamide and levetiracetam were not licensed by any regulatory agency for FM or mental disorders.
Considering the current differences in regulatory approval regarding the use of pregabalin in FM in the US and Japan versus Europe, it seems relevant to comment if our data support either of these positions. According to EMA analysis, pregabalin did not significantly reduce mean pain in European participants (European Medicines Agency 2009). Moreover, European participants dropped out more frequently due to adverse events (23%) than US (16%) (European Medicines Agency 2009) and Japanese participants (14%) (Ohta 2012). Individual participant data were provided by Pfizer to EMA, but not to us. Therefore, EMA, but not us, could perform analysis of European and American participants. Therefore, our review cannot provide support for any of these regulatory positions.
The data on the efficacy of anticonvulsants were gathered in the context of RCTs in which people with FM received more frequent and detailed attention by the number of study visits and control examinations than they receive in routine clinical care. The context of an RCT might explain the remarkable number of participants that reported a substantial pain reduction (15%) and an overall 'much' or 'very much' improvement in PGIC (28%) with placebo. We found comparable placebo response rates in studies with duloxetine, milnacipran and sodium oxybate (Häuser 2012b). The effectiveness of drugs in clinical practice can be lower. Of 3123 adults with FM who participated in an 11‐year longitudinal study of the National Data Bank of Rheumatic Diseases, up to 39% were treated with centrally acting agents (duloxetine, gabapentin, milnacipran and pregabalin). For participants treated with these drugs, pain scores were reduced significantly following the start of these drugs. The mean pain score decreased from 6.2 to 6.0 (relative improvement of 2.8%). There was no significant improvement in fatigue or functional status (Wolfe 2013b).
The pooled data from three extension studies for up to one year suggested that the adverse event and safety profile of patients with FM treated with open‐label pregabalin (75 to 300 mg twice daily) for up to one year were stable and were consistent with those of RCTs. 12.4% of the participants discontinued pregabalin because of adverse events within one year. The most commonly reported treatment‐emergent adverse events with open‐label pregabalin treatment were dizziness, somnolence, headache, peripheral oedema, and increased weight (Arnold 2012). The data of RCTs and of extension studies do not answer the question for how long pregabalin ‐ if effective and tolerated ‐ should be taken by the patient. Longitudinal studies demonstrated that FM symptoms persisted in nearly all participants over more than 10 years (Eich 2012a). No data are available on the long‐term (> one year) effectiveness, tolerability and safety of pregabalin in FM.
If pregabalin is considered for the treatment of FM, potential benefits and harms should be frankly discussed between the physician and the patient. The warnings (angio‐oedema, hypersensitivity reactions, impairment of a person's ability to drive or operate machinery) should be discussed (Häuser 2010a). A marked increase of reports on abuse and dependence of pregabalin has been noted (Gahr 2013). Pregabalin should be individually tapered according to effectiveness and tolerability. The recommended dose is 150 mg/day twice daily. Pregabalin should be started with 25 to 50 mg at night and at the weekend because of potential neuropsychiatric side effects. Titration in weekly increments of 25 to 50 mg based on tolerability and therapeutic response is recommended (Boomershine 2010).
Therapy of FM with drugs only, such as pregabalin alone, should be discouraged since current best practices in FM guidelines recommend using the combination of pharmacological therapy with aerobic exercise and psychological therapies (Eich 2012b; Fitzcharles 2013). Although the combination of pregabalin with non‐pharmacological treatment options had not been tested in RCTs, combination therapy should be considered. This is especially true for such symptoms that are only marginally responsive to pregabalin, but can be effectively treated with other therapies such as aerobic exercise for fatigue (Häuser 2010b), and cognitive behavioural therapies for depression (Bernardy 2010).

Study flow diagram.
Risk of bias graph: review authors' judgements about each risk of bias item presented as percentages across all included studies.

Risk of bias summary: review authors' judgements about each risk of bias item for each included study.

Forest plot of comparison: 4 Pregabalin versus placebo at end of treatment, outcome: 4.2 50% pain reduction.
Forest plot of comparison: 4 Pregabalin versus placebo at end of treatment, outcome: 4.3 Fatigue.

Forest plot of comparison: 4 Pregabalin versus placebo at end of treatment, outcome: 4.4 Sleep problems.
Comparison 1 Gabapentin flexible 1200 to 2400 mg/day versus placebo at end of treatment, Outcome 1 Pain.

Comparison 1 Gabapentin flexible 1200 to 2400 mg/day versus placebo at end of treatment, Outcome 2 50% pain reduction.

Comparison 1 Gabapentin flexible 1200 to 2400 mg/day versus placebo at end of treatment, Outcome 3 Sleep problems.
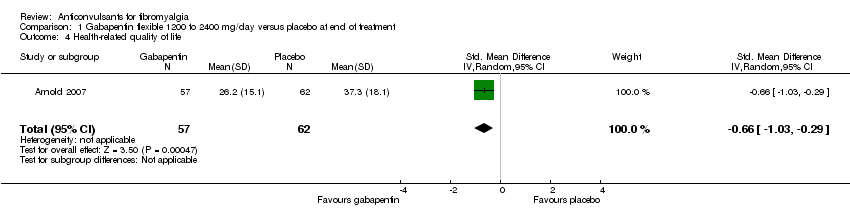
Comparison 1 Gabapentin flexible 1200 to 2400 mg/day versus placebo at end of treatment, Outcome 4 Health‐related quality of life.

Comparison 1 Gabapentin flexible 1200 to 2400 mg/day versus placebo at end of treatment, Outcome 5 Withdrawal due to adverse events.

Comparison 1 Gabapentin flexible 1200 to 2400 mg/day versus placebo at end of treatment, Outcome 6 Dizziness.
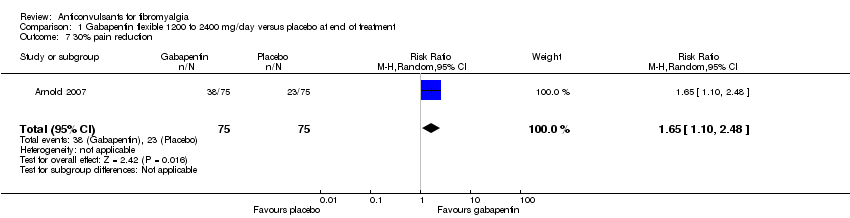
Comparison 1 Gabapentin flexible 1200 to 2400 mg/day versus placebo at end of treatment, Outcome 7 30% pain reduction.

Comparison 1 Gabapentin flexible 1200 to 2400 mg/day versus placebo at end of treatment, Outcome 8 Depression.

Comparison 1 Gabapentin flexible 1200 to 2400 mg/day versus placebo at end of treatment, Outcome 9 Disability.
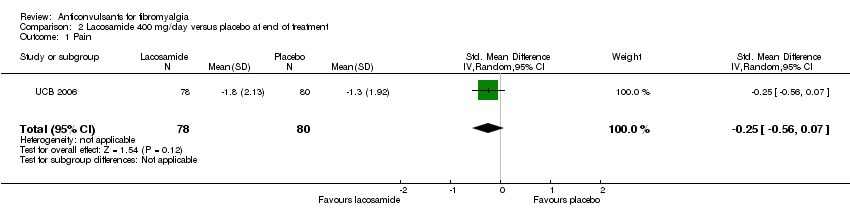
Comparison 2 Lacosamide 400 mg/day versus placebo at end of treatment, Outcome 1 Pain.

Comparison 2 Lacosamide 400 mg/day versus placebo at end of treatment, Outcome 2 Fatigue.
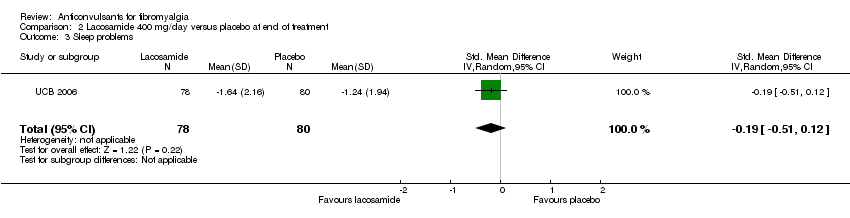
Comparison 2 Lacosamide 400 mg/day versus placebo at end of treatment, Outcome 3 Sleep problems.

Comparison 2 Lacosamide 400 mg/day versus placebo at end of treatment, Outcome 4 Health‐related quality of life.
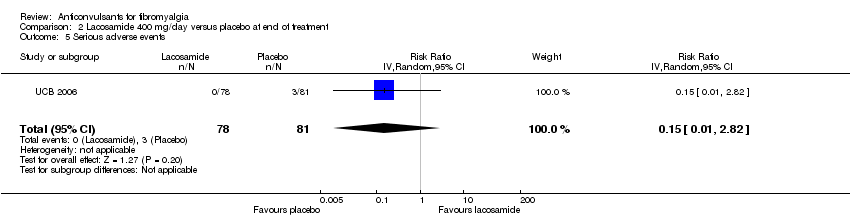
Comparison 2 Lacosamide 400 mg/day versus placebo at end of treatment, Outcome 5 Serious adverse events.
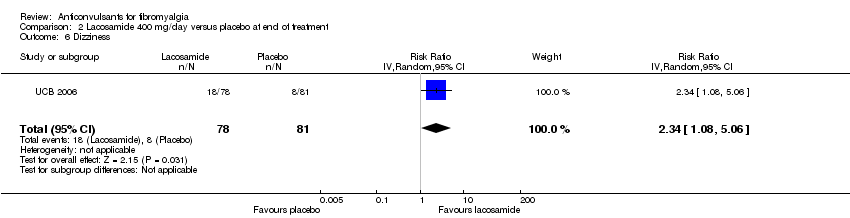
Comparison 2 Lacosamide 400 mg/day versus placebo at end of treatment, Outcome 6 Dizziness.

Comparison 2 Lacosamide 400 mg/day versus placebo at end of treatment, Outcome 7 Anxiety.

Comparison 2 Lacosamide 400 mg/day versus placebo at end of treatment, Outcome 8 Depression.

Comparison 2 Lacosamide 400 mg/day versus placebo at end of treatment, Outcome 9 Disability.

Comparison 2 Lacosamide 400 mg/day versus placebo at end of treatment, Outcome 10 Patient Global Impression of Change 'much' or 'very much' improved.
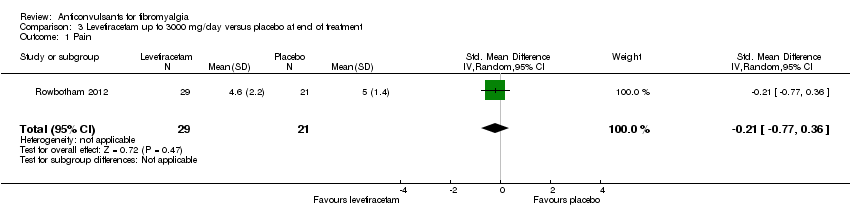
Comparison 3 Levetiracetam up to 3000 mg/day versus placebo at end of treatment, Outcome 1 Pain.

Comparison 3 Levetiracetam up to 3000 mg/day versus placebo at end of treatment, Outcome 2 50% pain reduction.

Comparison 3 Levetiracetam up to 3000 mg/day versus placebo at end of treatment, Outcome 3 Sleep problems.

Comparison 3 Levetiracetam up to 3000 mg/day versus placebo at end of treatment, Outcome 4 Health‐related quality of life.

Comparison 3 Levetiracetam up to 3000 mg/day versus placebo at end of treatment, Outcome 5 Withdrawal due to adverse events.

Comparison 3 Levetiracetam up to 3000 mg/day versus placebo at end of treatment, Outcome 6 Dizziness.

Comparison 3 Levetiracetam up to 3000 mg/day versus placebo at end of treatment, Outcome 7 30% pain reduction.
Comparison 4 Pregabalin versus placebo at end of treatment, Outcome 1 Pain.

Comparison 4 Pregabalin versus placebo at end of treatment, Outcome 2 50% pain reduction.
Comparison 4 Pregabalin versus placebo at end of treatment, Outcome 3 Fatigue.

Comparison 4 Pregabalin versus placebo at end of treatment, Outcome 4 Sleep problems.
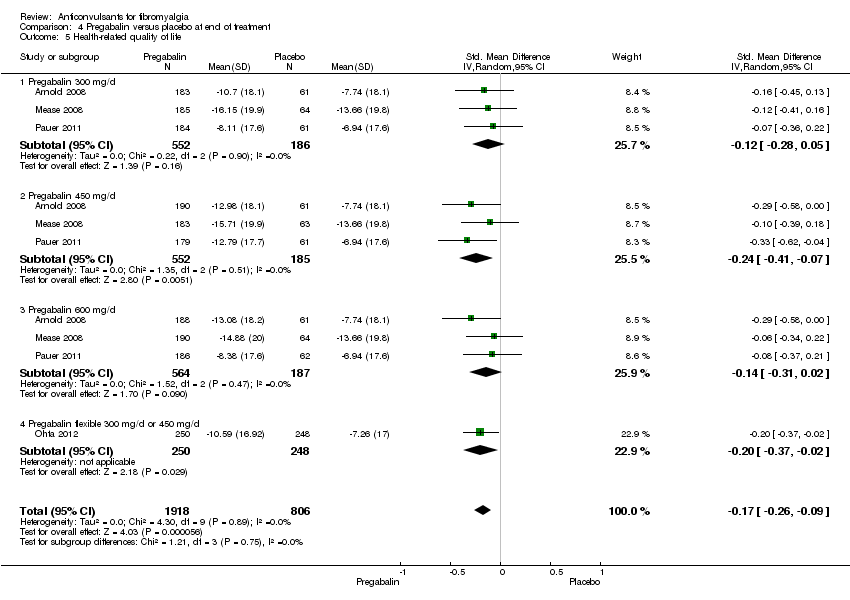
Comparison 4 Pregabalin versus placebo at end of treatment, Outcome 5 Health‐related quality of life.

Comparison 4 Pregabalin versus placebo at end of treatment, Outcome 6 Withdrawal due to adverse events.
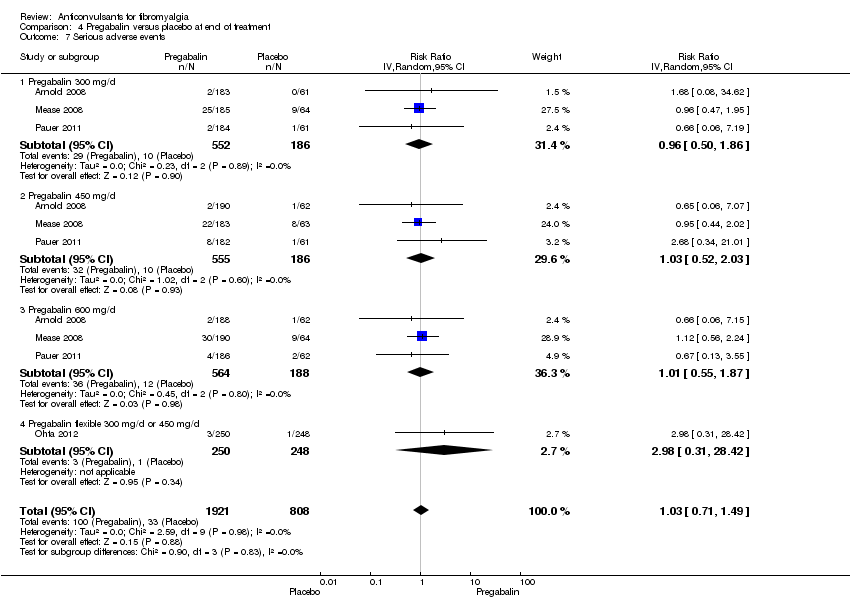
Comparison 4 Pregabalin versus placebo at end of treatment, Outcome 7 Serious adverse events.

Comparison 4 Pregabalin versus placebo at end of treatment, Outcome 8 Dizziness.
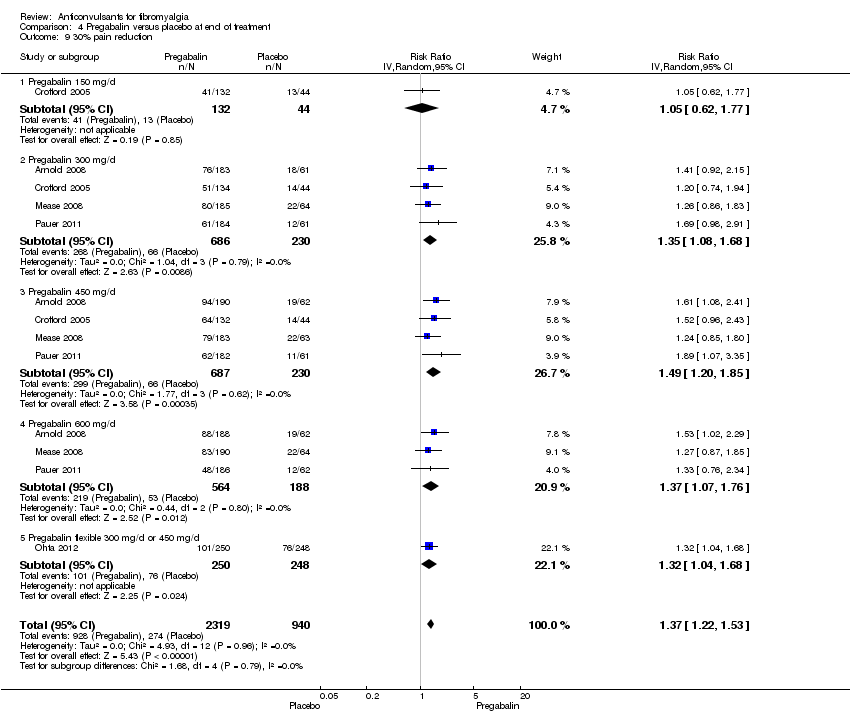
Comparison 4 Pregabalin versus placebo at end of treatment, Outcome 9 30% pain reduction.
Comparison 4 Pregabalin versus placebo at end of treatment, Outcome 10 Anxiety.

Comparison 4 Pregabalin versus placebo at end of treatment, Outcome 11 Depression.

Comparison 4 Pregabalin versus placebo at end of treatment, Outcome 12 Disability.

Comparison 4 Pregabalin versus placebo at end of treatment, Outcome 13 Patient Global Impression of Change 'much' or 'very much' improved.
| Pregabalin versus placebo at final treatment for fibromyalgia | ||||||
| Patient or population: People with fibromyalgia | ||||||
| Outcomes | Illustrative comparative risks* (95% CI) | Relative effect | No of participants | Quality of the evidence | Comments | |
| Assumed risk | Corresponding risk | |||||
| Control | Anticonvulsants versus placebo at final treatment | |||||
| 50% pain reduction | 137 per 1000 | 217 per 1000 | RR 1.59 | 3256 | ⊕⊕⊕⊕ | Absolute risk difference (fewer pain) 8% (95% CI 6% to 11%) Relative per cent improvement 59% (95% CI 33% to 90%) NNTB 12 (95% CI 9 to 21) |
| Patient Global Impression of Change of 'much' or 'very much' improved | 279 per 1000 | 385 per 1000 | RR 1.38 | 3183 | ⊕⊕⊕⊕ | Absolute risk difference (more global impression of 'much' and 'very much' improved) 12% (95% CI 4% to 20%) Relative per cent improvement 38% (95% CI 23% to 55%) NNTB 9 (95% CI 7 to 15) |
| Fatigue (1‐50 scale) Higher scores indicate higher fatigue levels | MAF baseline fatigue score control group 35.6 (standard deviation 8.0) ** | The mean fatigue in the intervention groups was | 3195 | ⊕⊕⊕⊕ | SMD ‐0.17 (‐0.25 to ‐0.09) 2.7% (95% CI 1.4% to 4.0%) fewer points on the fatigue scale (absolute improvement) 3.8% (95% CI 2.0% to 5.6%) relative improvement NNTB 13 (95% CI 9 to 25) | |
| Sleep problems (0‐100 scale). Higher scores indicate more sleep problems | MOS baseline overall sleep problem index control group 58.5 (17.8) *** | The mean sleep problems in the intervention groups was | 3139 | ⊕⊕⊕⊕ | SMD ‐0.35 (‐0.43 to ‐0.27) 6.2% (95% CI 4.8% to 7.7%) fewer points on the sleep problem scale (absolute improvement) 10.6% (95% CI 82.% to 13.1%) relative improvement NNTB 7 (95% CI 5 to 8) | |
| Withdrawal due to adverse events | 110 per 1000 | 185 per 1000 | RR 1.68 | 3259 | ⊕⊕⊕⊕ | Absolute risk difference (more withdrawal due to adverse events) 8% (95% CI 5% to 12%) Relative per cent worsening 68% (95% CI 36% to 107%) NNTH 13 (95% CI 9 to 23) |
| Serious adverse events | 41 per 1000 | 42 per 1000 | RR 1.03 | 2729 | ⊕⊕⊕⊝ | Absolute risk difference 0 (95% CI ‐1 to 1) Relative per cent change 0 (95% CI ‐1 to 1) Not statistically significant |
| Dizziness reported to be an adverse event | 93 per 1000 | 350 per 1000 | RR 3.77 | 3257 | ⊕⊕⊕⊕ | Absolute risk difference (more dizziness) 28% (95% CI 24% to 32%) Relative per cent worsening 277% (95% CI 206% to 363%) NNTH 4 (95% CI 3 to 5) |
| *The basis for the assumed risk (e.g. the median control group risk across studies) is provided in footnotes. The corresponding risk (and its 95% confidence interval) is based on the assumed risk in the comparison group and the relative effect of the intervention (and its 95% CI). CI: confidence interval; MAF: Multidimensional Assessment of Fatigue; MOS: Medical Outcomes Study; NNTB: number needed to treat for an additional beneficial outcome; NNTH: number needed to treat for an additional harmful outcome; NRS: numeric rating scale; RR: risk ratio; SMD: standardised mean difference. | ||||||
| GRADE Working Group grades of evidence | ||||||
| 1 Frequency of serious adverse events not reported by one study. ** Arnold 2008: n = 190 participants; MAF (NRS 1‐50). *** Arnold 2008: n = 190 participants; MOS Overall Sleep Problems Index (NRS 0‐100). | ||||||
| Outcome or subgroup title | No. of studies | No. of participants | Statistical method | Effect size |
| 1 Pain Show forest plot | 1 | 119 | Std. Mean Difference (IV, Random, 95% CI) | ‐0.49 [‐0.86, ‐0.13] |
| 2 50% pain reduction Show forest plot | 1 | 150 | Risk Ratio (IV, Random, 95% CI) | 1.6 [1.01, 2.53] |
| 3 Sleep problems Show forest plot | 1 | 119 | Std. Mean Difference (IV, Random, 95% CI) | ‐0.71 [‐1.08, ‐0.34] |
| 4 Health‐related quality of life Show forest plot | 1 | 119 | Std. Mean Difference (IV, Random, 95% CI) | ‐0.66 [‐1.03, ‐0.29] |
| 5 Withdrawal due to adverse events Show forest plot | 1 | 150 | Risk Ratio (IV, Random, 95% CI) | 1.71 [0.71, 4.11] |
| 6 Dizziness Show forest plot | 1 | 150 | Risk Ratio (IV, Random, 95% CI) | 2.71 [1.21, 6.07] |
| 7 30% pain reduction Show forest plot | 1 | 150 | Risk Ratio (M‐H, Random, 95% CI) | 1.65 [1.10, 2.48] |
| 8 Depression Show forest plot | 1 | 119 | Std. Mean Difference (IV, Random, 95% CI) | ‐0.52 [‐0.89, ‐0.16] |
| 9 Disability Show forest plot | 1 | 119 | Std. Mean Difference (IV, Random, 95% CI) | ‐0.94 [‐1.32, ‐0.56] |
| Outcome or subgroup title | No. of studies | No. of participants | Statistical method | Effect size |
| 1 Pain Show forest plot | 1 | 158 | Std. Mean Difference (IV, Random, 95% CI) | ‐0.25 [‐0.56, 0.07] |
| 2 Fatigue Show forest plot | 1 | 121 | Std. Mean Difference (IV, Random, 95% CI) | ‐0.07 [‐0.43, 0.28] |
| 3 Sleep problems Show forest plot | 1 | 158 | Std. Mean Difference (IV, Random, 95% CI) | ‐0.19 [‐0.51, 0.12] |
| 4 Health‐related quality of life Show forest plot | 1 | 157 | Std. Mean Difference (IV, Random, 95% CI) | ‐0.15 [‐0.47, 0.16] |
| 5 Serious adverse events Show forest plot | 1 | 159 | Risk Ratio (IV, Random, 95% CI) | 0.15 [0.01, 2.82] |
| 6 Dizziness Show forest plot | 1 | 159 | Risk Ratio (IV, Random, 95% CI) | 2.34 [1.08, 5.06] |
| 7 Anxiety Show forest plot | 1 | 133 | Std. Mean Difference (IV, Random, 95% CI) | 0.0 [‐0.34, 0.34] |
| 8 Depression Show forest plot | 1 | 134 | Std. Mean Difference (IV, Random, 95% CI) | 0.11 [‐0.23, 0.45] |
| 9 Disability Show forest plot | 1 | 158 | Std. Mean Difference (IV, Random, 95% CI) | ‐0.19 [‐0.51, 0.12] |
| 10 Patient Global Impression of Change 'much' or 'very much' improved Show forest plot | 1 | 134 | Risk Ratio (IV, Random, 95% CI) | 1.32 [0.85, 2.04] |
| Outcome or subgroup title | No. of studies | No. of participants | Statistical method | Effect size |
| 1 Pain Show forest plot | 1 | 50 | Std. Mean Difference (IV, Random, 95% CI) | ‐0.21 [‐0.77, 0.36] |
| 2 50% pain reduction Show forest plot | 1 | 66 | Risk Ratio (IV, Random, 95% CI) | 1.52 [0.43, 5.34] |
| 3 Sleep problems Show forest plot | 1 | 50 | Std. Mean Difference (IV, Random, 95% CI) | ‐0.16 [‐0.72, 0.40] |
| 4 Health‐related quality of life Show forest plot | 1 | 50 | Std. Mean Difference (IV, Random, 95% CI) | 0.14 [‐0.42, 0.70] |
| 5 Withdrawal due to adverse events Show forest plot | 1 | 66 | Risk Ratio (IV, Random, 95% CI) | 0.87 [0.21, 3.56] |
| 6 Dizziness Show forest plot | 1 | 66 | Risk Ratio (IV, Random, 95% CI) | 1.3 [1.02, 1.66] |
| 7 30% pain reduction Show forest plot | 1 | 66 | Risk Ratio (IV, Random, 95% CI) | 1.23 [0.65, 2.33] |
| Outcome or subgroup title | No. of studies | No. of participants | Statistical method | Effect size |
| 1 Pain Show forest plot | 5 | 3252 | Std. Mean Difference (IV, Random, 95% CI) | ‐0.28 [‐0.35, ‐0.20] |
| 1.1 Pregabalin 150 mg/d | 1 | 175 | Std. Mean Difference (IV, Random, 95% CI) | ‐0.10 [‐0.45, 0.24] |
| 1.2 Pregabalin 300 mg/d | 4 | 913 | Std. Mean Difference (IV, Random, 95% CI) | ‐0.24 [‐0.39, ‐0.09] |
| 1.3 Pregabalin 450 mg/d | 4 | 915 | Std. Mean Difference (IV, Random, 95% CI) | ‐0.36 [‐0.51, ‐0.20] |
| 1.4 Pregabalin 600 mg/d | 3 | 751 | Std. Mean Difference (IV, Random, 95% CI) | ‐0.30 [‐0.51, ‐0.09] |
| 1.5 Pregabalin flexible 300 or 450 mg/d | 1 | 498 | Std. Mean Difference (IV, Random, 95% CI) | ‐0.24 [‐0.41, ‐0.06] |
| 2 50% pain reduction Show forest plot | 5 | 3256 | Risk Ratio (IV, Random, 95% CI) | 1.59 [1.33, 1.90] |
| 2.1 Pregabalin 150 mg/d | 1 | 175 | Risk Ratio (IV, Random, 95% CI) | 0.92 [0.39, 2.19] |
| 2.2 Pregabalin 300 mg/d | 4 | 915 | Risk Ratio (IV, Random, 95% CI) | 1.45 [1.03, 2.05] |
| 2.3 Pregabalin 450 mg/d | 4 | 916 | Risk Ratio (IV, Random, 95% CI) | 1.75 [1.23, 2.49] |
| 2.4 Pregabalin 600 mg/d | 3 | 752 | Risk Ratio (IV, Random, 95% CI) | 1.51 [1.04, 2.20] |
| 2.5 Pregabalin flexible 300 mg/d or 450 mg/d | 1 | 498 | Risk Ratio (IV, Random, 95% CI) | 1.88 [1.26, 2.83] |
| 3 Fatigue Show forest plot | 5 | 3195 | Std. Mean Difference (IV, Random, 95% CI) | ‐0.17 [‐0.25, ‐0.09] |
| 3.1 Pregabalin 150 mg/d | 1 | 165 | Std. Mean Difference (IV, Random, 95% CI) | ‐0.20 [‐0.56, 0.15] |
| 3.2 Pregabalin 300 mg/d | 4 | 892 | Std. Mean Difference (IV, Random, 95% CI) | ‐0.16 [‐0.31, ‐0.01] |
| 3.3 Pregabalin 450 mg/d | 4 | 897 | Std. Mean Difference (IV, Random, 95% CI) | ‐0.15 [‐0.30, 0.01] |
| 3.4 Pregabalin 600 mg/d | 3 | 743 | Std. Mean Difference (IV, Random, 95% CI) | ‐0.08 [‐0.25, 0.09] |
| 3.5 Pregabalin flexible 300 or 450 mg/d | 1 | 498 | Std. Mean Difference (IV, Random, 95% CI) | ‐0.31 [‐0.49, ‐0.14] |
| 4 Sleep problems Show forest plot | 5 | 3193 | Std. Mean Difference (IV, Random, 95% CI) | ‐0.35 [‐0.43, ‐0.27] |
| 4.1 Pregabalin 150 mg/d | 1 | 163 | Std. Mean Difference (IV, Random, 95% CI) | ‐0.44 [‐0.80, ‐0.08] |
| 4.2 Pregabalin 300 mg/d | 4 | 897 | Std. Mean Difference (IV, Random, 95% CI) | ‐0.29 [‐0.44, ‐0.14] |
| 4.3 Pregabalin 450 mg/d | 4 | 893 | Std. Mean Difference (IV, Random, 95% CI) | ‐0.45 [‐0.63, ‐0.27] |
| 4.4 Pregabalin 600 mg/d | 3 | 744 | Std. Mean Difference (IV, Random, 95% CI) | ‐0.40 [‐0.57, ‐0.23] |
| 4.5 Pregabalin flexible 300 or 450 mg/d | 1 | 496 | Std. Mean Difference (IV, Random, 95% CI) | ‐0.20 [‐0.37, ‐0.02] |
| 5 Health‐related quality of life Show forest plot | 4 | 2724 | Std. Mean Difference (IV, Random, 95% CI) | ‐0.17 [‐0.26, ‐0.09] |
| 5.1 Pregabalin 300 mg/d | 3 | 738 | Std. Mean Difference (IV, Random, 95% CI) | ‐0.12 [‐0.28, 0.05] |
| 5.2 Pregabalin 450 mg/d | 3 | 737 | Std. Mean Difference (IV, Random, 95% CI) | ‐0.24 [‐0.41, ‐0.07] |
| 5.3 Pregabalin 600 mg/d | 3 | 751 | Std. Mean Difference (IV, Random, 95% CI) | ‐0.14 [‐0.31, 0.02] |
| 5.4 Pregabalin flexible 300 mg/d or 450 mg/d | 1 | 498 | Std. Mean Difference (IV, Random, 95% CI) | ‐0.20 [‐0.37, ‐0.02] |
| 6 Withdrawal due to adverse events Show forest plot | 5 | 3259 | Risk Ratio (IV, Random, 95% CI) | 1.68 [1.36, 2.07] |
| 6.1 Pregabalin 150 mg/d | 1 | 175 | Risk Ratio (IV, Random, 95% CI) | 1.19 [0.35, 4.08] |
| 6.2 Pregabalin 300 mg/d | 4 | 917 | Risk Ratio (IV, Random, 95% CI) | 1.54 [1.02, 2.34] |
| 6.3 Pregabalin 450 mg/d | 4 | 917 | Risk Ratio (IV, Random, 95% CI) | 2.02 [1.32, 3.09] |
| 6.4 Pregabalin 600 mg/d | 3 | 752 | Risk Ratio (IV, Random, 95% CI) | 2.53 [1.65, 3.86] |
| 6.5 Pregabalin flexible 300 mg/d or 450 mg/d | 1 | 498 | Risk Ratio (IV, Random, 95% CI) | 1.01 [0.65, 1.57] |
| 7 Serious adverse events Show forest plot | 4 | 2729 | Risk Ratio (IV, Random, 95% CI) | 1.03 [0.71, 1.49] |
| 7.1 Pregabalin 300 mg/d | 3 | 738 | Risk Ratio (IV, Random, 95% CI) | 0.96 [0.50, 1.86] |
| 7.2 Pregabalin 450 mg/d | 3 | 741 | Risk Ratio (IV, Random, 95% CI) | 1.03 [0.52, 2.03] |
| 7.3 Pregabalin 600 mg/d | 3 | 752 | Risk Ratio (IV, Random, 95% CI) | 1.01 [0.55, 1.87] |
| 7.4 Pregabalin flexible 300 mg/d or 450 mg/d | 1 | 498 | Risk Ratio (IV, Random, 95% CI) | 2.98 [0.31, 28.42] |
| 8 Dizziness Show forest plot | 5 | 3257 | Risk Ratio (IV, Random, 95% CI) | 3.77 [3.06, 4.63] |
| 8.1 Pregabalin 150 mg/d | 1 | 175 | Risk Ratio (IV, Random, 95% CI) | 2.44 [0.91, 6.54] |
| 8.2 Pregabalin 300 mg/d | 4 | 916 | Risk Ratio (IV, Random, 95% CI) | 3.11 [2.09, 4.65] |
| 8.3 Pregabalin 450 mg/d | 4 | 917 | Risk Ratio (IV, Random, 95% CI) | 3.95 [2.68, 5.82] |
| 8.4 Pregabalin 600 mg/d | 3 | 751 | Risk Ratio (IV, Random, 95% CI) | 4.00 [2.65, 6.03] |
| 8.5 Pregabalin flexible 300 mg/d or 450 mg/d | 1 | 498 | Risk Ratio (IV, Random, 95% CI) | 4.89 [2.89, 8.28] |
| 9 30% pain reduction Show forest plot | 5 | 3259 | Risk Ratio (IV, Random, 95% CI) | 1.37 [1.22, 1.53] |
| 9.1 Pregabalin 150 mg/d | 1 | 176 | Risk Ratio (IV, Random, 95% CI) | 1.05 [0.62, 1.77] |
| 9.2 Pregabalin 300 mg/d | 4 | 916 | Risk Ratio (IV, Random, 95% CI) | 1.35 [1.08, 1.68] |
| 9.3 Pregabalin 450 mg/d | 4 | 917 | Risk Ratio (IV, Random, 95% CI) | 1.49 [1.20, 1.85] |
| 9.4 Pregabalin 600 mg/d | 3 | 752 | Risk Ratio (IV, Random, 95% CI) | 1.37 [1.07, 1.76] |
| 9.5 Pregabalin flexible 300 mg/d or 450 mg/d | 1 | 498 | Risk Ratio (IV, Random, 95% CI) | 1.32 [1.04, 1.68] |
| 10 Anxiety Show forest plot | 5 | 3214 | Std. Mean Difference (IV, Random, 95% CI) | ‐0.12 [‐0.20, ‐0.04] |
| 10.1 Pregabalin 150 mg/d | 1 | 166 | Std. Mean Difference (IV, Random, 95% CI) | 0.07 [‐0.28, 0.42] |
| 10.2 Pregabalin 300 mg/d | 4 | 903 | Std. Mean Difference (IV, Random, 95% CI) | ‐0.05 [‐0.20, 0.10] |
| 10.3 Pregabalin 450 mg/d | 4 | 900 | Std. Mean Difference (IV, Random, 95% CI) | ‐0.15 [‐0.30, 0.00] |
| 10.4 Pregabalin 600 mg/d | 3 | 749 | Std. Mean Difference (IV, Random, 95% CI) | ‐0.16 [‐0.32, 0.01] |
| 10.5 Pregabalin flexible 300 mg/d or 450 mg/d | 1 | 496 | Std. Mean Difference (IV, Random, 95% CI) | ‐0.17 [‐0.35, 0.01] |
| 11 Depression Show forest plot | 5 | 3212 | Std. Mean Difference (IV, Random, 95% CI) | ‐0.09 [‐0.16, ‐0.01] |
| 11.1 Pregabalin 150 mg/d | 1 | 165 | Std. Mean Difference (IV, Random, 95% CI) | ‐0.10 [‐0.45, 0.25] |
| 11.2 Pregabalin 300 mg/d | 4 | 902 | Std. Mean Difference (IV, Random, 95% CI) | ‐0.05 [‐0.20, 0.10] |
| 11.3 Pregabalin 450 mg/d | 4 | 900 | Std. Mean Difference (IV, Random, 95% CI) | ‐0.13 [‐0.28, 0.02] |
| 11.4 Pregabalin 600 mg/d | 3 | 749 | Std. Mean Difference (IV, Random, 95% CI) | ‐0.06 [‐0.23, 0.10] |
| 11.5 Pregabalin flexible 300 mg/d or 450 mg/d | 1 | 496 | Std. Mean Difference (IV, Random, 95% CI) | ‐0.09 [‐0.27, 0.08] |
| 12 Disability Show forest plot | 5 | 3145 | Std. Mean Difference (IV, Random, 95% CI) | ‐0.01 [‐0.11, 0.09] |
| 12.1 Pregabalin 150 mg/d | 1 | 166 | Std. Mean Difference (IV, Random, 95% CI) | 0.11 [‐0.24, 0.47] |
| 12.2 Pregabalin 300 mg/d | 4 | 879 | Std. Mean Difference (IV, Random, 95% CI) | 0.04 [‐0.11, 0.20] |
| 12.3 Pregabalin 450 mg/d | 4 | 888 | Std. Mean Difference (IV, Random, 95% CI) | 0.00 [‐0.17, 0.18] |
| 12.4 Pregabalin 600 mg/d | 3 | 714 | Std. Mean Difference (IV, Random, 95% CI) | 0.03 [‐0.14, 0.21] |
| 12.5 Pregabalin flexible 300 mg/d or 450 mg/d | 1 | 498 | Std. Mean Difference (IV, Random, 95% CI) | ‐0.29 [‐0.47, ‐0.12] |
| 13 Patient Global Impression of Change 'much' or 'very much' improved Show forest plot | 5 | 3183 | Risk Ratio (IV, Random, 95% CI) | 1.38 [1.23, 1.55] |
| 13.1 Pregabalin 150 mg/d | 1 | 175 | Risk Ratio (IV, Random, 95% CI) | 1.30 [0.74, 2.29] |
| 13.2 Pregabalin 300 mg/d | 4 | 886 | Risk Ratio (IV, Random, 95% CI) | 1.25 [0.99, 1.57] |
| 13.3 Pregabalin 450 mg/d | 4 | 892 | Risk Ratio (IV, Random, 95% CI) | 1.54 [1.15, 2.06] |
| 13.4 Pregabalin 600 mg/d | 3 | 734 | Risk Ratio (IV, Random, 95% CI) | 1.37 [1.06, 1.76] |
| 13.5 Pregabalin flexible 300 mg/d or 450 mg/d | 1 | 496 | Risk Ratio (IV, Random, 95% CI) | 1.44 [1.11, 1.87] |