Antidepresivos para pacientes con epilepsia y depresión
Resumen
Antecedentes
Los trastornos depresivos son la comorbilidad psiquiátrica más común en los pacientes con epilepsia, y afectan a alrededor de un tercio, con un impacto negativo significativo sobre la calidad de vida. Existen la preocupación de que los pacientes pueden no estar recibiendo el tratamiento apropiado para la depresión debido a la incertidumbre con respecto a qué antidepresivo o clase funciona mejor y al riesgo percibido de exacerbación de las crisis convulsivas. Esta revisión procura considerar estos temas e informar la práctica clínica y la investigación futura.
Objetivos
Se procuró examinar y sintetizar las pruebas de los ensayos controlados aleatorios sobre antidepresivos y los estudios prospectivos no aleatorios de antidepresivos utilizados para tratar la depresión en pacientes con epilepsia. Los objetivos primarios fueron la evaluación de la eficacia y la seguridad de los antidepresivos para el tratamiento de los síntomas depresivos y el efecto sobre la recurrencia de las crisis convulsivas.
Métodos de búsqueda
Se realizó una búsqueda en las siguientes bases de datos: registro especializado del Grupo Cochrane de Epilepsia (Cochrane Epilepsy Group); Registro Cochrane Central de Ensayos Controlados (Cochrane Central Register of Controlled Trials) (CENTRAL 2014, número 5), MEDLINE (Ovid), SCOPUS, PsycINFO, www.clinicaltrials.gov y actas de congresos, incluyendo estudios publicados hasta el 31 mayo 2014. No hubo restricciones de idioma.
Criterios de selección
Se incluyeron ensayos controlados aleatorios (ECA) y estudios de cohortes prospectivos, no aleatorios, controlados y no controlados que investigaran a niños o adultos con epilepsia tratados con un antidepresivo para los síntomas depresivos. El grupo de intervención constó de pacientes que recibían un fármaco antidepresivo además de un régimen farmacológico antiepiléptico existente. Los grupos de control constaron de pacientes que recibían un placebo, un antidepresivo comparativo, psicoterapia o ningún tratamiento además de un régimen farmacológico antiepiléptico existente.
Obtención y análisis de los datos
Se extrajeron los datos sobre los factores del diseño de ensayo, las demografías de los pacientes y los resultados para cada estudio. Los resultados primarios fueron los cambios en las puntuaciones de la depresión (proporción con una mejoría mayor al 50% o diferencia de medias) y el cambio en la frecuencia de las crisis convulsivas (diferencia de medias o porcentaje con recurrencia de las crisis convulsivas o episodio de estado epiléptico, o ambos). Los resultados secundarios incluyeron el número de pacientes que se retiraron del estudio y las razones de los retiros, así como cualquier evento adverso. Dos autores realizaron la extracción de datos por separado para cada estudio incluido. Luego la extracción de datos se verificó de forma cruzada. El riesgo de sesgo se evaluó mediante una versión extendida de la herramienta de la Colaboración Cochrane para evaluar el riesgo de sesgo en estudios tanto aleatorios como no aleatorios. Los resultados binarios se presentaron como cocientes de riesgos (CR) con intervalos de confianza (IC) del 95%. Los resultados continuos se presentaron como diferencias de medias estandarizadas (DME) con IC del 95%, y diferencias de medias (DM) con IC del 95%. Si era factible, se programó utilizar las técnicas de metarregresión para investigar las fuentes posibles de heterogeneidad. Sin embargo, lo anterior no fue posible debido a la falta de datos.
Resultados principales
La revisión incluyó ocho estudios (tres ECA y cinco estudios de cohortes prospectivos) con 471 pacientes con epilepsia tratados con un antidepresivo. Todos los ECA eran estudios realizados en único centro que comparaban un antidepresivo versus control activo, placebo o ningún tratamiento. Los cinco estudios de cohortes prospectivos no aleatorios informaron sobre los resultados principalmente en pacientes con epilepsia parcial tratados por depresión con un inhibidor selectivo de la recaptación de serotonina (ISRS). Se calificaron todos los ECA y un estudio de cohortes prospectivo como en riesgo incierto de sesgo. Los otros cuatro estudios de cohortes prospectivos se calificaron como en riesgo alto de sesgo. No fue posible realizar metanálisis para la proporción con una mejoría mayor al 50% en las puntuaciones de la depresión debido a que los estudios informaron diferentes comparaciones de los tratamientos. Los resultados se presentan descriptivamente y muestran una tasa variada de pacientes que responden de entre un 24% y un 97%, según el antidepresivo administrado. Para la diferencia de medias en la puntuación de la depresión fue posible realizar un metanálisis limitado de dos estudios de cohortes prospectivos del citalopram, que incluyó a un total de 88 pacientes. El mismo proporcionó pruebas de baja calidad para el cálculo del efecto de 1,17 (IC del 95%: 0,96 a 1,38) en las puntuaciones de la depresión. Los datos de la frecuencia de las crisis convulsivas no se informaron en ningún ECA y no fue posible realizar un metanálisis para los estudios de cohortes prospectivos debido a las diferentes comparaciones de los tratamientos. Los resultados se presentan descriptivamente e indican que el tratamiento en tres estudios con un inhibidor selectivo de la recaptación de serotonina no aumentó significativamente la frecuencia de las crisis convulsivas. Los pacientes que recibieron un antidepresivo eran más propensos a retirarse debido a eventos adversos que a la ineficacia. Los eventos adversos informados para los ISRS incluyeron náuseas, mareos, sedación, trastornos gastrointestinales y disfunción sexual. A través de tres comparaciones, las pruebas se consideraron como de calidad moderada debido al reducido tamaño de los estudios que contribuyeron con datos, y sólo un estudio contribuyó a cada comparación. Las pruebas para la comparación final se consideraron de baja calidad debido a que hubo inquietudes en cuanto a los métodos de estudio en los dos estudios que contribuyeron con datos.
Conclusiones de los autores
Las pruebas existentes sobre la efectividad de los antidepresivos para el tratamiento de los síntomas depresivos asociados con la epilepsia son muy limitadas. Sólo un ECA pequeño demostró un efecto estadísticamente significativo de la venlafaxina sobre los síntomas depresivos. No existen pruebas de alta calidad para informar la elección del fármaco antidepresivo o la clase de fármaco para el tratamiento de la depresión en pacientes con epilepsia. Esta revisión aporta pruebas de baja calidad de la seguridad en cuanto a la exacerbación de las crisis convulsivas con los ISRS, aunque no hay datos comparativos disponibles sobre las clases de antidepresivos y la seguridad con relación a las crisis convulsivas. Actualmente no hay datos comparativos sobre los antidepresivos y la psicoterapia para el tratamiento de la depresión en pacientes con epilepsia. Sin embargo, la psicoterapia podría considerarse en los pacientes renuentes a la administración de antidepresivos o en los que se observan efectos secundarios inadmisibles. Se necesitan ensayos clínicos comparativos adicionales de los antidepresivos y la psicoterapia en cohortes grandes de pacientes con epilepsia y depresión para informar mejor la política de tratamiento en el futuro.
PICO
Resumen en términos sencillos
Antidepresivos para los pacientes con epilepsia y depresión
Antecedentes
Los trastornos depresivos ocurren en aproximadamente un tercio de los pacientes con epilepsia, y a menudo requieren tratamiento antidepresivo. Sin embargo, la depresión a menudo no se trata en los pacientes con epilepsia, en parte debido al temor de que los antidepresivos puedan causar crisis convulsivas. Aunque existen diferentes clases de antidepresivos, todos procuran aumentar los neurotransmisores clave en el cerebro, y de ese modo aliviar los síntomas depresivos.
Características de los estudios
Se realizó una búsqueda en bases de datos el 31 de mayo de 2014. Se encontraron ocho estudios que incluyeron a 471 pacientes con epilepsia tratados con un antidepresivo. Tres eran ensayos controlados aleatorios y cinco eran estudios de cohortes prospectivos no aleatorios. Los estudios observaron el efecto de diferentes antidepresivos, principalmente una clase de antidepresivo denominado inhibidor selectivo de la recaptación de serotonina (ISRS).
Resultados
Al tener en cuenta todas las pruebas, la revisión halló que hay pruebas muy limitadas que demuestran un efecto significativo de los antidepresivos en los síntomas depresivos en pacientes con epilepsia. Hubo información limitada sobre el efecto de los antidepresivos sobre el control de las crisis convulsivas; sin embargo, en los estudios que informaron este resultado, no pareció haber un empeoramiento significativo de las crisis convulsivas.
Calidad los estudios
Se evaluaron los estudios con respecto al sesgo y la calidad. En general, la calidad de las pruebas se consideró moderada para los ensayos clínicos y baja para los estudios de cohortes prospectivos no aleatorios. Se necesitan ensayos adicionales más amplios y de alta calidad de los antidepresivos para examinar las comparaciones de las diferentes clases de antidepresivos y cuál es el impacto probable en el control de las crisis convulsivas.
Authors' conclusions
Summary of findings
| Paroxetine compared to doxepin for people with epilepsy and depression | ||||||
| Patient or population: people with epilepsy and depression | ||||||
| Outcomes | Illustrative comparative risks* (95% CI) | Relative effect | No of participants | Quality of the evidence | Comments | |
| Assumed risk | Corresponding risk | |||||
| Doxepin | Paroxetine | |||||
| > 50% reduction in depressive symptoms | 706 per 1000 | 819 per 1000 | RR 1.16 | 67 | ⊕⊕⊕⊝1 | Only 1 study examined the influence of paroxetine versus doxepin on reduction in depression and it found no significant difference between the 2 drugs |
| Mean depression scores ‐ HAMD scores | The mean HAMD depression score in the intervention groups was | 67 | ⊕⊕⊕⊝1 | In the same study no differences were found between mean depression scores in patients taking paroxetine compared to those taking doxepin | ||
| Seizure frequency | ‐ | ‐ | ‐ | 0 (0 studies) | ‐ | No data contributed to this outcome |
| Withdrawals (specific reasons) | 88 per 1000 | 13 per 1000 | RR 0.15 | 67 | ⊕⊕⊕⊝1 | In this study 0 patients withdrew from the paroxetine group and 3 withdrew from the doxepin group. No significant difference was found between the 2 groups |
| Cognitive functioning | ‐ | ‐ | ‐ | 0 (0 studies) | ‐ | No data contributed to this outcome |
| Quality of life | ‐ | ‐ | ‐ | 0 (0 studies) | ‐ | No data contributed to this outcome |
| Adverse effects | ‐ | ‐ | ‐ | 0 (0 studies) | ‐ | No data contributed to this outcome |
| *The basis for the assumed risk (e.g. the median control group risk across studies) is provided in footnotes. The corresponding risk (and its 95% confidence interval) is based on the assumed risk in the comparison group and the relative effect of the intervention (and its 95% CI). | ||||||
| GRADE Working Group grades of evidence | ||||||
| 1Quality downgraded for imprecision due to only one study contributing to the outcomes and it was a small study. | ||||||
| Amitriptyline compared to nomifensine for people with epilepsy and depression | ||||||
| Patient or population: people with epilepsy and depression | ||||||
| Outcomes | Illustrative comparative risks* (95% CI) | Relative effect | No of participants | Quality of the evidence | Comments | |
| Assumed risk | Corresponding risk | |||||
| Nomifensine | Amitriptyline | |||||
| > 50% reduction in depressive symptoms | 786 per 1000 | 432 per 1000 | RR 0.55 | 28 | ⊕⊕⊕⊝1 | 1 study compared amitriptyline and nomifensine in reducing seizures and there was no significant difference found between the 2 groups |
| Seizure frequency | ‐ | ‐ | ‐ | 0 (0 studies) | ‐ | No data contributed to this outcome |
| Withdrawals | ‐ | ‐ | ‐ | 0 | ‐ | No data contributed to this outcome |
| Cognitive functioning | ‐ | ‐ | ‐ | 0 (0 studies) | ‐ | No data contributed to this outcome |
| Quality of life | ‐ | ‐ | ‐ | 0 (0 studies) | ‐ | No data contributed to this outcome |
| Adverse effects | ‐ | ‐ | ‐ | 0 (0 studies) | ‐ | No data contributed to this outcome |
| *The basis for the assumed risk (e.g. the median control group risk across studies) is provided in footnotes. The corresponding risk (and its 95% confidence interval) is based on the assumed risk in the comparison group and the relative effect of the intervention (and its 95% CI). | ||||||
| GRADE Working Group grades of evidence | ||||||
| 1Quality downgraded for imprecision due to only one study contributing to the outcomes and it was a small study. | ||||||
| Venlafaxine compared to no treatment for people with epilepsy and depression | ||||||
| Patient or population: people with epilepsy and depression | ||||||
| Outcomes | Illustrative comparative risks* (95% CI) | Relative effect | No of participants | Quality of the evidence | Comments | |
| Assumed risk | Corresponding risk | |||||
| No treatment | Venlafaxine | |||||
| > 50% reduction in depressive symptoms | 125 per 1000 | 406 per 1000 | RR 3.25 | 64 | ⊕⊕⊕⊝1 moderate | 1 study compared venlafaxine to a no treatment control group and found that venlafaxine was more than 3 times more effective in reducing seizures compared to controls |
| Mean depression scores ‐ HAMD | The mean HAMD depression score in the intervention groups was | 64 | ⊕⊕⊕⊝1 | The same study found mean depression scores to be significantly lower in the venlafaxine group compared to the control group | ||
| Seizure frequency | ‐ | ‐ | ‐ | 0 (0 studies) | ‐ | No data contributed to this outcome |
| Withdrawals | ‐ | ‐ | ‐ | 0 | ‐ | No data contributed to this outcome |
| Cognitive functioning | ‐ | ‐ | ‐ | 0 (0 studies) | ‐ | No data contributed to this outcome |
| Quality of life | ‐ | ‐ | ‐ | 0 (0 studies) | ‐ | No data contributed to this outcome |
| Adverse effects | ‐ | ‐ | ‐ | 0 (0 studies) | ‐ | No data contributed to this outcome |
| *The basis for the assumed risk (e.g. the median control group risk across studies) is provided in footnotes. The corresponding risk (and its 95% confidence interval) is based on the assumed risk in the comparison group and the relative effect of the intervention (and its 95% CI). | ||||||
| GRADE Working Group grades of evidence | ||||||
| 1Quality downgraded for imprecision due to only one study contributing to the outcomes and it was a small study. | ||||||
| Citalopram (before and after) for people with epilepsy and depression | ||||
| Patient or population: people with epilepsy and depression | ||||
| Outcomes | Illustrative comparative risks* (95% CI) | No of participants | Quality of the evidence | Comments |
| Corresponding risk | ||||
| Citalopram (before and after) | ||||
| Mean depression scores ‐ HAMD | The mean HAMD depression score in the intervention groups was | 88 | ⊕⊕⊝⊝ | 2 before and after studies investigated citalopram and found that depression scores were significantly lower after treatment |
| Mean monthly seizure frequency | 88 | ⊕⊝⊝⊝ | 2 studies found mixed evidence for the effect of citalopram on seizure frequency. Due to high heterogeneity the overall effect estimate is not presented | |
| *The basis for the assumed risk (e.g. the median control group risk across studies) is provided in footnotes. The corresponding risk (and its 95% confidence interval) is based on the assumed risk in the comparison group and the relative effect of the intervention (and its 95% CI). | ||||
| GRADE Working Group grades of evidence | ||||
| 1Across the studies there were concerns about bias with regards to the methods of blinding and methods to deal with confounding variables. | ||||
Background
Description of the condition
Depressive disorders are the most common psychiatric comorbidity in patients with epilepsy (Tellez‐Zenteno 2007), and they are the strongest predictor of poor quality of life (Boylan 2004). Symptoms of depression include low mood, tiredness and apathy. Sleep and cognitive functioning may also be affected. Depressive disorders occur in approximately one‐third of patients with epilepsy (Baker 1996; Indaco 1992; Jacoby 1996; Mendez 1986). These disorders are broadly divided into unipolar (depression only) and bipolar disorders (depression associated with mania or hypomania) (American Psychiatric Association 2000). Depressive disorders in epilepsy may be mediated via the interplay of neurobiological, psychosocial and iatrogenic factors (Lambert 1999). Depressive symptoms or episodes may occur inter‐ictally (i.e. they appear unrelated to seizures) or peri‐ictally (preceding, during or following seizures). This is an important distinction as patients may require modification of their antiepileptic drug regime, commencement of antidepressant drug therapy, or both. In some patients the depressive symptoms may follow a significant period of seizure remission in previously uncontrolled epilepsy, thought to occur via neuro‐biochemical changes and termed 'forced normalisation' (Trimble 1998). Studies examining clinical predictors of risk for depression in patients with epilepsy have produced inconsistent results (Lin 2012). There is a perceived greater risk of depression in patients with temporal lobe epilepsy, although elevated rates of depression have been found in generalised and extra‐temporal focal epilepsy (Adams 2008). Epilepsy related factors as predictors of risk for depression are inconsistent. Psychosocial factors such as life stress, coping style, social support, perceived stigma and personality are more consistent predictors of depression in patients with epilepsy (Hermann 2000).
In 2008, the Food and Drug Administration issued a health alert about an increased risk of suicidal ideation in patients taking antiepileptic drugs (Hesdorffer 2009). This alert was based on a meta‐analysis of approximately 28,000 patients who had participated in randomised controlled trials (RCTs) investigating 11 antiepileptic drugs. There were four completed suicides, all of whom had taken antiepileptic drugs, compared to no cases of suicide in the placebo groups (odds ratio (OR) 1.8; 95% confidence interval (CI) 1.24 to 2.66). Since this alert, a number of observational studies have investigated the association, reporting conflicting results, and a recent consensus statement on risk of suicide with antiepileptic drugs has been published by the International League Against Epilepsy (ILAE) Commission on Neuropsychobiology (Mula 2013). Whilst the exact risk of suicide with antiepileptic drugs is unknown, depression as a treatment‐emergent adverse effect is associated with some antiepileptic drugs (GABAergic antiepileptic drugs: benzodiazepines, vigabatrin, gabapentin and also topiramate, levetiracetam and zonisamide) (Mula 2009). Other antiepileptic drugs appear to have mood‐stabilising properties (valproic acid, lamotrigine, carbamazepine, oxcarbazepine), which may benefit patients with epilepsy and depression. Enzyme‐inducing antiepileptic drugs (i.e. carbamazepine) may lower plasma levels of antidepressants, thus impacting on their effectiveness.
Case‐control studies have shown that patients with depression have a two‐ to seven‐fold higher risk of developing epilepsy, implying a bi‐directional relationship (Hesdorffer 2000; Hesdorffer 2006; Hesdorffer 2012). There could be a number of factors to explain this, for example shared pathophysiology involving disturbance in several key neurotransmitter systems (Bagdy 2007), structural lesions (frontal lobe tumours) or a genetic susceptibility. However, there is also the possibility that the use of antidepressants may trigger seizures. This is a common concern for healthcare professionals and may influence decisions to start antidepressant treatment (Cotterman‐Hart 2010).
Description of the intervention
Antidepressants are a heterogeneous class of drugs that have been the mainstay of pharmacological treatment in treating depressive disorders. There are 10 classes of antidepressants used to treat depressive disorders, with 60% to 70% of depressive episodes responding to current treatment (Klerman 1990; Sackeim 2006). These are:
-
tricyclic antidepressants;
-
selective serotonin reuptake inhibitors;
-
serotonin‐norepinephrine reuptake inhibitors;
-
monoamine oxidase inhibitors;
-
serotonin/antagonist reuptake inhibitors (i.e. trazodone);
-
dopamine and norepinephrine reuptake inhibitors (i.e. bupropion);
-
a‐2 antagonists (i.e. mirtazapine);
-
norepinephrine reuptake inhibitors (i.e. reboxetine);
-
selective serotonin reuptake enhancers (i.e. tianeptine); and
-
serotonin 5HT2C receptor antagonists (i.e. agomelatine).
These drugs work by targeting serotonergic and/or noradrenergic and/or dopaminergic neurotransmission, with the aim of increasing their synaptic concentrations (Stahl 2000). Glutamate antagonists represent a novel class of drug currently being tested in refractory depression (Zarate 2006).
The risk of seizures with antidepressants was reported in early studies of the first‐generation antidepressants, notably tricyclic antidepressants (Preskorn 1992; Wroblewski 1990). Alper 2007 reviewed the incidence of seizures in 75,000 non‐epileptic patients in phase II and phase III trials of antidepressant treatment. It reported lower incidence rates of seizures in those randomised to an antidepressant versus placebo (standardised incidence ratio 0.48; 95% CI 0.36 to 0.61) (Alper 2007). Coupland 2011 examined 60,746 primary care patients aged 65 and over treated for depression with antidepressants between 1996 and 2007 and showed increased risks of epilepsy/seizures for selective serotonin reuptake inhibitors (hazard ratio (HR) 1.80; 95% CI 1.32 to 2.43) and other antidepressant classes (HR 2.20; 95% CI 1.46 to 3.30) versus tricyclic antidepressants. Venlafaxine was associated with the highest risk of seizures.
How the intervention might work
There appears to be a significant relationship between epilepsy and depression. It is emerging from the studies that they both share common neurobiological substrates involving hyperactivity of the hypothalamic pituitary adrenal axis and disturbance of different neurotransmitter systems, mainly serotonin and norepinephrine (Dell'osso 2013). The density of serotonin receptors is high in the mesial temporal and prefrontal areas (Gilliam 2005b). In critical brain regions, such as the limbic system and prefrontal areas, enforced serotonergic circuits seem to be responsible for increasing seizure threshold (Kondziella 2009).
Antidepressants of the selective serotonin reuptake inhibitor family have been reported not only to be safe in treating depression in patients with epilepsy but to possess antiepileptic properties, as shown in animal models of epilepsy (Hamid 2013). It has been suggested based on clinical data that selective serotonin reuptake inhibitors can decrease the seizure frequency in refractory epilepsy (Kondziella 2009). This is believed to be due to the increase in the concentration of serotonin. The study shows that the concentration of endogenous serotonin (5‐HT) and the activity of its receptor subtypes, 5–HT(1A), 5‐HT(2C), 5‐HT(3) and 5–HT(7), play a significant role in the pathogenesis of epilepsies (Bagdy 2007). Medications with serotonin agonist and antagonist properties can therefore play a significant role in the pathogenesis of epilepsies.
Why it is important to do this review
Depression is common in patients with epilepsy and has a significant negative impact on quality of life (Gilliam 2005b; Kondziella 2009). There is concern that patients may not be receiving appropriate treatment for their depression because of uncertainty regarding which antidepressant or class works best and the perceived risk of exacerbating seizures. This review aims to address these issues and inform clinical practice and future research.
Objectives
We aimed to review and synthesise evidence from randomised controlled trials of antidepressants and prospective non‐randomised studies of antidepressants used for treating depression in patients with epilepsy. The primary objectives were to evaluate the efficacy and safety of antidepressants in treating depressive symptoms and the effect on seizure recurrence.
Methods
Criteria for considering studies for this review
Types of studies
-
Randomised controlled trials (RCTs)
-
Prospective non‐randomised cohort controlled and uncontrolled studies
-
Prospective non‐randomised cohort studies were considered in this review because of the known delayed effect of antidepressants on depressive symptoms which may not be effectively detected in short‐term randomised trials. Similarly, prospective non‐randomised studies are more likely to recruit populations of patients which better reflect clinical practice since depression can affect any patient with epilepsy.
-
Types of participants
We considered participants who satisfied all of the following criteria:
-
any age;
-
diagnosis of epilepsy (any type);
-
treated with antidepressants for co‐existing depression (including patients with major depressive disorder, adjustment disorder and dysthymic disorder) based on standardised criteria and/or according to participant scores on validated tools (e.g. Hamilton Rating Scale for Depression).
Types of interventions
-
Intervention group: patients who received an antidepressant drug in addition to an existing antiepileptic drug regimen.
-
Control group(s): patients who received a placebo, comparative antidepressant, psychotherapy or no treatment in addition to an existing antiepileptic drug regimen.
Types of outcome measures
Primary outcomes
-
Depression scores
-
The proportion of people with a greater than 50% improvement in depressive symptoms (defined as a 'response')
-
Mean difference in depression scores
-
If the data allowed, we planned to analyse outcomes at ≤ 12 weeks (short‐term), 13 to 26 weeks and ≥ 26 weeks (long‐term) however we were unable to perform these analyses.
-
Change in seizure frequency
-
The mean difference in seizure frequency
-
The proportion of people with a seizure recurrence
-
The proportion of people with an episode of status epilepticus
-
Secondary outcomes
-
Withdrawals
-
For specific reasons
-
For any reasons
-
-
Global state
-
Clinically important change in global state (as defined by the individual studies)
-
Relapse (as defined by the individual studies)
-
-
Mental state
-
Clinically important change in general mental state score
-
General mental state score (average and endpoint)
-
Clinically important change in specific symptoms (sleep, anhedonia, suicidal ideas)
-
Specific symptom score (average and endpoint)
-
-
General functioning
-
Clinically important change in general functioning
-
General functioning score (average and endpoint)
-
-
Cognitive functioning
-
Clinically important change in overall cognitive functioning
-
Overall cognitive functioning score (endpoint and average)
-
Clinically important change in specific cognitive functioning (attention, concentration, memory, language, executive functioning)
-
Specific cognitive score (average and endpoint)
-
-
Quality of life
-
Clinically important change in quality of life
-
Any change in quality of life score (average and endpoint)
-
-
Behaviour
-
Clinically important change in general behaviour
-
Any important change in general behaviour (average and endpoint)
-
Clinically important change in specific aspects of behaviour
-
Any important change in specific aspects of behaviour score (average and endpoint)
-
-
Adverse effects
-
Death
-
Any non‐serious general adverse effects (gastrointestinal effects, anorexia, dizziness, dry mouth, insomnia, sexual dysfunction, hypotension)
-
Any serious, specific adverse effects (hypersensitivity reaction)
-
Any change in general adverse effect score (average and endpoint)
-
Clinically important change in specific adverse effects
-
Any change in specific adverse effects score (average and endpoint)
-
Search methods for identification of studies
Electronic searches
We searched the following databases (search date 31 May 2014):
-
the Cochrane Epilepsy Group Specialised Register;
-
the Cochrane Central Register of Controlled Trials (CENTRAL 2014, Issue 5) (Appendix 1);
-
MEDLINE (Ovid) (Appendix 2);
-
SCOPUS;
-
PsycINFO; and
We adapted the MEDLINE search strategy for the SCOPUS and PsycINFO databases. There were no language restrictions.
Searching other resources
We checked the reference lists of retrieved studies for additional reports of relevant studies.
We contacted lead authors for any relevant unpublished material.
We identified duplicate studies by screening reports according to title, authors names, location and medical institute. We omitted any duplicated studies.
We also identified any grey literature studies published in the last five years by searching:
-
ZETOC database;
-
ISI Proceedings;
-
International Bureau for Epilepsy (IBE) congress proceedings database;
-
ILAE congress proceedings database; and
-
abstract books of symposia and congresses, meeting abstracts and research reports.
Data collection and analysis
Selection of studies
Two authors (MM, JP) independently assessed all citations generated from the searches for inclusion. A third author (JS) re‐inspected a random sample of 30% of citations to ensure reliability. Where disputes arose, we acquired the full report for more detailed scrutiny.
Data extraction and management
Two authors (MM, JP) undertook data extraction separately for each included study. We then cross‐checked the data extraction. We extracted data using pre‐standardised data extraction forms. A third author (JS) re‐inspected a random 30% sample to ensure reliability. We discussed any disagreement, documented decisions and, if necessary, contacted trialists for clarification.
We extracted the following information from the included studies:
Methodological and trial design
-
Year of publication
-
Number of study centres
-
Language
-
Industry funding
-
Study design (RCT, prospective cohort study, retrospective cohort study)
-
Blinding
-
Type of control group (placebo, comparative antidepressant, no treatment)
-
Sample size
-
Follow‐up period
-
Class of antidepressant as intervention
-
Dose range of intervention
-
Inclusion and exclusion criteria
Patient demographic information
-
Age range
-
Number of male/female participants
-
Duration of epilepsy
-
Previous number of antiepileptic drugs
-
Epilepsy type (focal, generalised, unclassified)
-
Location of epilepsy (temporal, extra‐temporal)
-
Baseline mean depression score or severity
-
Baseline mean seizure frequency/month
Outcomes
-
The number of patients experiencing each outcome recorded per treatment group
-
Number of drop‐outs
Assessment of risk of bias in included studies
Two authors (JP, MM) assessed risk of bias in each included study separately. We cross‐checked the 'Risk of bias' assessment. Due to the observational design of some of the studies, we utilised a version of the extended Cochrane Collaboration tool for assessing risk of bias, currently being developed by the Cochrane Non‐Randomised Studies Methods Group. The tool examined selection bias (sequence generation, allocation concealment), performance bias (blinding), attrition bias (incomplete outcome data), detection bias (blinding, other potential threats to validity), reporting bias (selective outcome reporting) and the influence of confounding variables. We rated the domains of blinding, incomplete outcome data, selective outcome reporting, confounding variables and other bias on a five‐point scale ranging from low to high risk of bias according to the risk for the outcome (Appendix 3). The review authors determined the parameters of this scale (Table 1).
| 1 Low risk | 2 | 3 | 4 | 5 High risk | |
| Confounding | All important1 confounders considered2 and suitable method of adjustment3 employed. Outcome unlikely to be affected | Most important4 confounders considered and suitable method of adjustment employed. Outcome unlikely to be affected | Some confounders5 considered and full or partial adjustment employed6. Possible implication for outcome | Some confounders considered and no adjustment employed. Likely to affect outcome | No important confounders considered and no adjustment employed. Likely to affect outcome |
| Blinding | Assessors blinded to participant's drug regime and participants blinded to drug regime. Outcome unlikely to be affected | Assessors blinded to participant's drug regime. Outcome unlikely to be affected | Partial blinding7 involved in study. Possible implication for outcome | Partial or no blinding involved in study. Outcome likely to be affected | No blinding involved in study. Outcome likely to be affected |
| Incomplete outcome data | No missing data and/or appropriate analysis8 used to deal with missing data. Unlikely to affect outcome | Smaller amount (< 25%) of missing data with reasons given, balanced across groups. Unlikely to affect outcome | Larger amount of missing data (> 25%) with or without reasons given, balanced across groups. Possible implication for outcome | Larger amount (> 25%) of missing data, imbalance across groups. Outcome likely to be affected | No information provided regarding missing data. Likely to affect outcome |
| Selective outcome reporting | A priori outcomes measured, analysed and reported in main report. Protocol available. Unlikely to affect outcome | A priori outcomes measured, analysed and reported in main report9. Protocol not available. Unlikely to affect outcomes | Limited information regarding a priori outcomes and measures. Possible implication for outcome | Outcomes measured but not analysed or reported | Outcomes measured but not analysed or reported and clinical judgement infers the presence of an unreported measured outcome10 |
| Other bias | No bias identified | Bias identified. Unlikely to affect outcome | Bias identified. Possible implication for outcome | Bias identified. Likely to affect outcome | Bias identified. Extremely likely to affect outcome |
1Important confounders include:
-
mean age;
-
epilepsy type;
-
mean duration of epilepsy;
-
location of epilepsy;
-
mean baseline seizure frequency;
-
mean baseline depression score.
2Reported demographic information and other confounders.
3Matching scores, multiple regression, analysis of co‐variance, stratification.
4At least four out of six of important confounders including: mean baseline depression score and mean baseline seizure frequency.
5At least two out of six of the important confounders.
6Full adjustment of confounding variables, e.g. see footnote 2, or partial adjustment, e.g. researchers select limited number of variables to adjust for.
7Assessors of outcome are only blinded to certain groups, e.g. blinded to intervention group but not controls.
8Intention‐to‐treat analysis.
9An a priori statement is made in the methods section of the main report regarding measurement and analysis of outcome.
10For example, failure to report full‐scale depression score when all other indices are reported.
For RCTs, we assessed all domains of the current Cochrane Collaboration tool for assessing risk of bias (Higgins 2011).
We made an overall summary judgement of risk of bias for each study per outcome, followed by an overall judgement per outcome across studies. We had planned to incorporate the 'Risk of bias' judgements into the analysis using sensitivity analysis in that a secondary analysis of the data including only studies rated as low risk of bias was to be carried out. However; we were unable to do this due to the small amount of studies and lack of data. We presented both results in the Results section of the review. Where applicable, we created 'Summary of findings' tables for outcomes and graded each outcome accordingly using the Grading of Recommendations Assessment, Development and Evaluation (GRADE) approach (Guyatt 2008). Outcomes to be reported in summary of findings tables include:‐ depression scores, seizure frequency, withdrawals, general functioning, cognitive functioning, quality of life and adverse effects as these outcomes are most likely to be measured and reported.
Measures of treatment effect
For binary outcomes (50% or greater improvement in depressive symptoms and % treatment withdrawal), we presented results as risk ratios (RRs) with 95% CIs.
For continuous outcomes (mean change in depression score), we presented results as mean differences (MDs) or standardised mean differences (SMDs) with 95% CIs.
Unit of analysis issues
Studies using a variety of depression measures created issues when combining results in meta‐analysis. Where appropriate we used the SMD to allow for these variances.
Dealing with missing data
We sought missing statistics from studies through contact with the study authors. We sought reasons for missing data to determine whether the data were missing at random or not. We found no data missing at random.
Assessment of heterogeneity
We assessed clinical heterogeneity by comparing the distribution of important patient factors between studies (age, epilepsy type, duration of epilepsy, baseline depression score, baseline seizure frequency) and trial factors (study design, type of control group, antidepressant drug class, type of depression disorder). We assessed statistical heterogeneity by using the I2 statistic, with an I2 value of 75% or more indicating considerable heterogeneity, 50% to 90% indicating substantial heterogeneity and 30% to 60% indicating moderate heterogeneity. If the I2 value was 75% or more, we had made an a priori decision not to carry out meta‐analysis; the review would then take a narrative form and all comparisons would be discussed according to the findings presented within the studies. We planned meta‐regression techniques where possible to investigate possible sources of heterogeneity, however we were unable to investigate this within this review.
Assessment of reporting biases
1. Protocol versus full study
We investigated outcome reporting bias using the ORBIT classification system, allocating studies a letter from A‐I if selective outcome reporting bias was suspected to be present (Kirkham 2010).
2. Funnel plot
Reporting biases arise when the dissemination of research findings is influenced by the nature and direction of results (Higgins 2011; Sterne 2000). Funnel plots can be used in investigating reporting biases but are of limited power to detect small‐study effects. We did not use funnel plots for outcomes where there were 10 or fewer studies, or where all studies were of similar sizes.
Data synthesis
We synthesised data using the RR, the MD or the SMD depending on the measures used in both the controlled and uncontrolled studies. We carried out a sensitivity analysis to check for differences between a random‐effects model and fixed‐effect model in influencing conclusions. If differences between the models existed, we intended to report outcomes based on the random‐effects model, which incorporates an assumption that the different studies are estimating different, yet related, intervention effects.
For controlled studies we intended to carry out meta‐analysis using the Mantel‐Haenszel method for dichotomous outcomes and the inverse variance method for continuous outcomes. For before and after studies we used the inverse variance methods for continuous outcomes in meta‐analysis.
We did not combine data for outcomes using both randomised and non‐randomised studies. We reported combined data on outcomes for randomised and non‐randomised studies separately.
Comparisons we expected to carry out included:
-
intervention group versus controls for change in mean depression score;
-
intervention group versus controls on % achieving a 50% improvement in depression scores;
-
intervention group versus controls for change in mean seizure frequency;
-
intervention versus controls on % of patients withdrawing from treatment.
We stratified each comparison by type of control group, study design and/or study characteristics to ensure appropriate combination of study data.
Subgroup analysis and investigation of heterogeneity
We stratified subgroup analysis by antidepressant drug class, epilepsy type and age. For investigation of heterogeneity, please see Assessment of heterogeneity.
Sensitivity analysis
We intended to carry out sensitivity analysis if peculiarities in study quality were found (Assessment of risk of bias in included studies). We reported the analysis for all studies and then compared this to an analysis only of studies at low risk of bias.
Results
Description of studies
Results of the search
The searches, outlined above, identified 14 eligible studies. Figure 1 outlines the flow diagram of search results, eligible records and study exclusions.
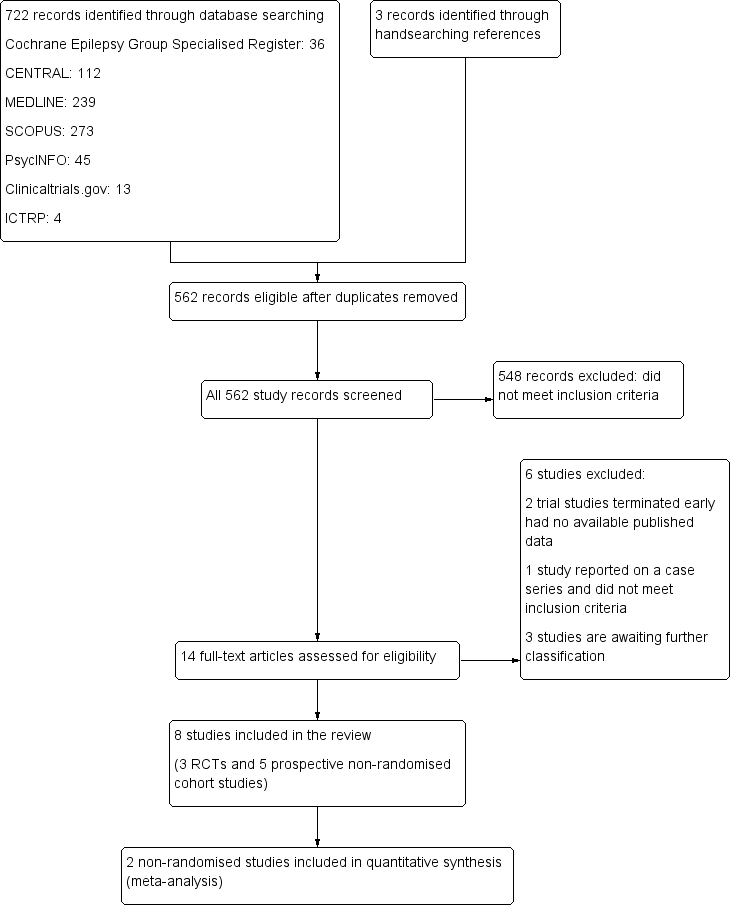
Study flow diagram.
After exclusions 11 studies remained. Three studies are awaiting further classification. Two studies met our inclusion criteria but did not report results for any of the primary or secondary outcomes (Harmant 1990; Machado 2010). We attempted to contact the authors for any further information on outcomes but we have not received a response. A further study, identified through www.clinicaltrials.gov, completed in September 2013 and compared escitalopram versus placebo (Conrad 2013). We attempted to contact the trial author for further information on outcomes but received no response.
Included studies
The eight remaining studies met all of the inclusion criteria. Of these eight reports, we identified three randomised controlled trials and five non‐randomised prospective cohort studies examining the effect of antidepressant drugs.
We found three randomised trials of antidepressant versus active control, placebo or no treatment, which reported on the primary efficacy outcome and which met the inclusion criteria (Li 2005; Robertson 1985; Zhu 2004). All were single‐centre studies. A total of 173 patients were randomised in these three studies, with 121 patients having partial epilepsy. The remaining five non‐randomised prospective cohort studies reported on a total of 298 patients treated with an antidepressant, reported on the primary efficacy outcome and met the inclusion criteria (Hovorka 2000; Kanner 2000; Kuhn 2003; Specchio 2004; Thome‐Souza 2007). Two hundred and eighty‐two patients had partial epilepsy and were treated with a selective serotonin reuptake inhibitor.
Hovorka 2000 was a published, single‐centre, prospective cohort study conducted in the Czech Republic on 43 patients. Two‐thirds of patients had focal epilepsy. Patients were between the ages of 12 and 49 years and 35 patients were female. Inclusion criteria were defined as patients with a major depressive illness scoring more than 15 points on the Hamilton Rating Scale for Depression (HAMD). All patients received citalopram (mean daily dose 22.6 mg +/‐ 8.3 mg) for eight weeks. At four and eight weeks, depression scores and seizure frequencies were measured and compared to an unspecified baseline period. There were no treatment withdrawals and all 43 patients were included in the reported analysis.
Kanner 2000 was a published, single‐centre, prospective cohort study conducted in the USA on 100 patients. Patients were aged between 6 and 62 years, 95% had focal onset epilepsy and 49 patients were female. Inclusion criteria were defined as patients with epilepsy and a depressive illness or obsessive compulsive disorder (n = 3). All patients received sertraline (25 mg to 200 mg/day; mean dose of 108 mg +/‐ 56.9 mg per day) and were followed up for 0.2 to 38 months. Monthly seizure frequencies were compared during the treatment period and compared to a 3‐ and 12‐ month retrospective baseline period. No changes in depression scores were reported. Of the 100 patients, 18 withdrew from the study. All patients were included in the primary efficacy analysis.
Kuhn 2003 was a published, single‐centre, prospective cohort study conducted in Germany on 75 patients. All had focal onset epilepsy (temporal lobe). The patients were aged between 19 and 68 years and 45 patients were female. Inclusion criteria were defined as patients having major depression with epilepsy and scoring more than 15 points on the HAMD depression scale. Twenty‐seven patients received mirtazepine (mean daily dose 32.2 mg), 33 patients received citalopram (mean daily dose 24.2 mg) and 15 patients received reboxetine (mean daily dose 6.9 mg). Changes in depression scores and treatment responders were measured at four weeks and 20 to 30 weeks, and compared to baseline scores. Changes in seizure frequency were not measured. Forty‐two patients dropped out; eight dropped out between baseline and week four, 34 dropped out between week four and weeks 20 to 30. The last observation carried forward was used and all patients were included in the primary efficacy outcomes.
Li 2005 was a published, single‐centre, randomised controlled trial conducted in China on 67 patients. Forty‐two patients had generalised onset epilepsy. The patients were aged between 14 and 62 years and 35 patients were female. Inclusion criteria were defined as patients having epilepsy defined by the ILAE classification and depressive illness with a HAMD score of more than 18. Thirty‐three patients were randomised to paroxetine, which was started at 10 mg/day and titrated up to 40 mg/day depending on response. Thirty‐four patients were randomised to doxepin started at 25 mg/day and titrated up according to response (mean 100 mg/day). The HAMD score was measured at eight weeks and compared to the baseline score. Seizure frequency was not assessed. Three patients in the doxepin treatment arm dropped out and were not included in the primary analysis.
Robertson 1985 was a published, single‐centre, randomised, placebo‐controlled trial conducted in the UK on 42 patients. The majority had focal onset epilepsy. The patients were aged between 18 and 60 years and 26 were female. Inclusion criteria were defined as patients with epilepsy and depression as defined by general criteria and a HAMD score of more than 15. Patients were randomised to amitriptyline, nomifensine or placebo. All treatment arms completed a six‐week phase and then both active treatment arms continued the study for a further six weeks. Depression scores were compared to baseline at 12 weeks of treatment. Three patients withdrew from the study. Twenty eight patients within active treatment arms were included in the primary outcome analysis at 12 weeks.
Specchio 2004 was a published, multi‐centre, prospective cohort study conducted in Italy on 45 patients. Forty‐four patients had focal onset epilepsy. The patients had a mean age of 42.7 years and 31 were female. Inclusion criteria were defined as patients with epilepsy on a stable regime of antiepileptic medication and with a Montgomery–Åsberg Depression Rating Scale (MADRS) score of 20 or more. All patients received citalopram for four months. Depression scores and seizure frequency were measured at two and four months on citalopram and compared to baseline measures. Six patients withdrew from the study and were omitted from the primary outcome analysis.
Thome‐Souza 2007 was a published, single‐centre, prospective cohort study conducted in Brazil on 36 patients with focal onset epilepsy. The patients were aged between six and 18 years and 19 were females. Inclusion criteria were defined as patients with epilepsy and a diagnosis of major depressive disorder as per Kiddie SADS score. Twenty‐eight patients received sertraline (50 mg to 200 mg/day) and eight patients received fluoxetine (20 mg to 80 mg/day) for a duration of 12 to 78 months. Change in depression scores was measured during the treatment phase and compared to a six‐month baseline period. Seizure exacerbation was also observed during the treatment phase. One patient dropped out of the study. All patients were included in the primary outcome analysis.
Zhu 2004 was a published, single‐centre, randomised trial of venlafaxine versus no treatment conducted in China on 64 patients. The patients were aged between 7 and 60 years. Inclusion criteria were defined as patients with epilepsy (presumed genetic or cause unknown) and depression. Thirty‐two patients were randomised to venlafaxine 25 mg to 75 mg/day and 32 patients received no treatment. Depression scores were measured using the HAMD at eight weeks of treatment and compared to baseline. Seizure frequency as a primary outcome was not reported. There were no drop‐outs and all patients were included in the primary outcome analysis.
Clinical heterogeneity
Five studies reported outcomes for adults patient only (Hovorka 2000; Kuhn 2003; Li 2005; Robertson 1985; Specchio 2004). Three studies reported outcomes for adults and children (Kanner 2000; Thome‐Souza 2007; Zhu 2004). Six studies included patients with focal onset epilepsy, whereas two studies included patients with generalised onset epilepsy (Li 2005; Zhu 2004). In all trials there was a larger or equal number of female patients. Six studies evaluated the efficacy of selective serotonin reuptake inhibitors (citalopram, sertraline, fluoxetine) versus no treatment, a tricyclic antidepressant (doxepin), a norepinephrine reuptake inhibitor (reboxetine) or a‐2 antagonists (mirtazapine) (Hovorka 2000; Kanner 2000; Kuhn 2003; Li 2005; Specchio 2004; Thome‐Souza 2007). The remaining two studies evaluated a serotonin‐norepinephrine reuptake inhibitor (venlafaxine) versus no treatment (Zhu 2004) and a tricyclic antidepressant (amitriptyline) versus dopamine and a norepinephrine reuptake inhibitor (nomifensine) (Robertson 1985). Five studies used the Hamilton Rating Scale for depression (Hovorka 2000; Kuhn 2003; Li 2005; Robertson 1985; Zhu 2004). One study used the Montgomery‐Åsberg Depression Rating Scale (MADRS) (Specchio 2004), one study used the Kiddie SADS depression score (Thome‐Souza 2007), and one study did not report the use of a specific depression rating scale (Kanner 2000).
Excluded studies
We excluded three studies. Two studies identified through www.clinicaltrials.gov were clinical trials comparing cognitive behavioural therapy versus sertraline and escitalopram versus no treatment, respectively (Gilliam 2005a; Kocsis 2007). Both trials were terminated early due to problems with recruitment. There were no available published data for either trial and we excluded both. The third study reported on a small case series of patients with epilepsy taking a combined tricyclic antidepressant and SSRI for depression and did not fulfil the inclusion criteria (Blumer 1997). See Characteristics of excluded studies for more details of the studies.
Risk of bias in included studies
We rated risk of bias across each domain for each study and then made an overall risk of bias judgement for each study. Overall, we rated four studies as high risk of bias (Hovorka 2000; Kanner 2000; Kuhn 2003; Thome‐Souza 2007), and we rated four as unclear risk of bias (Li 2005; Robertson 1985; Specchio 2004; Zhu 2004). See Figure 2 for a 'Risk of bias' summary (review authors' judgements about each risk of bias item for each included study).

'Risk of bias' summary: review authors' judgements about each risk of bias item for each included study.
Allocation
We rated two RCTs as low risk of bias for sequence generation as they used adequate methods (Li 2005; Robertson 1985). For allocation concealment we rated Li 2005 as unclear and we rated Robertson 1985 as low risk of bias. We rated the other RCT as unclear risk of bias for both sequence generation and allocation concealment (Zhu 2004). (See the 'Risk of bias' tables for more detailed information on methodology).
The prospective cohort studies were non‐randomised studies (Hovorka 2000; Kanner 2000; Kuhn 2003; Specchio 2004; Thome‐Souza 2007), and therefore we rated them as high risk of bias for these two domains.
Blinding
For the RCTs, we rated two as low risk of bias as study personnel, participants and outcome assessors were blinded (Li 2005; Robertson 1985). There were no clear methods of blinding reported for the third RCT, therefore we rated this study as unclear risk of bias (Zhu 2004).
For the prospective cohort studies, there was either no reported blinding of participants or outcome assessors (Hovorka 2000; Kanner 2000; Thome‐Souza 2007), therefore we rated these studies as high risk of bias. For two other non‐randomised studies blinding was reported but the methods were unclear and so we rated them as unclear risk of bias (Kuhn 2003; Specchio 2004).
Incomplete outcome data
For the RCTs, two reported missing data and did not perform an intention‐to‐treat analysis, but they did report both numerator and denominator data (Li 2005; Robertson 1985). We rated these as unclear risk of bias. The third RCT did not report any missing data and an intention‐to‐treat analysis was carried out, therefore we rated this study as low risk of bias (Zhu 2004). (See the 'Risk of bias' tables for more detailed information on methodology).
For the prospective cohort studies, we rated four as low risk of bias as they either had no missing data or carried out an intention‐to‐treat analysis (Hovorka 2000; Kanner 2000; Specchio 2004; Thome‐Souza 2007). The fifth study reported missing data with 18 patients lost to follow‐up and used the last observation carried forward approach in analysis; we therefore rated this study as unclear risk of bias (Kuhn 2003).
Selective reporting
We rated all studies except for one RCT (Li 2005) as low risk of bias as they reported outcomes that were clearly stated in their methods section. For the study by Li 2005, adverse event outcomes were not reported but were stated as an outcome in their methods section, therefore we rated this study as high risk of bias and this study was allocated the letter E on the ORBIT classification system as it is clear that this outcome was measured but not necessarily analysed.
Other potential sources of bias
One prospective cohort study used an insufficient measure of depression, by looking for "complete resolution of identified target psychiatric symptoms" as a measure of response to treatment; we therefore rated it as high risk of bias (Kanner 2000).
For the RCTs it was unclear whether there were any other potential sources of bias and so we rated all the RCTs as unclear risk of bias for this domain. We rated the other non‐randomised studies as low risk of bias (Hovorka 2000; Kuhn 2003; Specchio 2004; Thome‐Souza 2007).
Confounding variables
Risk of bias for confounding variables was only assessed in non‐randomised studies. All were rated as high risk of bias as no study considered the importance of confounding factors or adjusted for them appropriately within the analyses.
Effects of interventions
See: Summary of findings for the main comparison Paroxetine compared to doxepin for people with epilepsy and depression; Summary of findings 2 Amitriptyline compared to nomifensine for people with epilepsy and depression; Summary of findings 3 Venlafaxine compared to no treatment for people with epilepsy and depression; Summary of findings 4 Citalopram (before and after) for people with epilepsy and depression
Primary outcomes
(1) Depression scores: proportion with a greater than 50% improvement
All randomised controlled trials (RCTs) reported on the proportion with a 50% or more improvement in depression scores. The RCTs analysed different treatment comparisons and we were unable to combine the data in meta‐analysis.
Li 2005 compared paroxetine (20 mg to 40 mg/day) versus doxepin (mean dose 100 mg/day), including a total of 67 patients. The numbers of responders were 27/33 (82%) in the paroxetine group and 24/34 (71%) in the doxepin group. The risk ratio for the proportion with a 50% of more improvement in depression scores for paroxetine versus doxepin was 1.16 (95% confidence interval (CI) 0.88 to 1.52; P value > 0.05) (Analysis 1.1).
Robertson 1985 compared amitriptyline (75 mg/day) versus nomifensine (75 mg/day) versus placebo, including a total of 42 patients. The number of responders was reported at 12 weeks for active treatment groups. The number of responders for all treatment groups at six weeks is not reported. The numbers of responders at 12 weeks were 6/14 (43%) in the amitriptyline group and 11/14 (79%) in the nomifensine group. The risk ratio for the proportion with a 50% or more improvement in depression scores for amitriptyline versus nomifensine was 0.55 (95% CI 0.28 to 1.06; P value > 0.05)( Analysis 2.1).
Zhu 2004 compared venlafaxine (25 mg to 75 mg/day) versus no treatment and included 64 patients. The numbers of responders were 22/32 (69%) in the venlafaxine group and 6/32 (19%) in the no treatment group. The risk ratio for the proportion with a 50% or more improvement in depression scores for venlafaxine versus no treatment was 3.25 (95% CI 1.19 to 8.90; P value < 0.05) (Analysis 3.1).
Four of five prospective cohort studies reported on the proportion with a 50% or more improvement in depression scores. The fifth study did not use a validated depression scale (Kanner 2000).
Hovorka 2000 observed 28/43 (65%) patients with a 50% or more improvement in depression scores following eight weeks of treatment with citalopram (mean dose 23 mg/day).
Kuhn 2003 observed 17/27 patients (52%) in the mirtazepine group (mean dose 32 mg/day), 12/33 patients (36%) in the citalopram group (mean dose 24 mg/day) and 8/15 patients (53%) in the reboxetine group (mean dose 7 mg/day) with a 50% or more improvement in depression scores following 20 to 30 weeks of treatment. There was no statistical difference between the treatment groups.
Specchio 2004 observed 11/45 patients (24%) with a 50% or more improvement in depression scores following four months of treatment with citalopram (20 mg/day).
Thome‐Souza 2007 observed 35/36 patients (97%) with a 50% or more improvement in depression scores following one year of treatment with sertraline (mean dose 111 mg/day) or fluoxetine (mean 46 mg/day).
(2) Depression scores: mean difference
Two of three RCTS reported on the mean difference in depression scores using the Hamilton Rating Scale for Depression (HAMD) depression scale (Li 2005; Zhu 2004). The RCTs compared different treatment groups and we were unable to combine the data in any meta‐analysis.
Li 2005 compared paroxetine (20 mg to 40 mg/day) and doxepin (mean dose 100 mg/day), including a total of 67 patients. The effect estimate for the mean difference in depression scores for paroxetine versus doxepin was 0.65 (95% CI ‐2.15 to 3.45) (Analysis 1.2). There was no significant difference between the treatment groups.
Zhu 2004 compared venlafaxine (25 mg to 75 mg/day) versus no treatment and included 64 patients. The effect estimate for the mean difference in depression scores for venlafaxine versus no treatment was ‐7.59 (95% CI ‐11.52 to ‐3.66) (Analysis 3.2 ). There was a statistically significant difference between treatment groups.
Three of five prospective cohort studies reported on the mean difference in depression scores (Hovorka 2000; Kuhn 2003; Specchio 2004).
We were able to perform meta‐analysis, pooling data across two uncontrolled studies of citalopram including a total of 88 patients (Hovorka 2000; Specchio 2004). The average doses of citalopram were 22 mg/day and 20 mg/day respectively. The effect estimate for the standardised mean difference (SMD) in depression scores before and after was large, with an estimate of 1.17 (95% CI 0.96 to 1.38) (Analysis 4.1). The I2 statistic for heterogeneity was 53%, which may reflect differences between the two studies in the treatment period. One study reported outcomes following four months of treatment (Specchio 2004), versus two months of treatment in the other study (Hovorka 2000). Due to the level of statistical heterogeneity we performed a random‐effects analysis, which showed no change in significance (SMD 1.17; 95% CI 0.86 to 1.47).
The remaining study reported mean depression scores before and after treatment with mirtazepine, citalopram and reboxetine (Kuhn 2003). Baseline mean depression scores on the HAMD depression scale were 23, 22.5 and 23 respectively. Following 20 to 30 weeks of treatment the mean depression scores decreased to 13.5, 14 and 13.5 respectively. There were no significant differences according to treatment group.
(3) Seizure frequency: mean difference
None of the RCTs reported on mean difference in seizure frequency between baseline and end of treatment period. One RCT reported no increase in seizure frequency in both treatment groups (Li 2005).
Three of five prospective studies reported on changes in mean seizure frequency between baseline and treatment periods (Hovorka 2000; Kanner 2000; Specchio 2004).
We were able to perform meta‐analysis, pooling data across two uncontrolled studies of citalopram including a total of 88 patients (Hovorka 2000; Specchio 2004) (Analysis 4.2).The I2 statistic for heterogeneity in the effect estimate for the standardised mean difference in seizure frequency was 81%. We have therefore not reported the effect estimate. Possible reasons for a high I2 statistic value include differences in mean baseline seizure frequency, treatment duration and mean age of patients.
Kanner 2000 reported no statistically significant difference in seizure frequency at baseline versus treatment period for the 100 patients treated with sertraline (mean dose 108 mg/day).
(4) Seizure frequency: seizure recurrence or episode of status epilepticus
Only one study reported on one patient with a seizure recurrence (Specchio 2004). There were no reported episodes of status epilepticus reported in any of the eight studies.
Secondary outcomes
(1) Withdrawals: for any reason
Of the RCTs, two reported clearly the number of patients withdrawing for any reason (Li 2005; Robertson 1985).
Li 2005 reported 3/34 patients (9%) withdrawing from the doxepin treatment group versus 0/33 patients from the paroxetine group. The risk ratio for treatment withdrawal for paroxetine versus doxepin was 0.15 (95% CI 0.01 to 2.74; P value = 0.20) (Analysis 1.3). The specific reasons for withdrawal were not reported.
Robertson 1985 reported 1/14 patients (7%) withdrawing from the amitriptyline group, 1/14 from the nomifensine group and 1/14 from the placebo group. The patient withdrew from the nomifensine group because of increased seizures.
All five prospective studies reported on the number of patients withdrawing from the study.
Hovorka 2000 reported no treatment withdrawals from the study.
Kanner 2000 reported 18/100 patients (18%) treated with sertraline withdrawing from the study. All withdrew due to adverse events.
Kuhn 2003 reported 20/27 patients (74%) in the mirtazepine group, 16/33 patients (48%) in the citalopram group and 6/15 patients (40%) in the reboxetine group withdrawing from the study after 20 to 30 weeks of treatment. Adverse events accounted for 8/20 withdrawing from the mirtazepine group, 6/16 from the citalopram group and 3/6 from the reboxetine group. Only three patients (two mirtazepine and one citalopram) withdrew due to inefficacy. The remaining 22 patients were lost to follow‐up.
Specchio 2004 reported 6/45 patients (13%) treated with citalopram withdrawing from the study. Four withdrew because of adverse events, one due to poor compliance and one due to concurrent illness.
Thome‐Souza 2007 reported 1/36 patients treated with a selective serotonin reuptake inhibitor (SSRI) (sertraline) withdrawing because of exacerbation of seizures.
(2) Global State
None of the included studies reported on global state outcomes
(3) Mental State
None of the included studies reported on mental state outcomes
(4) General Functioning
None of the included studies reported on general functioning outcomes
(5) Cognitive Functioning
None of the included studies reported on cognitive functioning outcomes
(6) Quality of life
None of the included studies reported on quality of life outcomes
(7) Behaviour
None of the included studies reported on behaviour outcomes
(8) Adverse effects
Of the RCTs, one reported clearly the number of patients experiencing specific side effects in the treatment groups (Li 2005). Comparing paroxetine versus doxepin, the risk ratio for blurred vision was 0.34 (95% CI 0.09 to 1.32,), dizziness 0.21 (95% CI 0.03 to 1.37), dry mouth 0.26 (95% CI 0.06 to 1.20), sleep disorders 0.32 (95% CI 0.08 to 1.20) and urinary retention 0.34 (95% CI 0.01 to 21.99) (see Analysis 1.4). There were no significant differences between treatment groups.
All five prospective cohort studies reported on adverse events. The studies analysed different treatment comparisons and we were unable to combine the data in meta‐analysis.
Hovorka 2000 reported 3/43 patients (7%) experiencing nausea and 2/43 patients (5%) experiencing sexual dysfunction following eight weeks of treatment with citalopram.
Kanner 2000 reported 9/100 patients (9%) experiencing sedation, 7/100 patients (7%) experiencing hypomanic symptoms, 1/100 patients (1%) experiencing rheumatic pain and 1/100 patients (1%) experiencing myoclonus following an average 10‐month duration of treatment with sertraline.
Kuhn 2003 reported 13/75 patients experiencing side effects; weight gain (5/75), sedation (2/75) and sexual dysfunction (2/75) were the most common side effects.
Specchio 2004 reported 22/45 patients (56%) experiencing side effects; headache (15%), nausea (11%), dizziness (9%), drowsiness (7%) and fatigue (7%) were the most common side effects.
Thome‐Souza 2007 reported 1/36 patients (3%) experiencing facial rash and 1/36 patients (3%) experiencing gastrointestinal disorder.
Discussion
Summary of main results
Depression is the most common psychiatric comorbidity in epilepsy and is associated with poor quality of life (Fiest 2013; Taylor 2011). Depression is also a risk factor for refractory epilepsy (Anhoury 2000; Hitiris 2007), suggesting a bidirectional relationship between the two conditions. This may reflect shared pathophysiology, for example changes in serotonin neurotransmission, hyperactivity of the hypothalamic pituitary adrenal axis and imbalances between the excitatory and inhibitory neurotransmitters glutamate and GABA respectively (Kanner 2011). The association may also reflect iatrogenic interplay between antiepileptic drugs and antidepressants used to treat depression and epilepsy.
In this review we synthesised the available data from randomised trials and non‐randomised prospective studies of antidepressants used to treat depression in patients with epilepsy. We specifically sought to examine the effect of antidepressants on depressive symptoms and any potential risk of worsening seizures. We included non‐randomised studies because of the delayed effect of antidepressants on depressive symptoms and to better reflect effectiveness in populations seen in clinical practice. However, including non‐randomised studies within this review may have exposed to selection biases, including publication bias which could lead to unreliable and often inflated estimates of effect (Maguire 2008). Similarly confounding may occur where allocation to treatment is influenced by unmeasured factors which cannot be accounted for within a analysis, for example comorbidities or level of education.
The review identified no large, well‐conducted randomised controlled trials (RCTs) of antidepressant treatment used in epilepsy patients, and our review included three small RCTs. There were no published trials comparing antidepressant treatment versus psychotherapy in patients with epilepsy. The RCTs showed that venlafaxine significantly improved depressive symptoms when compared to no treatment, and that there was no difference between amitriptyline and nomifensine in improving depressive symptoms. The RCTs did not allow meaningful comparisons among the different classes of antidepressants. We therefore do not know which antidepressant or class of antidepressant is most effective. None of the RCTs reported seizure frequency changes during the trial. Only one RCT reported information on adverse events. We therefore have no randomised data to reliably inform on the likely impact of antidepressants on seizure control. We have limited information on adverse events encountered in clinical trials.
The five prospective cohort studies were of low quality, examining small numbers of patients treated predominantly with SSRIs. The combined meta‐analysis of two studies examining citalopram at 20 mg/day showed evidence of an effect on depressive symptoms. We could not combine the data on seizure frequency changes due to marked heterogeneity. However in the three studies reporting seizure frequency changes, none detected a significant increase in seizures. Only one study reported on one patient with a seizure recurrence on antidepressant treatment (citalopram). Whilst the data are of low quality in terms of impact on seizures, there is broad agreement across the prospective cohort studies of limited or no impact on seizures with selective serotonin reuptake inhibitors (SSRIs).
Patients withdrawing from antidepressants were more likely to do so because of adverse events rather than lack of efficacy. Reported adverse events for SSRIs included nausea, dizziness, sedation, gastrointestinal disturbance and sexual dysfunction. We have no reliable information on the comparative risk of adverse events with different classes of antidepressant treatment.
This review has ascertained that there is very limited evidence of an effect of antidepressants on depressive symptoms in patients with epilepsy. We do not have any reliable high‐quality evidence to inform on treatment effect or the best choice of antidepressant drug or class of drug for treating depression with the lowest risk of seizure exacerbation. We do not have any evidence on how antidepressants compare with psychotherapy in patients with epilepsy and depression.
Quality of the evidence
Overall, we rated four prospective cohort studies as high risk of bias (Hovorka 2000; Kanner 2000; Kuhn 2003; Thome‐Souza 2007), and four studies (all RCTs and one prospective cohort study) as unclear risk of bias (Li 2005; Robertson 1985; Specchio 2004; Zhu 2004). The 'Summary of findings' tables for each comparison examined shows that the quality of the evidence ranged from moderate quality to low quality. Where data were combined in meta‐analysis we rated the quality of evidence as low.
Potential biases in the review process
One potential bias in the review process concerns the extended risk of bias tool for non‐randomised studies. The tool is designed for the purpose of primarily assessing cohort‐like studies which have control groups. In our study we identified three studies which were uncontrolled and used this risk of bias tool to assess them for risk of bias and this may have brought bias into the review process. There is currently a lack of quality assessment tools which are deemed appropriate for these types of observational studies therefore we took the decision to use the same tool across all included studies.
With respect to the same tool, the parameters for assessing risk of bias across all domains except sequence generation and allocation concealment were review author defined and therefore specific to this review only. Although this was part of how the tool was designed to be used, this may have introduced bias into the review process.

Study flow diagram.

'Risk of bias' summary: review authors' judgements about each risk of bias item for each included study.
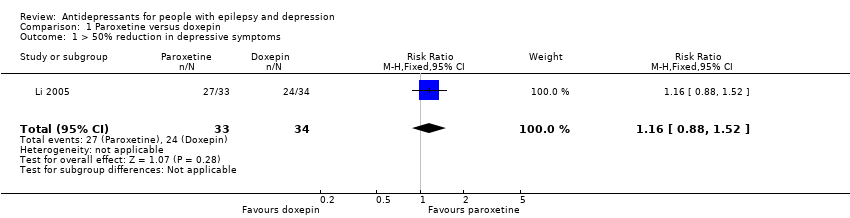
Comparison 1 Paroxetine versus doxepin, Outcome 1 > 50% reduction in depressive symptoms.
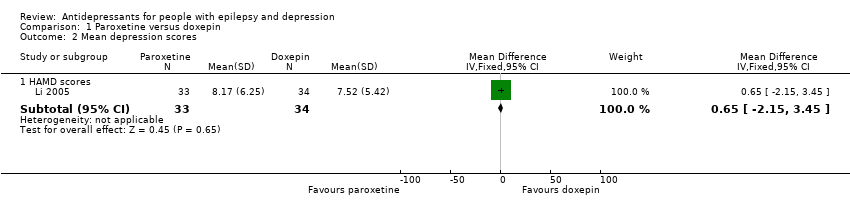
Comparison 1 Paroxetine versus doxepin, Outcome 2 Mean depression scores.
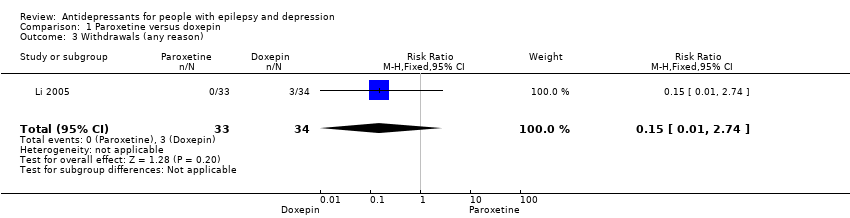
Comparison 1 Paroxetine versus doxepin, Outcome 3 Withdrawals (any reason).

Comparison 1 Paroxetine versus doxepin, Outcome 4 Adverse effects.
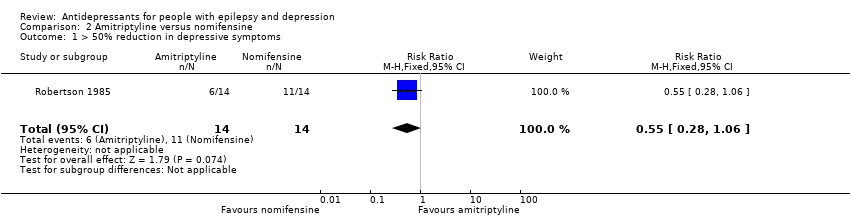
Comparison 2 Amitriptyline versus nomifensine, Outcome 1 > 50% reduction in depressive symptoms.
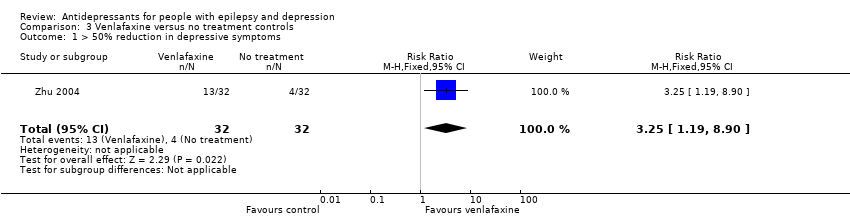
Comparison 3 Venlafaxine versus no treatment controls, Outcome 1 > 50% reduction in depressive symptoms.
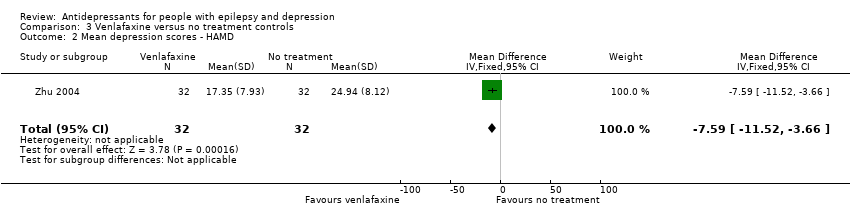
Comparison 3 Venlafaxine versus no treatment controls, Outcome 2 Mean depression scores ‐ HAMD.

Comparison 4 Citalopram (before and after), Outcome 1 Mean depression scores HAMD‐21.
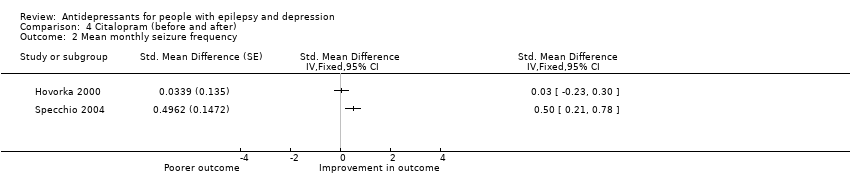
Comparison 4 Citalopram (before and after), Outcome 2 Mean monthly seizure frequency.
| Paroxetine compared to doxepin for people with epilepsy and depression | ||||||
| Patient or population: people with epilepsy and depression | ||||||
| Outcomes | Illustrative comparative risks* (95% CI) | Relative effect | No of participants | Quality of the evidence | Comments | |
| Assumed risk | Corresponding risk | |||||
| Doxepin | Paroxetine | |||||
| > 50% reduction in depressive symptoms | 706 per 1000 | 819 per 1000 | RR 1.16 | 67 | ⊕⊕⊕⊝1 | Only 1 study examined the influence of paroxetine versus doxepin on reduction in depression and it found no significant difference between the 2 drugs |
| Mean depression scores ‐ HAMD scores | The mean HAMD depression score in the intervention groups was | 67 | ⊕⊕⊕⊝1 | In the same study no differences were found between mean depression scores in patients taking paroxetine compared to those taking doxepin | ||
| Seizure frequency | ‐ | ‐ | ‐ | 0 (0 studies) | ‐ | No data contributed to this outcome |
| Withdrawals (specific reasons) | 88 per 1000 | 13 per 1000 | RR 0.15 | 67 | ⊕⊕⊕⊝1 | In this study 0 patients withdrew from the paroxetine group and 3 withdrew from the doxepin group. No significant difference was found between the 2 groups |
| Cognitive functioning | ‐ | ‐ | ‐ | 0 (0 studies) | ‐ | No data contributed to this outcome |
| Quality of life | ‐ | ‐ | ‐ | 0 (0 studies) | ‐ | No data contributed to this outcome |
| Adverse effects | ‐ | ‐ | ‐ | 0 (0 studies) | ‐ | No data contributed to this outcome |
| *The basis for the assumed risk (e.g. the median control group risk across studies) is provided in footnotes. The corresponding risk (and its 95% confidence interval) is based on the assumed risk in the comparison group and the relative effect of the intervention (and its 95% CI). | ||||||
| GRADE Working Group grades of evidence | ||||||
| 1Quality downgraded for imprecision due to only one study contributing to the outcomes and it was a small study. | ||||||
| Amitriptyline compared to nomifensine for people with epilepsy and depression | ||||||
| Patient or population: people with epilepsy and depression | ||||||
| Outcomes | Illustrative comparative risks* (95% CI) | Relative effect | No of participants | Quality of the evidence | Comments | |
| Assumed risk | Corresponding risk | |||||
| Nomifensine | Amitriptyline | |||||
| > 50% reduction in depressive symptoms | 786 per 1000 | 432 per 1000 | RR 0.55 | 28 | ⊕⊕⊕⊝1 | 1 study compared amitriptyline and nomifensine in reducing seizures and there was no significant difference found between the 2 groups |
| Seizure frequency | ‐ | ‐ | ‐ | 0 (0 studies) | ‐ | No data contributed to this outcome |
| Withdrawals | ‐ | ‐ | ‐ | 0 | ‐ | No data contributed to this outcome |
| Cognitive functioning | ‐ | ‐ | ‐ | 0 (0 studies) | ‐ | No data contributed to this outcome |
| Quality of life | ‐ | ‐ | ‐ | 0 (0 studies) | ‐ | No data contributed to this outcome |
| Adverse effects | ‐ | ‐ | ‐ | 0 (0 studies) | ‐ | No data contributed to this outcome |
| *The basis for the assumed risk (e.g. the median control group risk across studies) is provided in footnotes. The corresponding risk (and its 95% confidence interval) is based on the assumed risk in the comparison group and the relative effect of the intervention (and its 95% CI). | ||||||
| GRADE Working Group grades of evidence | ||||||
| 1Quality downgraded for imprecision due to only one study contributing to the outcomes and it was a small study. | ||||||
| Venlafaxine compared to no treatment for people with epilepsy and depression | ||||||
| Patient or population: people with epilepsy and depression | ||||||
| Outcomes | Illustrative comparative risks* (95% CI) | Relative effect | No of participants | Quality of the evidence | Comments | |
| Assumed risk | Corresponding risk | |||||
| No treatment | Venlafaxine | |||||
| > 50% reduction in depressive symptoms | 125 per 1000 | 406 per 1000 | RR 3.25 | 64 | ⊕⊕⊕⊝1 moderate | 1 study compared venlafaxine to a no treatment control group and found that venlafaxine was more than 3 times more effective in reducing seizures compared to controls |
| Mean depression scores ‐ HAMD | The mean HAMD depression score in the intervention groups was | 64 | ⊕⊕⊕⊝1 | The same study found mean depression scores to be significantly lower in the venlafaxine group compared to the control group | ||
| Seizure frequency | ‐ | ‐ | ‐ | 0 (0 studies) | ‐ | No data contributed to this outcome |
| Withdrawals | ‐ | ‐ | ‐ | 0 | ‐ | No data contributed to this outcome |
| Cognitive functioning | ‐ | ‐ | ‐ | 0 (0 studies) | ‐ | No data contributed to this outcome |
| Quality of life | ‐ | ‐ | ‐ | 0 (0 studies) | ‐ | No data contributed to this outcome |
| Adverse effects | ‐ | ‐ | ‐ | 0 (0 studies) | ‐ | No data contributed to this outcome |
| *The basis for the assumed risk (e.g. the median control group risk across studies) is provided in footnotes. The corresponding risk (and its 95% confidence interval) is based on the assumed risk in the comparison group and the relative effect of the intervention (and its 95% CI). | ||||||
| GRADE Working Group grades of evidence | ||||||
| 1Quality downgraded for imprecision due to only one study contributing to the outcomes and it was a small study. | ||||||
| Citalopram (before and after) for people with epilepsy and depression | ||||
| Patient or population: people with epilepsy and depression | ||||
| Outcomes | Illustrative comparative risks* (95% CI) | No of participants | Quality of the evidence | Comments |
| Corresponding risk | ||||
| Citalopram (before and after) | ||||
| Mean depression scores ‐ HAMD | The mean HAMD depression score in the intervention groups was | 88 | ⊕⊕⊝⊝ | 2 before and after studies investigated citalopram and found that depression scores were significantly lower after treatment |
| Mean monthly seizure frequency | 88 | ⊕⊝⊝⊝ | 2 studies found mixed evidence for the effect of citalopram on seizure frequency. Due to high heterogeneity the overall effect estimate is not presented | |
| *The basis for the assumed risk (e.g. the median control group risk across studies) is provided in footnotes. The corresponding risk (and its 95% confidence interval) is based on the assumed risk in the comparison group and the relative effect of the intervention (and its 95% CI). | ||||
| GRADE Working Group grades of evidence | ||||
| 1Across the studies there were concerns about bias with regards to the methods of blinding and methods to deal with confounding variables. | ||||
| 1 Low risk | 2 | 3 | 4 | 5 High risk | |
| Confounding | All important1 confounders considered2 and suitable method of adjustment3 employed. Outcome unlikely to be affected | Most important4 confounders considered and suitable method of adjustment employed. Outcome unlikely to be affected | Some confounders5 considered and full or partial adjustment employed6. Possible implication for outcome | Some confounders considered and no adjustment employed. Likely to affect outcome | No important confounders considered and no adjustment employed. Likely to affect outcome |
| Blinding | Assessors blinded to participant's drug regime and participants blinded to drug regime. Outcome unlikely to be affected | Assessors blinded to participant's drug regime. Outcome unlikely to be affected | Partial blinding7 involved in study. Possible implication for outcome | Partial or no blinding involved in study. Outcome likely to be affected | No blinding involved in study. Outcome likely to be affected |
| Incomplete outcome data | No missing data and/or appropriate analysis8 used to deal with missing data. Unlikely to affect outcome | Smaller amount (< 25%) of missing data with reasons given, balanced across groups. Unlikely to affect outcome | Larger amount of missing data (> 25%) with or without reasons given, balanced across groups. Possible implication for outcome | Larger amount (> 25%) of missing data, imbalance across groups. Outcome likely to be affected | No information provided regarding missing data. Likely to affect outcome |
| Selective outcome reporting | A priori outcomes measured, analysed and reported in main report. Protocol available. Unlikely to affect outcome | A priori outcomes measured, analysed and reported in main report9. Protocol not available. Unlikely to affect outcomes | Limited information regarding a priori outcomes and measures. Possible implication for outcome | Outcomes measured but not analysed or reported | Outcomes measured but not analysed or reported and clinical judgement infers the presence of an unreported measured outcome10 |
| Other bias | No bias identified | Bias identified. Unlikely to affect outcome | Bias identified. Possible implication for outcome | Bias identified. Likely to affect outcome | Bias identified. Extremely likely to affect outcome |
| 1Important confounders include:
2Reported demographic information and other confounders. 3Matching scores, multiple regression, analysis of co‐variance, stratification. 4At least four out of six of important confounders including: mean baseline depression score and mean baseline seizure frequency. 5At least two out of six of the important confounders. 6Full adjustment of confounding variables, e.g. see footnote 2, or partial adjustment, e.g. researchers select limited number of variables to adjust for. 7Assessors of outcome are only blinded to certain groups, e.g. blinded to intervention group but not controls. 8Intention‐to‐treat analysis. 9An a priori statement is made in the methods section of the main report regarding measurement and analysis of outcome. 10For example, failure to report full‐scale depression score when all other indices are reported. | |||||
| Outcome or subgroup title | No. of studies | No. of participants | Statistical method | Effect size |
| 1 > 50% reduction in depressive symptoms Show forest plot | 1 | 67 | Risk Ratio (M‐H, Fixed, 95% CI) | 1.16 [0.88, 1.52] |
| 2 Mean depression scores Show forest plot | 1 | Mean Difference (IV, Fixed, 95% CI) | Subtotals only | |
| 2.1 HAMD scores | 1 | 67 | Mean Difference (IV, Fixed, 95% CI) | 0.65 [‐2.15, 3.45] |
| 3 Withdrawals (any reason) Show forest plot | 1 | 67 | Risk Ratio (M‐H, Fixed, 95% CI) | 0.15 [0.01, 2.74] |
| 4 Adverse effects Show forest plot | 1 | Risk Ratio (M‐H, Fixed, 99% CI) | Subtotals only | |
| 4.1 Blurred vision | 1 | 67 | Risk Ratio (M‐H, Fixed, 99% CI) | 0.34 [0.09, 1.32] |
| 4.2 Dizziness | 1 | 67 | Risk Ratio (M‐H, Fixed, 99% CI) | 0.21 [0.03, 1.37] |
| 4.3 Dry mouth | 1 | 67 | Risk Ratio (M‐H, Fixed, 99% CI) | 0.26 [0.06, 1.20] |
| 4.4 Sleep disorders | 1 | 67 | Risk Ratio (M‐H, Fixed, 99% CI) | 0.32 [0.08, 1.20] |
| 4.5 Urinary retention | 1 | 67 | Risk Ratio (M‐H, Fixed, 99% CI) | 0.34 [0.01, 21.99] |
| Outcome or subgroup title | No. of studies | No. of participants | Statistical method | Effect size |
| 1 > 50% reduction in depressive symptoms Show forest plot | 1 | 28 | Risk Ratio (M‐H, Fixed, 95% CI) | 0.55 [0.28, 1.06] |
| Outcome or subgroup title | No. of studies | No. of participants | Statistical method | Effect size |
| 1 > 50% reduction in depressive symptoms Show forest plot | 1 | 64 | Risk Ratio (M‐H, Fixed, 95% CI) | 3.25 [1.19, 8.90] |
| 2 Mean depression scores ‐ HAMD Show forest plot | 1 | 64 | Mean Difference (IV, Fixed, 95% CI) | ‐7.59 [‐11.52, ‐3.66] |
| Outcome or subgroup title | No. of studies | No. of participants | Statistical method | Effect size |
| 1 Mean depression scores HAMD‐21 Show forest plot | 2 | 176 | Std. Mean Difference (Fixed, 95% CI) | 1.17 [0.96, 1.38] |
| 2 Mean monthly seizure frequency Show forest plot | 2 | Std. Mean Difference (Fixed, 95% CI) | Totals not selected | |