Antidepresivos para pacientes con epilepsia y depresión
Información
- DOI:
- https://doi.org/10.1002/14651858.CD010682.pub2Copiar DOI

- Base de datos:
-
- Cochrane Database of Systematic Reviews
- Versión publicada:
-
- 03 diciembre 2014see what's new
- Tipo:
-
- Intervention
- Etapa:
-
- Review
- Grupo Editorial Cochrane:
-
Grupo Cochrane de Epilepsia
- Copyright:
-
- Copyright © 2014 The Cochrane Collaboration. Published by John Wiley & Sons, Ltd.
Cifras del artículo
Altmetric:
Citado por:
Autores
Contributions of authors
MM, JP and JS have written the review protocol. MM holds responsibility for managing the review process. AM has provided supervision throughout the development of the protocol and provided comments on drafts.
Sources of support
Internal sources
-
No sources of support supplied
External sources
-
National Institute for Health Research, UK.
This review presents independent research commissioned by the National Institute for Health Research (NIHR). The views expressed in this publication are those of the author(s) and not necessarily those of the NHS, the NIHR or the Department of Health.
Declarations of interest
MM, JP, JS and AM have no declarations of interest.
Version history
| Published | Title | Stage | Authors | Version |
| 2021 Apr 16 | Antidepressants for people with epilepsy and depression | Review | Melissa J Maguire, Anthony G Marson, Sarah J Nevitt | |
| 2014 Dec 03 | Antidepressants for people with epilepsy and depression | Review | Melissa J Maguire, Jennifer Weston, Jasvinder Singh, Anthony G Marson | |
| 2013 Jul 29 | Antidepressants for people with epilepsy and depression | Protocol | Melissa J Maguire, Jennifer Pulman, Jasvinder Singh, Anthony G Marson | |
Keywords
MeSH
Medical Subject Headings (MeSH) Keywords
- Antidepressive Agents [adverse effects, *therapeutic use];
- Bias;
- Cognitive Behavioral Therapy;
- Depression [*drug therapy, etiology];
- Epilepsy [chemically induced, *drug therapy, psychology];
- Non-Randomized Controlled Trials as Topic;
- Prospective Studies;
- Quality of Life;
- Randomized Controlled Trials as Topic;
- Selective Serotonin Reuptake Inhibitors [adverse effects, therapeutic use];
Medical Subject Headings Check Words
Adolescent; Adult; Child; Female; Humans; Male; Middle Aged; Young Adult;
PICO

Study flow diagram.

'Risk of bias' summary: review authors' judgements about each risk of bias item for each included study.
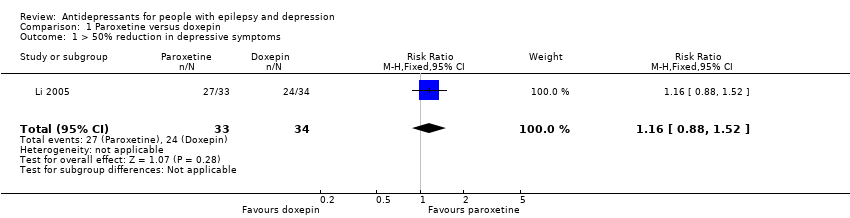
Comparison 1 Paroxetine versus doxepin, Outcome 1 > 50% reduction in depressive symptoms.
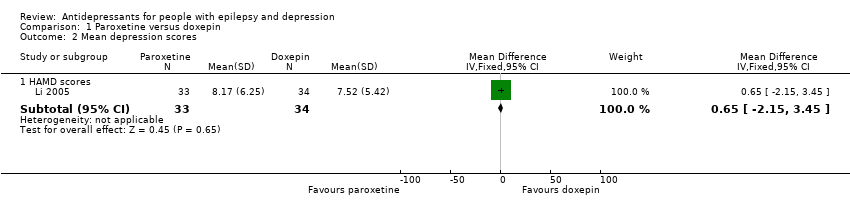
Comparison 1 Paroxetine versus doxepin, Outcome 2 Mean depression scores.
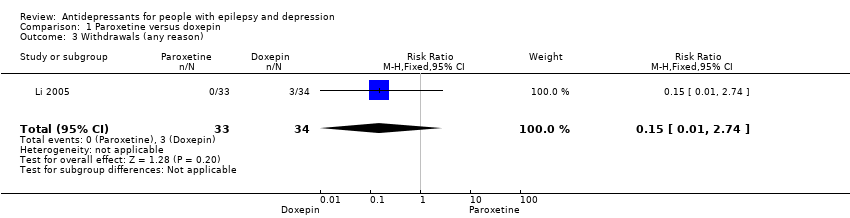
Comparison 1 Paroxetine versus doxepin, Outcome 3 Withdrawals (any reason).

Comparison 1 Paroxetine versus doxepin, Outcome 4 Adverse effects.
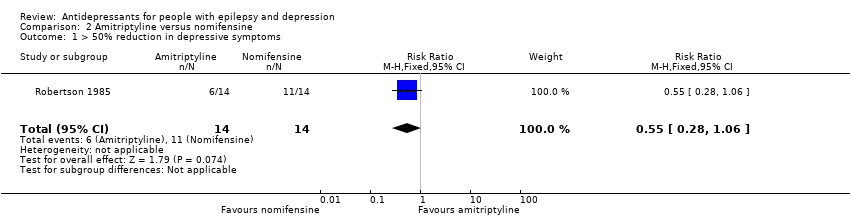
Comparison 2 Amitriptyline versus nomifensine, Outcome 1 > 50% reduction in depressive symptoms.
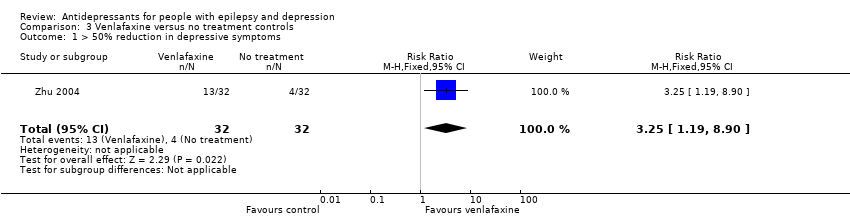
Comparison 3 Venlafaxine versus no treatment controls, Outcome 1 > 50% reduction in depressive symptoms.
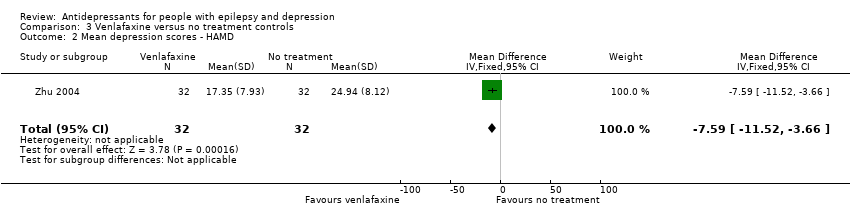
Comparison 3 Venlafaxine versus no treatment controls, Outcome 2 Mean depression scores ‐ HAMD.

Comparison 4 Citalopram (before and after), Outcome 1 Mean depression scores HAMD‐21.
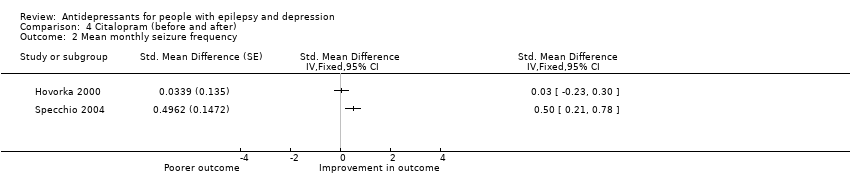
Comparison 4 Citalopram (before and after), Outcome 2 Mean monthly seizure frequency.
| Paroxetine compared to doxepin for people with epilepsy and depression | ||||||
| Patient or population: people with epilepsy and depression | ||||||
| Outcomes | Illustrative comparative risks* (95% CI) | Relative effect | No of participants | Quality of the evidence | Comments | |
| Assumed risk | Corresponding risk | |||||
| Doxepin | Paroxetine | |||||
| > 50% reduction in depressive symptoms | 706 per 1000 | 819 per 1000 | RR 1.16 | 67 | ⊕⊕⊕⊝1 | Only 1 study examined the influence of paroxetine versus doxepin on reduction in depression and it found no significant difference between the 2 drugs |
| Mean depression scores ‐ HAMD scores | The mean HAMD depression score in the intervention groups was | 67 | ⊕⊕⊕⊝1 | In the same study no differences were found between mean depression scores in patients taking paroxetine compared to those taking doxepin | ||
| Seizure frequency | ‐ | ‐ | ‐ | 0 (0 studies) | ‐ | No data contributed to this outcome |
| Withdrawals (specific reasons) | 88 per 1000 | 13 per 1000 | RR 0.15 | 67 | ⊕⊕⊕⊝1 | In this study 0 patients withdrew from the paroxetine group and 3 withdrew from the doxepin group. No significant difference was found between the 2 groups |
| Cognitive functioning | ‐ | ‐ | ‐ | 0 (0 studies) | ‐ | No data contributed to this outcome |
| Quality of life | ‐ | ‐ | ‐ | 0 (0 studies) | ‐ | No data contributed to this outcome |
| Adverse effects | ‐ | ‐ | ‐ | 0 (0 studies) | ‐ | No data contributed to this outcome |
| *The basis for the assumed risk (e.g. the median control group risk across studies) is provided in footnotes. The corresponding risk (and its 95% confidence interval) is based on the assumed risk in the comparison group and the relative effect of the intervention (and its 95% CI). | ||||||
| GRADE Working Group grades of evidence | ||||||
| 1Quality downgraded for imprecision due to only one study contributing to the outcomes and it was a small study. | ||||||
| Amitriptyline compared to nomifensine for people with epilepsy and depression | ||||||
| Patient or population: people with epilepsy and depression | ||||||
| Outcomes | Illustrative comparative risks* (95% CI) | Relative effect | No of participants | Quality of the evidence | Comments | |
| Assumed risk | Corresponding risk | |||||
| Nomifensine | Amitriptyline | |||||
| > 50% reduction in depressive symptoms | 786 per 1000 | 432 per 1000 | RR 0.55 | 28 | ⊕⊕⊕⊝1 | 1 study compared amitriptyline and nomifensine in reducing seizures and there was no significant difference found between the 2 groups |
| Seizure frequency | ‐ | ‐ | ‐ | 0 (0 studies) | ‐ | No data contributed to this outcome |
| Withdrawals | ‐ | ‐ | ‐ | 0 | ‐ | No data contributed to this outcome |
| Cognitive functioning | ‐ | ‐ | ‐ | 0 (0 studies) | ‐ | No data contributed to this outcome |
| Quality of life | ‐ | ‐ | ‐ | 0 (0 studies) | ‐ | No data contributed to this outcome |
| Adverse effects | ‐ | ‐ | ‐ | 0 (0 studies) | ‐ | No data contributed to this outcome |
| *The basis for the assumed risk (e.g. the median control group risk across studies) is provided in footnotes. The corresponding risk (and its 95% confidence interval) is based on the assumed risk in the comparison group and the relative effect of the intervention (and its 95% CI). | ||||||
| GRADE Working Group grades of evidence | ||||||
| 1Quality downgraded for imprecision due to only one study contributing to the outcomes and it was a small study. | ||||||
| Venlafaxine compared to no treatment for people with epilepsy and depression | ||||||
| Patient or population: people with epilepsy and depression | ||||||
| Outcomes | Illustrative comparative risks* (95% CI) | Relative effect | No of participants | Quality of the evidence | Comments | |
| Assumed risk | Corresponding risk | |||||
| No treatment | Venlafaxine | |||||
| > 50% reduction in depressive symptoms | 125 per 1000 | 406 per 1000 | RR 3.25 | 64 | ⊕⊕⊕⊝1 moderate | 1 study compared venlafaxine to a no treatment control group and found that venlafaxine was more than 3 times more effective in reducing seizures compared to controls |
| Mean depression scores ‐ HAMD | The mean HAMD depression score in the intervention groups was | 64 | ⊕⊕⊕⊝1 | The same study found mean depression scores to be significantly lower in the venlafaxine group compared to the control group | ||
| Seizure frequency | ‐ | ‐ | ‐ | 0 (0 studies) | ‐ | No data contributed to this outcome |
| Withdrawals | ‐ | ‐ | ‐ | 0 | ‐ | No data contributed to this outcome |
| Cognitive functioning | ‐ | ‐ | ‐ | 0 (0 studies) | ‐ | No data contributed to this outcome |
| Quality of life | ‐ | ‐ | ‐ | 0 (0 studies) | ‐ | No data contributed to this outcome |
| Adverse effects | ‐ | ‐ | ‐ | 0 (0 studies) | ‐ | No data contributed to this outcome |
| *The basis for the assumed risk (e.g. the median control group risk across studies) is provided in footnotes. The corresponding risk (and its 95% confidence interval) is based on the assumed risk in the comparison group and the relative effect of the intervention (and its 95% CI). | ||||||
| GRADE Working Group grades of evidence | ||||||
| 1Quality downgraded for imprecision due to only one study contributing to the outcomes and it was a small study. | ||||||
| Citalopram (before and after) for people with epilepsy and depression | ||||
| Patient or population: people with epilepsy and depression | ||||
| Outcomes | Illustrative comparative risks* (95% CI) | No of participants | Quality of the evidence | Comments |
| Corresponding risk | ||||
| Citalopram (before and after) | ||||
| Mean depression scores ‐ HAMD | The mean HAMD depression score in the intervention groups was | 88 | ⊕⊕⊝⊝ | 2 before and after studies investigated citalopram and found that depression scores were significantly lower after treatment |
| Mean monthly seizure frequency | 88 | ⊕⊝⊝⊝ | 2 studies found mixed evidence for the effect of citalopram on seizure frequency. Due to high heterogeneity the overall effect estimate is not presented | |
| *The basis for the assumed risk (e.g. the median control group risk across studies) is provided in footnotes. The corresponding risk (and its 95% confidence interval) is based on the assumed risk in the comparison group and the relative effect of the intervention (and its 95% CI). | ||||
| GRADE Working Group grades of evidence | ||||
| 1Across the studies there were concerns about bias with regards to the methods of blinding and methods to deal with confounding variables. | ||||
| 1 Low risk | 2 | 3 | 4 | 5 High risk | |
| Confounding | All important1 confounders considered2 and suitable method of adjustment3 employed. Outcome unlikely to be affected | Most important4 confounders considered and suitable method of adjustment employed. Outcome unlikely to be affected | Some confounders5 considered and full or partial adjustment employed6. Possible implication for outcome | Some confounders considered and no adjustment employed. Likely to affect outcome | No important confounders considered and no adjustment employed. Likely to affect outcome |
| Blinding | Assessors blinded to participant's drug regime and participants blinded to drug regime. Outcome unlikely to be affected | Assessors blinded to participant's drug regime. Outcome unlikely to be affected | Partial blinding7 involved in study. Possible implication for outcome | Partial or no blinding involved in study. Outcome likely to be affected | No blinding involved in study. Outcome likely to be affected |
| Incomplete outcome data | No missing data and/or appropriate analysis8 used to deal with missing data. Unlikely to affect outcome | Smaller amount (< 25%) of missing data with reasons given, balanced across groups. Unlikely to affect outcome | Larger amount of missing data (> 25%) with or without reasons given, balanced across groups. Possible implication for outcome | Larger amount (> 25%) of missing data, imbalance across groups. Outcome likely to be affected | No information provided regarding missing data. Likely to affect outcome |
| Selective outcome reporting | A priori outcomes measured, analysed and reported in main report. Protocol available. Unlikely to affect outcome | A priori outcomes measured, analysed and reported in main report9. Protocol not available. Unlikely to affect outcomes | Limited information regarding a priori outcomes and measures. Possible implication for outcome | Outcomes measured but not analysed or reported | Outcomes measured but not analysed or reported and clinical judgement infers the presence of an unreported measured outcome10 |
| Other bias | No bias identified | Bias identified. Unlikely to affect outcome | Bias identified. Possible implication for outcome | Bias identified. Likely to affect outcome | Bias identified. Extremely likely to affect outcome |
| 1Important confounders include:
2Reported demographic information and other confounders. 3Matching scores, multiple regression, analysis of co‐variance, stratification. 4At least four out of six of important confounders including: mean baseline depression score and mean baseline seizure frequency. 5At least two out of six of the important confounders. 6Full adjustment of confounding variables, e.g. see footnote 2, or partial adjustment, e.g. researchers select limited number of variables to adjust for. 7Assessors of outcome are only blinded to certain groups, e.g. blinded to intervention group but not controls. 8Intention‐to‐treat analysis. 9An a priori statement is made in the methods section of the main report regarding measurement and analysis of outcome. 10For example, failure to report full‐scale depression score when all other indices are reported. | |||||
| Outcome or subgroup title | No. of studies | No. of participants | Statistical method | Effect size |
| 1 > 50% reduction in depressive symptoms Show forest plot | 1 | 67 | Risk Ratio (M‐H, Fixed, 95% CI) | 1.16 [0.88, 1.52] |
| 2 Mean depression scores Show forest plot | 1 | Mean Difference (IV, Fixed, 95% CI) | Subtotals only | |
| 2.1 HAMD scores | 1 | 67 | Mean Difference (IV, Fixed, 95% CI) | 0.65 [‐2.15, 3.45] |
| 3 Withdrawals (any reason) Show forest plot | 1 | 67 | Risk Ratio (M‐H, Fixed, 95% CI) | 0.15 [0.01, 2.74] |
| 4 Adverse effects Show forest plot | 1 | Risk Ratio (M‐H, Fixed, 99% CI) | Subtotals only | |
| 4.1 Blurred vision | 1 | 67 | Risk Ratio (M‐H, Fixed, 99% CI) | 0.34 [0.09, 1.32] |
| 4.2 Dizziness | 1 | 67 | Risk Ratio (M‐H, Fixed, 99% CI) | 0.21 [0.03, 1.37] |
| 4.3 Dry mouth | 1 | 67 | Risk Ratio (M‐H, Fixed, 99% CI) | 0.26 [0.06, 1.20] |
| 4.4 Sleep disorders | 1 | 67 | Risk Ratio (M‐H, Fixed, 99% CI) | 0.32 [0.08, 1.20] |
| 4.5 Urinary retention | 1 | 67 | Risk Ratio (M‐H, Fixed, 99% CI) | 0.34 [0.01, 21.99] |
| Outcome or subgroup title | No. of studies | No. of participants | Statistical method | Effect size |
| 1 > 50% reduction in depressive symptoms Show forest plot | 1 | 28 | Risk Ratio (M‐H, Fixed, 95% CI) | 0.55 [0.28, 1.06] |
| Outcome or subgroup title | No. of studies | No. of participants | Statistical method | Effect size |
| 1 > 50% reduction in depressive symptoms Show forest plot | 1 | 64 | Risk Ratio (M‐H, Fixed, 95% CI) | 3.25 [1.19, 8.90] |
| 2 Mean depression scores ‐ HAMD Show forest plot | 1 | 64 | Mean Difference (IV, Fixed, 95% CI) | ‐7.59 [‐11.52, ‐3.66] |
| Outcome or subgroup title | No. of studies | No. of participants | Statistical method | Effect size |
| 1 Mean depression scores HAMD‐21 Show forest plot | 2 | 176 | Std. Mean Difference (Fixed, 95% CI) | 1.17 [0.96, 1.38] |
| 2 Mean monthly seizure frequency Show forest plot | 2 | Std. Mean Difference (Fixed, 95% CI) | Totals not selected | |