Contenido relacionado
Revisiones y protocolos relacionados
Mohan S Kamath, Abha Maheshwari, Siladitya Bhattacharya, Kar Yee Lor, Ahmed Gibreel | 2 noviembre 2017
Lidija Rakic, Elena Kostova, Ben J Cohlen, Astrid EP Cantineau | 14 julio 2021
Sarah F Lensen, Sarah Armstrong, Ahmed Gibreel, Carolina O Nastri, Nick Raine-Fenning, Wellington P Martins | 10 junio 2021
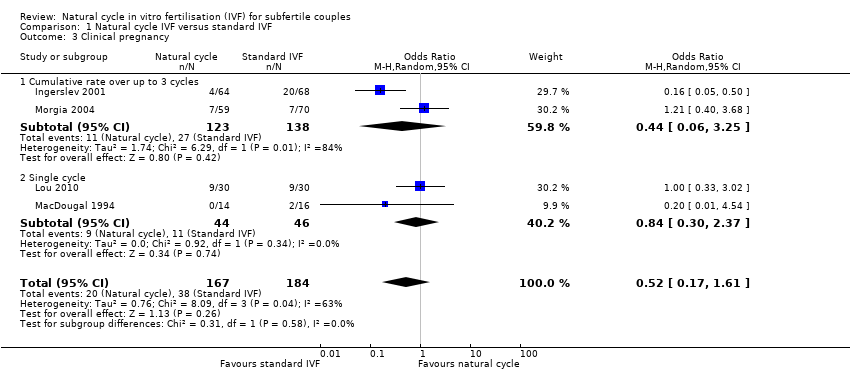
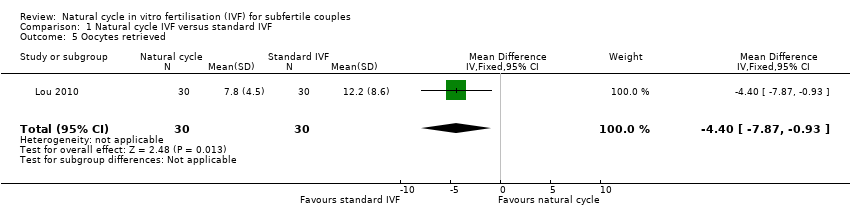
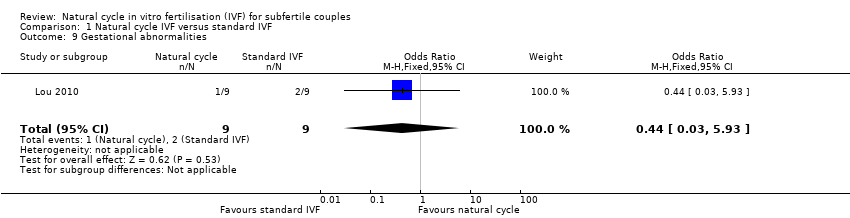
Zabeena Pandian, Alison R McTavish, Lorna Aucott, Mark PR Hamilton, Siladitya Bhattacharya | 20 enero 2010
Lauren Lacey, Sibte Hassan, Sebastian Franik, Mourad W Seif, M Ahsan Akhtar | 17 marzo 2021
Mohan S Kamath, Mariano Mascarenhas, Richard Kirubakaran, Siladitya Bhattacharya | 21 agosto 2020
Ektoras X Georgiou, Pedro Melo, Philip E Baker, Hassan N Sallam, Aydin Arici, Juan A Garcia‐Velasco, Ahmed M Abou‐Setta, Christian Becker, Ingrid E Granne | 20 noviembre 2019
Charalampos S Siristatidis, Eleni Sertedaki, Vasilios Karageorgiou, Dennis Vaidakis | 14 agosto 2020
Sesh Kamal Sunkara, Mohan S Kamath, Zabeena Pandian, Ahmed Gibreel, Siladitya Bhattacharya | 27 septiembre 2023
Marian G Showell, Rebecca Mackenzie‐Proctor, Vanessa Jordan, Ruth Hodgson, Cindy Farquhar | 20 diciembre 2018
Respuestas clínicas Cochrane
E. Chris Vincent | 5 diciembre 2016