恶性胸腔积液的治疗干预:一项网状meta分析
Abstract
研究背景
恶性胸腔积液(malignant pleural effusion, MPE)是癌症患者胸膜恶性浸润的常见问题。它通常与严重的呼吸困难有关。有许多治疗方法可用于控制胸膜积液,包括使用胸膜固定媒介(通过胸管或胸腔镜)或留置胸膜导管。
研究目的
本综述的目的是探讨针对患有恶性胸腔积液的成人给予胸膜固定术的最佳治疗策略。并且,量化不同管理策略之间患者报告的结果和不良反应的差异。
检索策略
我们检索了Cochrane中心临床对照试验注册库(The Cochrane Central Register of Controlled Trials, CENTRAL)、MEDLINE(Ovid),Embase(Ovid),CINAHL(EBSCO),SCI‐EXPANDED,和SSCI(ISI Web of Science)(时间截止到2015年4月)。
标准/纳入排除标准
我们在综述中纳入了针对有症状的MPE成人胸膜内干预的随机对照试验。
数据收集与分析
两位综述作者独立提取了关于研究设计、研究特征、结果测量、潜在的影响因素和偏倚风险的资料。
主要结局是胸膜融合术的失败率。次要结局包括不良反应和并发症、患者报告的呼吸困难控制情况、生活质量、成本、死亡率、住院时间和患者可接受度。
我们采用随机效应的网状meta分析方法对主要结局资料和资料充足的次要结局进行分析。我们还对直接比较的资料进行了成对随机效应meta分析。如果不认为干预措施是共同随机的,或者没有足够的资料可用,我们通过叙述综合报告了结果。我们进行敏感性分析来探讨异质性,并仅评价那些通过床边胸管实施的胸膜融合术药物。
主要结果
在确定的1888项记录中,62项随机试验符合纳入标准,涉及了3428名患者。所有的研究都存在至少一个领域的高偏倚风险或不确定偏倚风险。
网状meta分析评价胸膜融合术失败率,提示撒滑石粉是一种高效的方法(16位中排名第二(95%贝叶斯可信区间(credible interval, Cr‐I)[1, 5])),并提供证据表明,与其他8种方法相比,它使胸膜固定术更少失败。其他常用药剂的估计等级为:滑石浆(第四;95% Cr‐l [‐2, 8]),美帕克林(第四;95% Cr‐I [1, 10]),碘(第五;95% Cr‐I [1, 12]),博莱霉素(第八;95% Cr‐I [5, 11])和多西环素(第十;95% Cr‐I [4, 15])。由于证据的广泛的可信区间和高的统计和临床异质性,这些估计是不精确的。
大多数次要结局,包括不良事件,在纳入的研究中报告不一致,用于描述这些结果的方法差异很大。因此,大多数的次要结局在本综述中被描述性地报告。我们获得了足够的资料来对最常见的不良事件(疼痛、发烧和死亡)进行网状meta分析。发热的网络是不精确的,展示了可观的的异质性,但它表示安慰剂引起的发烧是最少的(11位中排名第一(95% Cr‐I [1, 7]))而麦帕克林和短小棒状杆菌(C. parvum)似乎与最多的发烧相关(各排名第十(95% Cr‐I [6, 11])和第十一(95% Cr‐I [7, 11]))。对疼痛数据的网状meta分析没有发现干预措施之间的差异。死亡率的网络鉴定出的唯一潜在差异是,接受四环素治疗的患者的生存期似乎比接受米托蒽酮治疗的患者更长(OR=0.16,95%置信区间(Confidence Interval, CI) [0.03, 0.72])。在两项随机研究中对留置胸膜导管进行了检查,尽管胸膜固定术成功率较低,但与滑石粉浆胸膜固定术相比,两项研究均报告了呼吸困难的改善。
在纳入的一些研究中,偏倚的风险是巨大的,例如绝大多数研究是非盲的,用于生成序列和分配隐藏的方法往往不清楚。然而,总的来说,所有研究的偏倚风险都是中等的。由于在网状meta分析(Network Meta‐analysis, NMA)的背景下,GRADE的作用还没有很好地确立,所以我们还没有报告结局证据的质量等级。
作者结论
根据现有的证据,撒滑石粉法是MPE中比常用的四环素、博莱霉素等胸膜固定术更为有效的方法。然而,需要进一步的资料来确定它是否比某些其他常用的干预措施如滑石粉浆和多西环素更有效,特别是考虑到网络内的高度统计和临床异质性以及许多纳入研究的高偏倚风险。基于直接和间接比较床边使用的组织硬化剂的随机数据的证据强度,没有证据表明其他高效方法(滑石粉浆、麦帕克林、碘和C. parvum)之间有很大的差异。然而,在选择硬化剂时,还必须考虑这些制剂的本地可用性、整体经验及其不良事件(这些可能无法在随机试验中确定)。需要进一步的研究,根据患者的特点(例如根据他们的预后或是否存在肺阻塞)来描述不同治疗的作用,并更详细地探索以患者为中心的结局,如呼吸困难和生活质量。仔细考虑将偏倚的风险降到最低,并将结果测量标准化,这对未来的试验设计至关重要。
PICO
Plain language summary
对癌症引起的肺周围液体(胸膜液)的控制性干预措施
系统综述问题
我们回顾了因癌症导致肺周围积液的患者使用不同方法控制肺周围积液的有效性的证据。
研究背景
恶性胸腔积液(malignant pleural effusion, MPE)是一种肺内膜癌导致肺和胸腔(胸腔)之间的液体积聚的情况,常导致呼吸困难。治疗方案包括使用临时胸腔引流、胸膜腔的摄像检查(胸腔镜)或皮下穿刺的半永久性胸腔引流(留置胸膜导管)清除液体。在胸膜腔中注入化学药物也可以防止液体回流(胸膜固定术)。我们想找出哪种方法在预防体液积聚方面最有效,哪种方法在副作用和患者报告结局(如疼痛、发烧、呼吸困难和生活质量)方面效果最好。
研究特征
我们在数据库中检索针对成人有症状的MPE的不同干预措施的对比试验,包含所有语言,时间截止到2015年4月。由于我们只对严格进行的研究感兴趣,所以我们将检索范围限制在随机对照试验(受试者随机分配到正在测试的方法中)。我们使用一种称为“网状meta分析”的技术分析了大部分资料,这种技术允许在一次分析中比较许多不同的干预措施。本分析按干预措施的有效性对其进行了排序。
主要结局
我们纳入了62项研究,涉及3428名患者。
在网状meta分析中,使用胸腔镜清除积液并将滑石粉吹入胸腔(撒入滑石粉)似乎比许多其他常用方法在预防积液方面更有效。然而,我们不能肯定地说它比某些方法更好,如通过胸腔引流给予滑石粉或多西环素。
纳入的研究报告的副作用、生活质量和患者满意度并不一致,但在为患者选择最佳管理策略时,这些都是需要考虑的重要因素。有足够的资料对疼痛、发烧和死亡率进行网状meta分析。我们发现安慰剂引起的发热最少,而短小棒状杆菌(C. parvum)和麦帕克林可能引起的最多。我们发现在评价干预措施引起的疼痛方面没有差异。只有一项比较显示了可能的差异,表明接受四环素治疗的人可能比接受米托蒽酮治疗的人活得更久。由于我们只评价了随机对照试验,因此本综述可能没有发现治疗的一些危害。
证据质量
许多研究是低质量的,个别研究的研究特征相距甚远。这种高偏倚风险使我们很难得出明确的结论。
结论
现有的证据表明撒滑石粉可以阻止液体的积聚。然而,我们不能确定这一定是最好的方法,仍需要进一步的研究。在选择最合适的胸膜固定术方法时,考虑这些药物整体的使用经验及其安全性和副作用的知识也很重要。留置胸膜导管可能有助于改善病人的呼吸困难,但可能不太擅长阻止液体回流。
还需要进一步研究特定的患者群体,并探索以患者为中心的结局,如更详细的呼吸困难和生活质量情况。理想情况下,从患者的角度更全面地了解治疗的潜在危害也将是有益的。
Authors' conclusions
Background
Malignant pleural effusion (MPE) is a common clinical problem, with an estimated annual incidence of at least 150,000 in the USA alone (American Thoracic Society 2000). Fifteen percent of people diagnosed with cancer will develop pleural effusion during the course of their disease as a result of malignant infiltration of the pleura. It often confers a poor prognosis (Rodrîguez‐Panadero 1989). Breathlessness results from compression of the underlying lung and impaired diaphragmatic and chest wall movement and is often relieved by pleural fluid aspiration.
Description of the condition
MPE is a condition whereby excess fluid accumulates in the pleural cavity, caused by direct pleural tumour invasion, resulting in increased permeability of the pleural microvessels and involvement of local lymph nodes causing reduced fluid reabsorption (Rodrîguez‐Panadero 2008). The most common primary sites which metastasise to the pleura are lung cancer in men and breast cancer in women, but other primary sites include lymphoma, genitourinary and gastrointestinal malignancy (DiBonito 1992; Sears 1987). In addition, the pleura may be the primary site of the malignancy, as is the case in mesothelioma. In the majority of cases, the diagnosis of pleural malignancy is made by cytological analysis of the pleural fluid or pleural biopsy. Depending on the clinical situation, confirmation of malignancy elsewhere and an otherwise unexplained (usually exudative) effusion may also be attributed to malignancy. Survival of these patients varies widely (Bielsa 2008; Burrows 2000) and estimation of an individual’s prognosis may help with the selection of the most appropriate management strategy (Clive 2014).
Trapped lung can occur when full lung expansion is limited by either a visceral pleural peel or endobronchial obstruction and in this situation, even once the fluid is drained, visceral and parietal pleural apposition does not occur. This results in pleurodesis attempts being less effective and often limits the treatment options to either an indwelling pleural catheter or surgery.
Description of the intervention
A number of different approaches may be used to manage MPE and the chosen method is likely to depend on clinical factors, patient preferences and local availability of the various techniques. Instillation of a sclerosant into the pleural cavity through an intercostal chest drain after complete fluid drainage has been the mainstay of treatment for many years (known as ‘bedside’ or ‘slurry’ pleurodesis). This technique aims to fuse the pleural layers together by means of local inflammation induced by the pleurodesis agent, thereby preventing pleural fluid re‐accumulation. The optimal management strategy to maximise pleurodesis success in terms of the size of chest drain, patient positioning, use of analgesia and type of sclerosant is still the subject of debate (Roberts 2010). The role of intrapleural fibrinolytics to break down septations and loculations within the effusion prior to administration of the pleurodesis agent is also yet to be formally established (Davies 1999; Gilkeson 1999; Hsu 2006).
Thoracoscopy is an alternative method, which is used to drain the effusion and deliver a sclerosant into the pleural cavity. This can either be performed under conscious sedation (local anaesthetic thoracoscopy), or as a surgical procedure under general anaesthetic (Video Assisted Thoracoscopic Surgery (VATS)). In both techniques, the pleural fluid is drained and the pleural cavity is visualised using a fibre‐optic camera. Loculations can be broken down and biopsies may be taken to gain a histological diagnosis. A pleurodesis agent can then be delivered by way of insufflation (poudrage) prior to the insertion of a chest drain (Rahman 2010).
An alternative approach in the management of MPE is the use of indwelling pleural catheters (IPCs). These are chest tubes, which are tunnelled under the skin and allow long‐term, intermittent fluid drainage to be performed in the community, thereby minimising recurrent hospital attendances. They have an established role in the management of pleural effusions in patients with trapped lung, but are increasingly being used for the primary management of malignant effusions as an alternative to chemical pleurodesis (Davies 2012; Demmy 2012). In a proportion of patients with IPCs, spontaneous pleurodesis occurs, allowing the drain to be removed without recurrence of the effusion (Tremblay 2006).
In certain clinical scenarios, none of the above options may be suitable and simple pleural fluid aspiration or medical management of a patient's breathlessness (for example using opiates) may be deemed more appropriate. This may be the case for patients in the terminal phase of their illness where invasive techniques may be felt to confer unnecessary discomfort.
How the intervention might work
Pleurodesis aims to fibrose the pleural layers together in order to obliterate the pleural space and by so doing prevent fluid recurrence. For pleurodesis to be successful the visceral and parietal pleural surfaces must be opposed and hence if lung expansion is incomplete (for example if the effusion is very loculated or the patient has trapped lung), pleurodesis is more likely to fail. The sclerosant stimulates an inflammatory reaction within the pleural cavity, which results in fusion of the visceral and parietal pleura.
Indwelling pleural catheters allow intermittent pleural fluid drainage, which relieves the pressure on the diaphragm and chest wall and promotes lung re‐expansion. By so doing, breathlessness is improved and spontaneous pleurodesis occurs in up to 50% of patients (Putnam 2000).
Why it is important to do this review
Due to wider availability of pleural interventions, such as thoracoscopy and indwelling pleural catheters, the management options available to patients with MPE are expanding. This review will help to delineate the specific roles of the different techniques and identify factors which may improve pleurodesis rates for those undergoing a bedside pleurodesis. This review includes an update of a Cochrane systematic review first published in 2004, 'Pleurodesis for malignant pleural effusions' (Shaw 2004) and will subsequently help to inform national guidelines in this area.
Given the availability of many pair‐wise comparisons for the method of pleurodesis administration and type of pleurodesis agent, this is a multiple interventions review. Network meta‐analysis has been performed to synthesise all the available evidence and investigate a treatment hierarchy.
Objectives
To ascertain the optimal management strategy for adults with malignant pleural effusion in terms of pleurodesis success. Additionally, to quantify differences in patient‐reported outcomes and adverse effects between management strategies.
Methods
Criteria for considering studies for this review
Types of studies
We only included reports of randomised controlled trials (RCTs) in this review. This would have included randomised cross‐over trials and cluster randomised trials, although no studies of these types were identified. We included both single and multi‐centre studies. Studies, which were stated to be randomised but were found to be at high risk of bias for adequate sequence generation or allocation concealment, were excluded.
Types of participants
Inclusion
-
Adults over the age of 16.
-
Symptomatic pleural effusion resulting from an underlying malignant process (of any type and stage).
Exclusion
-
Studies recruiting both malignant and non‐malignant participants with no clear distinction between the two groups in the results section.
-
Studies evaluating the effect of a drug administered via any method other than the intra‐pleural route.
-
Studies including participants with effusions within a variety of body cavities (e.g. pleural, peritoneal, pericardial), where the effect of the treatments in the subgroup of patients with pleural effusions cannot be distinguished in the results section.
Types of interventions
We identified studies comparing the following.
-
Type of sclerosant.
-
Mode of administration of sclerosant (thoracoscopic pleurodesis and bedside pleurodesis).
-
Bedside or thoracoscopic pleurodesis and indwelling pleural catheter insertion.
-
Techniques used to optimise pleurodesis success rate, namely:
-
chest drain size;
-
type of analgesia given;
-
duration of drainage after instillation of sclerosant;
-
patient positioning after pleurodesis (for example, patient rotation);
-
use of intrapleural fibrinolytics.
-
We generated a network of interventions, including comparisons between the types of sclerosant, mode of administration and IPC use. We assumed that any participant meeting the inclusion criteria could be, in principle, randomised to any of the eligible interventions. This is referred to as the interventions being ‘jointly randomisable’. However, if an intervention was not felt to be jointly randomisable, for example the treatment was specific to a certain tumour type, we reported the results separately from the network (Salanti 2012).
Interventions of direct interest
We included RCTs that evaluated one or more of the following intrapleural interventions: talc poudrage, talc slurry, bleomycin, tetracycline, doxycycline, iodine, C.parvum, IPC, mitoxantrone, mustine, mepacrine, interferon, triethylenethiophosphoramide and adriamycin, compared with another intervention or placebo. If we identified other sclerosants that we were not aware of, we considered them as eligible and we included them in the network after assessing their comparability with the pre‐specified set of competing interventions. We reported the findings for these interventions in the results and the conclusions of the review.
Types of outcome measures
Primary outcomes
The efficacy of pleurodesis was our primary outcome measure.
Definitions of pleurodesis failure varied between studies and although current practice would define this by a lack of recurrence of symptoms or need for a repeat pleural intervention to manage the effusion, in some older studies, less clinically relevant definitions were used (for example, re‐accumulation of effusion on imaging). We still included these studies in the review, and documented the method used to define pleurodesis for all studies in the assessment of the risk of bias.
For the purposes of the primary outcome, we used the following hierarchy of preferences to judge pleurodesis failure (if a study reported more than one definition of pleurodesis failure, the highest of these according to this hierarchy was used):
-
need for a repeat pleural procedure to manage recurrence of the effusion, or ongoing drainage of pleural fluid from an indwelling pleural catheter (if applicable);
-
evidence of significant pleural fluid re‐accumulation on radiological imaging (for example, chest X‐ray or ultrasound);
-
pleurodesis failure in the opinion of the trial investigators.
Similarly, we selected the time point used to define pleurodesis efficacy was selected using the following hierarchy of preferences:
-
2 ‐ 4 months;
-
> 4 ‐ 7 months;
-
> 7 ‐ 11 months;
-
> 11 ‐ 12 months;
-
< 2 months;
-
> 12 months.
Participants who died before the time point at which pleurodesis efficacy was assessed, were classified according to their last known pleurodesis outcome prior to their death (i.e. their last observation carried forward). If these data were not provided, we used the available reported data.
Secondary outcomes
-
Adverse effects and complications due to interventions, specifically the presence or absence of pain and fever after the intervention.
-
Patient‐reported control of breathlessness, as measured by a valid and reliable scale (for example, visual analogue scale (VAS), numeric rating scale or dyspnoea/breathlessness specific multidimensional scale)*
-
The participants' quality of life and symptom control (including pain), as measured by a valid and reliable scale*
-
Relative costs of the comparative techniques as reported by the individual trials. For ease of comparison, data reported in other currencies were converted to USD.*
-
The overall mortality (we used the data for the reported outcomes closest to three months).
-
Median survival.
-
Duration of inpatient stay in days (both total length of stay and from time of intervention until discharge).*
-
Patient acceptability of the interventions as judged by a valid scale (for example, visual analogue scale or numeric rating scale).*
* if available
Search methods for identification of studies
Trials that compared at least two of the interventions (including placebo) were eligible. We included all possible comparisons formed by the interventions of interest.
Electronic searches
To identify studies for inclusion in this review, we searched the following databases:
-
The Cochrane Central Register of Controlled Trials (CENTRAL) (The Cochrane Library) Issue 3 of 12, 2015;
-
MEDLINE (Ovid) 1948 to 1/04/15;
-
EMBASE (Ovid) 1974 to 1/04/15;
-
CINAHL (EBSCO) 1980 to April 2015;
-
Web of Science Science Citation Index Expanded (SCI‐EXPANDED) and Social Sciences Citation Index (SSCI) searched to 2015.
The search strategies can be viewed in Appendix 1. There were no language restrictions. We included single and multi‐centre studies.
Searching other resources
We screened the reference lists from the included studies for additional publications. We also searched the reference lists from relevant chapters in key resources, such as the British Thoracic Society Pleural Disease Guidelines (Roberts 2010).
Data collection and analysis
Selection of studies
One author screened all titles and abstracts retrieved by the search for relevance (AOC). We identified potentially eligible studies and obtained the full papers. Two review authors (AOC and NAM) independently assessed each study for inclusion in the review and any disagreement was resolved through discussion or by a third author (NP).
Data extraction and management
Two of the review authors (AOC with NAM, NP or RB) extracted data from each included study. We resolved disagreements through discussion and referral to one of the other review authors. If an author was involved in one of the included studies, they did not perform the data extraction for that study. Data collected included the following.
-
Publication details including:
-
title, author(s), date, country and other citation details;
-
study aim and design;
-
primary and secondary outcomes;
-
number of participants randomised.
-
-
Details of the interventions and comparison group including type of intervention, duration, dose, mode of administration and number of doses.
-
Primary and secondary outcome measures (as detailed above) and data on adverse events and complications.
-
Assessment of the study’s risk of bias.
-
Data on potential effect modifiers including the following study and patient characteristics:
-
-
how pleurodesis was defined (radiology only or including clinical need as well as radiology);
-
whether patients with trapped lung were included or not;
-
the size of the chest tube through which bedside pleurodesis was administered (defined as small (< 20 French), large (≥ 20 French) or unknown);
-
the time point at which pleurodesis was defined;
-
the tumour types included in the study.
-
We had planned to look at specific areas of study quality, which were incorporated into the assessment of the risk of bias. We requested additional data from the study authors as required. One author (AOC) entered data suitable for pooling into the Cochrane Collaboration's statistical software, Review Manager (RevMan) (RevMan 2014) . Where we performed network meta‐analysis, we transferred data to the WinBUGS software (Lunn 2000).
Assessment of risk of bias in included studies
We limited inclusion to studies that were randomised as a minimum. Two of the review authors (AOC with NP, RB or NM) independently assessed risk of bias for each study, using the criteria outlined in the Cochrane Handbook for Systematic Reviews of Interventions (Higgins 2011a), and adapted from those used by the Cochrane Pregnancy and Childbirth Group, with any disagreements resolved by discussion. In our original protocol, we had planned to include sample size in our risk of bias assessment. However, in view of Cochrane guidance stating imprecision should not be considered a risk of bias, we did not perform this assessment (Higgins 2011a). We assessed the following for each study.
Random sequence generation (checking for possible selection bias)
We assessed the method used to generate the allocation sequence as: low risk of bias (any truly random process, e.g. random number table; computer random‐number generator); unclear risk of bias (method used to generate sequence not clearly stated). We excluded studies using a non‐random process i.e. at high risk of bias (e.g. odd or even date of birth; hospital or clinic record number).
Allocation concealment (checking for possible selection bias)
The method used to conceal allocation to interventions prior to assignment determines whether intervention allocation could have been foreseen in advance of, or during, recruitment, or changed after assignment. We assessed the methods as: low risk of bias (e.g. telephone or central randomisation; consecutively numbered sealed opaque envelopes); unclear risk of bias (method not clearly stated). We excluded studies at high risk of bias that did not conceal allocation (e.g. open list).
Blinding of participants and personnel (checking for possible performance bias)
We assessed the methods used to blind study participants and personnel from knowledge of which intervention a participant received. We assessed the methods as: low risk of bias (study stated there was blinding of participants and key study personnel and unlikely blinding could be broken, or no blinding or incomplete blinding but the outcome not likely to be influenced by lack of blinding); unclear risk of bias (insufficient information to permit judgement of low or high risk of bias); high risk of bias (no blinding or incomplete blinding, which is likely to influence the trial outcome or blinding attempted but likely it could have been broken and the outcome is likely to be influenced by lack of blinding).
Blinding of outcome assessment (checking for possible detection bias)
We assessed the methods used to blind outcome assessors from knowledge of which intervention a participant received. We assessed the methods as: low risk of bias (study stated that it was not blinded but the review authors judged that the outcome measurement is not likely to be influenced by lack of blinding or blinding of outcome assessment was ensured); unclear risk of bias (study provided an inadequate description to permit judgment of 'low risk' or 'high risk'); high risk of bias (no blinding of outcome assessment and outcome likely to be influenced by lack of blinding, or there was blinding of the outcome assessment but likely that the blinding could have been broken).
Incomplete outcome data (checking for possible attrition bias due to the amount, nature and handling of incomplete outcome data)
We assessed the methods used to deal with loss to follow up for each of the given studies. Due to the challenges of inevitable missing outcome data given the predictable attrition of patients due to death in the palliative care population, we took into account whether missing data had been justified, whether the rate was similar in the different treatment arms, whether the treatment being evaluated was felt to have an impact on the degree of missing outcome data and whether an intention to treat analysis had been attempted. We assessed the methods used to deal with incomplete data as: low risk (rate of missing data were balanced between the treatment arms, seemed reasonable and had been justified; data had been analysed according to the patients' randomised treatment allocation; a suitable imputation method may have been used to account for missing data); unclear risk of bias (insufficient information given to allocate trial to 'high' or 'low' risk group); high risk of bias (imbalanced missing outcome data between the treatment arms or missing outcome data felt to be related to the true outcome; reasons for loss to follow up poorly justified; no attempt at ITT analysis; inappropriate imputation used).
Selective Outcome Reporting
We assessed the studies for selective outcome reporting using the following criteria: low risk of bias (all outcomes pre‐defined and reported, for example in a published protocol, or all clinically relevant and reasonably expected outcomes were reported); uncertain risk of bias (unclear whether all pre‐defined and clinically relevant outcomes were reported); high risk of bias (one or more clinically relevant and reasonably expected outcome was not reported and data on these outcomes were likely to have been recorded).
Other sources of bias
This section was used to report other biases, which were detected but did not fit into the above categories (for example, industry bias, academic bias or other methodological flaws that may have caused bias). We assessed the methods used to deal with other sources of bias as: low risk (the trial appeared to be free from other potential biases); unclear risk of bias; high risk of bias (other source of bias was identified).
Measures of treatment effect
Relative treatment effects
For proportions (dichotomous outcomes), such as pleurodesis efficacy and mortality, we calculated the Odds Ratio (OR) with 95% confidence intervals (CIs). For continuous data (such as length of hospital stay and cost) we planned to use the mean difference (MD) with 95% CIs and also the number needed to treat (NNT) to benefit for efficacy outcome, and the number needed to harm (NNH) for adverse events.
We planned to treat ordinal outcome measures (for example, breathlessness scales and quality of life data) as continuous so long as the scale was long enough. If different scales were used by the included studies, we planned to use the standardised mean difference in meta‐analyses.
We presented results from both pair‐wise standard meta‐analysis and network meta‐analysis (NMA) as summary relative effect sizes (OR, MD or SMD with 95% CIs) for each possible pair of treatments (Deeks 2011).
Relative treatment ranking
Based on the results of the network meta‐analysis, we estimated the rank of each competing intervention's effectiveness. We presented estimated ranks (medians) with 95% credible intervals (Cr‐Is) (representing uncertainty about the true rank) produced from the Bayesian analyses (Higgins 2011b).
Unit of analysis issues
If repeated observations on the same participants occurred during the trial (for example, pleurodesis success rate at different time points), we analysed these separately. Only one measure per participant was used for the primary endpoint (according to the hierarchy of preferences detailed above Primary outcomes).
For the purpose of meta‐analysis, if a study had multiple doses for a certain substance, we combined and compared all relevant experimental intervention groups with the combination of all relevant control groups. We reported any evidence for effects of the different doses descriptively.
For cross‐over trials, we planned to analyse data using pair‐wise meta‐analysis, taking into account the cross‐over design. If meta‐analysis had been performed containing cluster randomised trials and the presented results had not accounted for clustering, then we planned to make an appropriate adjustment, as described in the Cochrane Handbook (Higgins 2011b).
We treated multi‐arm studies as multiple independent two‐arm studies in the standard pair‐wise meta‐analysis. In the network meta‐analysis, we accounted for the correlation between the effect sizes from multi‐arm studies.
Dealing with missing data
We attempted to contact the study authors of included studies to clarify any missing data. We would have imputed the missing standard deviations based on the average standard deviations from the other included studies if standard deviations for mean scores had not been reported and it had not been possible to obtain the information from the study authors. We only included data for those participants whose results were known if an intention‐to‐treat analysis was not reported by the study. However, we assessed the potential impact of these missing data in the 'Risk of bias' table.
Assessment of heterogeneity
Assessment of clinical and methodological heterogeneity within treatment comparisons
We extracted data from study reports regarding clinical heterogeneity such as details on the intervention and control treatments, participant characteristics and the outcomes evaluated.
We assessed the presence of clinical heterogeneity within each pair‐wise comparison by comparing the study population characteristics across all eligible trials. We only performed meta‐analysis when considered reasonable based on the degree of heterogeneity.
Assessment of transitivity across treatment comparisons
We assessed the assumption of transitivity by comparing the distribution of the potential effect modifiers across the different pair‐wise comparisons.
Assessment of reporting biases
We performed searches in multiple databases to ensure all potentially eligible studies were identified (Electronic searches). The review authors were alert to duplicated publication of results when analysing the studies to ensure each participant was only included once in the analysis.
If unpublished studies were identified, we tried to obtain sufficient information in order for them to be included in the analysis. The same applied for data published in abstract format.
In studies published in a language other than English, we made every effort to obtain a translation of at least the abstract. If sufficient information was available, we included the study in the analysis.
Data synthesis
Methods for direct treatment comparisons
Since we expected some clinical heterogeneity between studies (for example due to different definitions of pleurodesis success, different time points and doses used), we believed that the assumption of a single fixed intervention effect across included studies was unlikely to be valid. Our primary analyses therefore employed random‐effects models. Since pooled effect estimates from random‐effects models give relatively more weight to smaller studies, which is often considered undesirable, we performed sensitivity analyses using fixed‐effect meta‐analysis models. We performed standard pair‐wise meta‐analysis using a random‐effects model in Cochrane's statistical software, RevMan 2014 for every treatment comparison with two or more studies.
For binary outcome data, we meta‐analysed odds ratios (ORs). For continuous data we planned to use the mean difference (MD) or standardised mean difference (SMD) and perform a check to identify if continuous outcome data were skewed. If this was the case, we planned to analyse the data on a log scale.
If we assessed studies as unsuitable for meta‐analysis, or insufficient studies were identified for meta‐analysis to be performed, we planned to present data by means of a narrative synthesis.
If sufficient data were available, we used similar analysis methods to analyse the adverse effects data. Alternatively we summarised this qualitatively.
Methods for indirect and mixed comparisons
Wherever possible, we performed a multiple‐intervention, network meta‐analysis of primary and (separately) of each secondary outcome measure. We used a Bayesian random‐effects model, fitted using the WinBUGS software (Lunn 2000). We assumed a binomial likelihood and an uninformative normal prior distribution, with mean 0 and standard deviation of 100 for all baseline event rates and intervention effects on the logit scale. When network meta‐analyses were performed, we used the Stata software to generate a network plot (using the networkplot command) and inconsistency plot (using the ifplot command) (Chaimani 2013).
Subgroup analysis and investigation of heterogeneity
Assessment of statistical heterogeneity
In pair‐wise meta‐analyses we estimated the between‐study standard deviation (Tau2) separately for each intervention comparison. For the direct treatment comparisons, we quantified the heterogeneity across studies using the I2 statistic, which we interpreted taking into account the magnitude and direction of effect as well as the confidence interval (Higgins 2003).
The assessment of statistical heterogeneity in the network meta‐analysis was based on the magnitude of and credible intervals for the between‐studies standard deviation (Tau) estimated from the NMA models. In network meta‐analysis we assumed a common Tau across all comparisons. We assumed a vague uniform(0,2) prior distribution for Tau.
As described below, reasons for heterogeneity were investigated using subgroup or sensitivity analyses.
Assessment of statistical inconsistency
Inconsistency in the network refers to differences between the direct and indirect effect estimates for the same comparison (Donegan 2013). We used both a loop‐specific approach and a global approach to evaluate these effects.
To evaluate the presence of inconsistency locally we used the loop‐specific approach. This assesses the consistency assumption in each closed loop of the network separately. We identified all the triangular loops (comprising three direct treatment comparisons, all compared with each other) and all the quadratic loops (involving four comparisons) in the network. We compared the differences between the direct and indirect estimates for these loops to generate inconsistency factors, with 95% CIs, calculated and displayed graphically using the 'ifplot' command in Stata (Chaimani 2013). We assumed the estimated between‐study standard deviation (Tau) from the Bayesian analysis of the full network for each loop. We used the magnitude of the inconsistency factors to infer the presence and degree of inconsistency in each loop.
In addition to this, we used a global approach, involving formally comparing the fit of the network meta‐analysis model (which assumes consistency) with that of an ‘inconsistency’ model (in which all consistency constraints are removed). The inconsistency model used is equivalent to fitting a random‐effects meta‐analysis model for all pair‐wise comparisons, with a shared between‐studies variance parameter but no assumptions about direct and indirect evidence forming coherent ‘loops’. We calculated the Deviance Information Criterion (DIC) for each model. If the DIC for the inconsistency model was more than five units higher than that of the consistency model, this was viewed as evidence of inconsistency (Dias 2013).
Assessment of statistical imprecision
We evaluated precision of results, and subsequent rankings, based on their 95% CIs (for pair‐wise analysis) or Cr‐Is (for Bayesian network meta‐analysis).
Sensitivity analysis
Sensitivity analysis and investigation of heterogeneity and inconsistency
We conducted subgroup or sensitivity network meta‐analyses by re‐running the model on restricted numbers of studies according to the following potential effect modifiers, which we felt could be sources of inconsistency and/or heterogeneity:
-
analysis only including studies which used a clinico‐radiological definition of pleurodesis failure;
-
analysis only including studies which analysed pleurodesis efficacy at one month after the intervention;
-
analysis only including studies which analysed pleurodesis efficacy at three months after the intervention;
-
analysis only including studies which analysed pleurodesis efficacy at more than six months after the intervention;
-
analysis only including studies which excluded patients with trapped lung;
-
analysis only including studies which administered bedside pleurodesis through a large‐bore chest tube (> 20 Fr)
-
analysis only including studies at a lower risk of bias (two or fewer domains at high risk of bias).
In the protocol, we had planned to investigate different tumour types, age of participants and baseline performance status, although there were insufficient data on this in the included studies to perform these subgroup analyses.
Sensitivity analysis
We performed a post‐hoc sensitivity network meta‐analysis evaluating only pleurodesis agents delivered via a chest tube (as opposed to being given at thoracoscopy). We removed the trials evaluating talc poudrage and IPC use from the main network and repeated the analysis.
Results
Description of studies
Results of the search
We performed the literature search in April 2015 (see Figure 1).
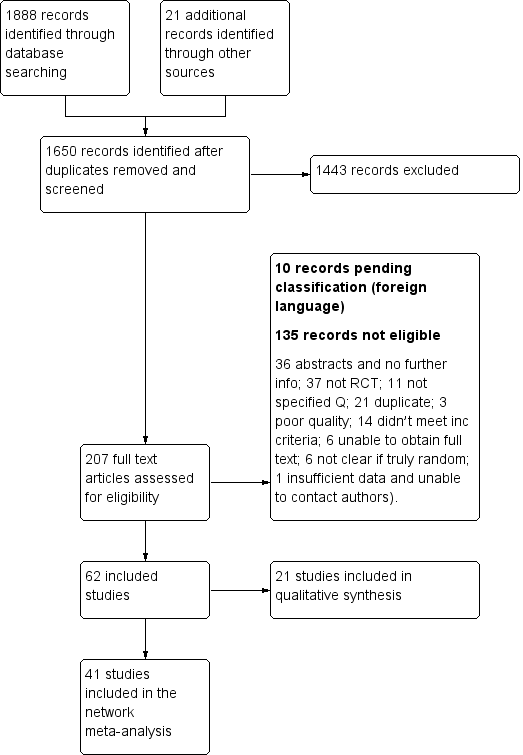
Study flow diagram
We identified 1888 records from database searches and 21 records from other sources before exclusion of duplicates. We screened 1650 abstracts, of which 207 full text articles were retrieved and assessed for eligibility by two independent researchers (AOC, NAM). Of these, 62 met the eligibility criteria (Characteristics of included studies) and 10 are pending classification as they are awaiting translation (Characteristics of studies awaiting classification). Six on‐going studies were also identified (Characteristics of ongoing studies).
Across the 62 included studies, a total of 3428 participants were randomised between 1977 and 2015. There was one foreign language study which was translated from the German (Schmidt 1997).
Included studies
The majority of studies (39/62) explored the efficacy of a variety of pleurodesis agents. Talc was evaluated in 23 trials, making it the most studied agent. The other most commonly examined agents were bleomycin and tetracycline. Two studies compared indwelling pleural catheters with talc slurry (Davies 2012; Demmy 2012).
Four studies evaluated the mode of administration of the pleurodesis agent (three studies comparing talc poudrage with talc slurry (Dresler 2005; Terra 2009; Yim 1996) and one comparing instillation of tetracycline thoracoscopically or through an intercostal cannula (Evans 1993)). A number of studies evaluated alternative methods to improve pleurodesis (one study examined catheter size (Clementsen 1998); three evaluated the duration of drainage after pleurodesis (Goodman 2006; Villanueva 1994; Yildirim 2005); one evaluated the duration of drainage prior to instillation of the sclerosant (Ozkul 2014); one assessed whether patient rotation improved pleurodesis rate (Mager 2002) and one evaluated the effect of talc particle size (Maskell 2004)). We identified one RCT which examined the role of intrapleural fibrinolytics (Okur 2011). One RCT evaluated administration of three different doses of silver nitrate through a chest tube (Terra 2015).
Two studies compared talc pleurodesis with surgical methods to treat malignant effusion (one comparing either talc pleurodesis with pleurectomy (Rintoul 2014) and one comparing talc slurry with thoracoscopic mechanical pleurodesis (Crnjac 2004)).
Additionally, we identified seven studies of agents specifically for the treatment of effusions due to lung cancer (Du 2013; Ishida 2006; Kasahara 2006; Luh 1992; Masuno 1991; Yoshida 2007; Zhao 2009).
There were a number of methodological differences between the included studies. Forty five of 62 studies included all tumour types; two included all except mesothelioma, one included only mesothelioma; one included only adenocarcinoma; six only breast cancer, and in seven studies only lung cancer patients were included.
The methods to define pleurodesis failure varied between studies. Eighteen of 62 studies used radiological criteria only to define a pleurodesis failure, 44 of 62 studies also incorporated symptomatic recurrence or need for a repeat pleural intervention into their definition. The time point at which pleurodesis was defined varied widely between studies, from 1 to 12 months.
The pleurodesis techniques were not standardised. Studies used a variety of chest drain sizes and durations of pleural fluid drainage after the sclerosant was administered. Additionally, patients with trapped lung were excluded from 25 of 62 studies, but not from the others.
Excluded studies
We placed 11 studies in the excluded studies section, having initially identified them as eligible for inclusion but with reasons for exclusion identified later (Characteristics of excluded studies). One study had insufficient data for extraction (Tattersall 1982). Three studies included data for patients with ascites, which could not be separated from those with pleural effusions even after attempting to contact the study authors (Kwasniewska‐Rokicinska 1979; Lissoni 1995; Nio 1999). As per the published protocol, seven studies were found to be high risk of bias for sequence generation and therefore excluded (Caglayan 2008; Dryzer 1993; Elayouty 2012; Engel 1981; Gust 1990; Maiche 1993; Manes 2000). Causes of the inadequate sequence generation included allocating patients to groups using alternation (Caglayan 2008); or according to certain clinical criteria (Maiche 1993), patient hospital number (Dryzer 1993), date of consent (Engel 1981) or date of diagnosis (Manes 2000). We excluded one study as the data contained both randomised and non‐randomised data, which was not distinguishable (Gust 1990) and we could not obtain contact details for the study authors. Another stated patients were ‘divided’ between groups, not mentioning if this process was random (Elayouty 2012) and there was no response from the study authors when contacted to clarify this further.
Risk of bias in included studies
A summary assessment of the risk of bias is presented in the Characteristics of included studies, Figure 2 and Figure 3. No studies were at low risk of bias for all domains.
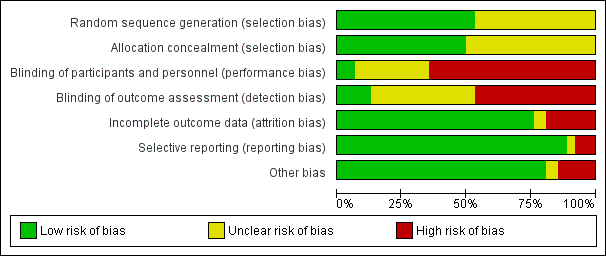
Risk of bias graph: review authors' judgements about each risk of bias item presented as percentages across all included studies.
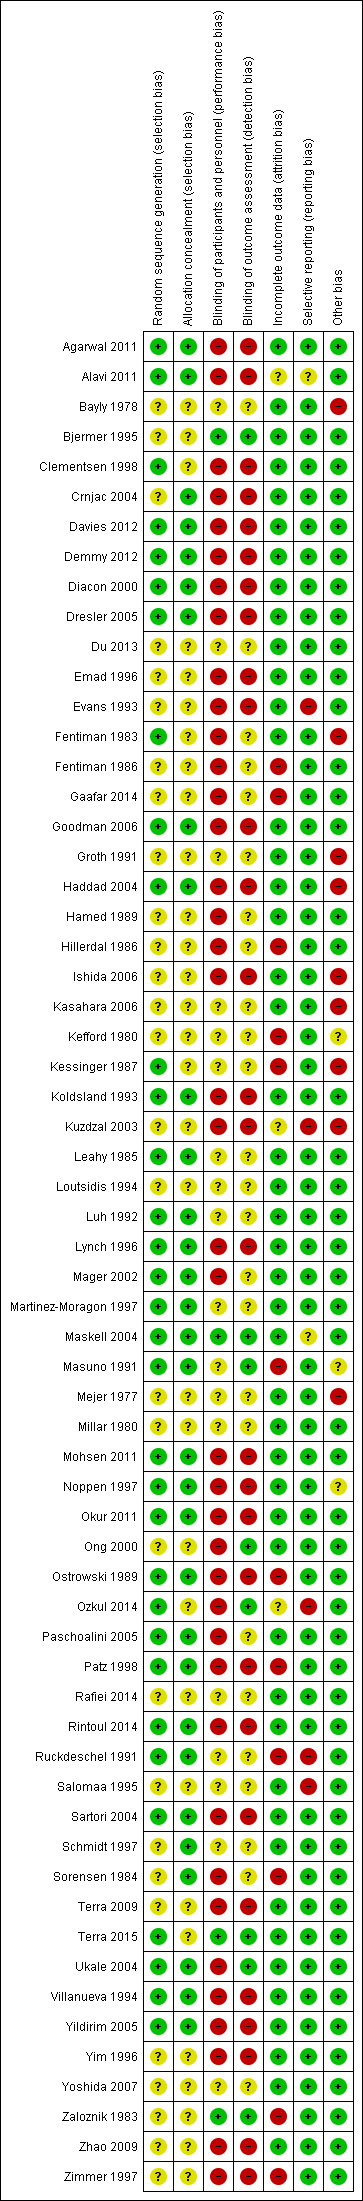
Risk of bias summary: review authors' judgements about each risk of bias item for each included study.
Allocation
Thirty three of 62 studies documented adequate sequence generation. The most commonly used methods were computer or telephone randomisation services, block randomisation, stratification, opaque sealed envelopes or a random number generator. Since studies with inadequate sequence generation were excluded as per the protocol, we assessed sequence generation as unclear in the remaining 29 studies. In all cases, the study was stated to have been randomised.
Regarding allocation concealment, we assessed 31 studies as low risk of bias for this domain. Since studies with inadequate allocation concealment were excluded as per the protocol, allocation concealment was ‘unclear’ for the remaining 31 studies.
Blinding
Blinding of participants and personnel (performance bias)
Due to the nature of many of the interventions evaluated in this review, blinding of the participants and clinicians was often not possible and therefore we assessed 40 of 62 studies as high risk of bias for this domain. Many of the pleurodesis agents have differing visual appearances and those studies randomising patients to different modes of administration of a pleurodesis agent, an indwelling pleural catheter or surgery, could not feasibly be blinded.
Four studies were assessed as low risk of performance bias (Bjermer 1995; Maskell 2004; Terra 2015; Zaloznik 1983).
Blinding of outcome assessment (detection bias)
The assessment of pleurodesis success could often not be blinded as it was reliant on participants (who were not blinded) reporting symptoms, in association with the radiological findings of effusion recurrence. Very few studies reported whether the radiological assessments were performed in a blinded fashion. Twenty nine of 62 studies were at high risk of detection bias, and a further 25 of 62 studies had an unclear risk of bias for this domain. Eight studies were low risk of detection bias (Bjermer 1995; Maskell 2004; Masuno 1991; Ong 2000; Ozkul 2014; Terra 2015; Ukale 2004; Zaloznik 1983).
Incomplete outcome data
The majority of studies were low risk of bias because although some inevitable attrition due to death was reported, the rates were comparable for the treatment arms and were deemed reasonable for the size of the population. We classified 12 studies as high risk of bias (eight due to very high attrition rates (Kefford 1980; Kessinger 1987; Masuno 1991; Ostrowski 1989; Patz 1998; Ruckdeschel 1991; Sorensen 1984; Zaloznik 1983; Kefford 1980); one due to very imbalanced loss to follow up (LTFU) between the treatment arms (Fentiman 1986); one the number randomised was not stated (Zimmer 1997); one the numbers provided did not add up (Hillerdal 1986); one excluded patients from the analysis who discontinued treatment due to an allergic reaction (Gaafar 2014)). Three were unclear risk of bias (Kuzdzal 2003: number of randomised patients not stated, only number analysed; Alavi 2011: unable to access tables, and numbers only given as percentages, rather than absolute values; Ozkul 2014: numbers of patients lost to follow up not stated).
Selective reporting
The majority of studies were assessed to be at low risk of bias for selective outcome reporting. We classified two studies as unclear, one as minimal raw data were presented in the text and the tables could not be accessed (Alavi 2011) and the other because pleurodesis success data were not collected in an RCT of talc and tetracycline pleurodesis (although the study was not designed to evaluate this) (Maskell 2004). Five studies were high risk (four provided minimal or no data regarding side effects or survival, or both (Evans 1993; Kuzdzal 2003; Ozkul 2014; Salomaa 1995) and one did not report data on 15 of the randomised patients (Ruckdeschel 1991).
Other potential sources of bias
We classified nine of 62 studies as high risk of bias in the ‘other’ domain and three of 62 studies as unclear. This was for a variety of reasons (see Characteristics of included studies). The remaining studies had a low risk of bias for this domain.
Effects of interventions
PRIMARY OUTCOME
Selection of trials for inclusion in the network
All the interventions from the included studies were evaluated and assessed for inclusion in the network. A number of interventions were not felt to be jointly randomisable and hence were not included in the network. This was the case for specific surgical techniques (Crnjac 2004; Rintoul 2014), different talc particle sizes (Maskell 2004), interventions aimed to improve the efficacy of pleurodesis (Clementsen 1998; Evans 1993; Goodman 2006; Mager 2002; Okur 2011; Ozkul 2014; Villanueva 1994; Yildirim 2005), tumour‐specific intra‐pleural therapy (Du 2013; Ishida 2006; Kasahara 2006; Luh 1992; Masuno 1991; Yoshida 2007; Zhao 2009) and different doses of silver nitrate (Terra 2015).
Two interventions (silver nitrate and combined tetracycline and bleomycin), which we initially felt to be eligible for inclusion in the network had to be removed for the evaluation of pleurodesis efficacy. These agents were only evaluated in one trial each and no participants who received these agents had a pleurodesis failure, which led to computational problems such that a treatment effect could not be estimated (Emad 1996; Paschoalini 2005). One study was not included in the analysis of pleurodesis efficacy as there were no pleurodesis failures in either study arm (Yim 1996). Such studies cannot statistically contribute to the estimate of relative intervention effects (Higgins 2011b).
The majority of studies included all cell types and 36 of 62 trials (58%) did not exclude patients with trapped lung. Pleurodesis was defined using symptom recurrence and radiology in 44 of 62 studies (71%) and it was usually defined within four months of the intervention. It was very difficult to assess whether the distribution of potential effect modifiers was comparable for all the direct treatment comparisons because there were few studies per direct comparison (see Appendix 2).
The final network can be seen in Figure 4. Any studies in the systematic review which were not included in the network were reported descriptively.
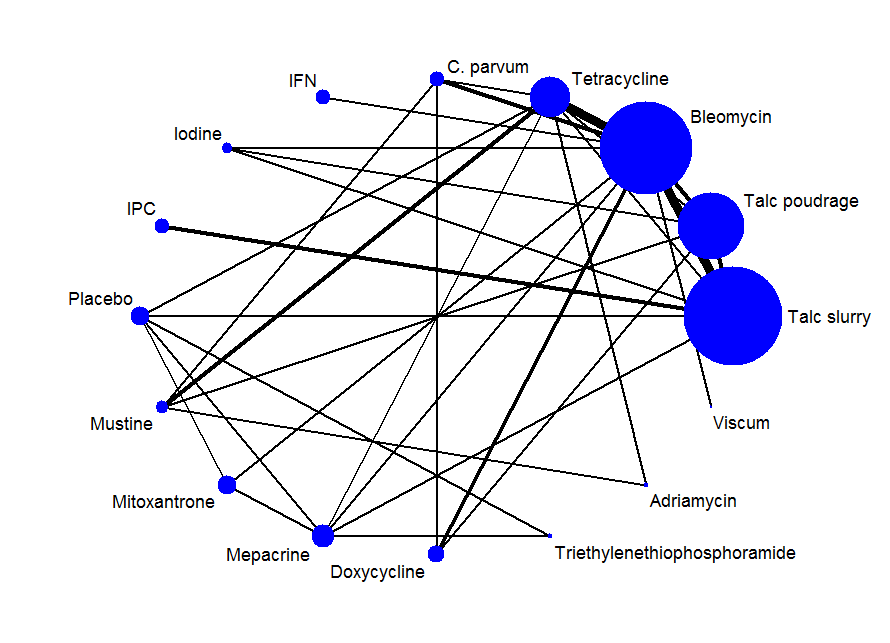
Network plot of the pleurodesis efficacy network. The nodes are weighted according to the number of participants randomised to the intervention. The edges (line thicknesses) are weighted according to the number of studies included in each comparison.
Primary outcomes for the methods included in the network meta‐analysis
Direct meta‐analysis
Results of the direct, pair‐wise random‐effects meta‐analysis of the main pleurodesis agents are presented in Table 1. Given the small number of studies making the same direct comparisons, meta‐analysis was only possible for eight direct comparisons.
| Treatment | Talc slurry | Talc poudrage | Bleomycin | Tetracycline | C. parvum | Placebo | Mustine | Mitoxantrone | Mepacrine |
| Talc poudrage | 0.76 (0.54, 1.09); n = 3; Tau2 = 0; I2 = 0% | NA | ‐ | ‐ | ‐ | ‐ | ‐ | ‐ | ‐ |
| Bleomycin | 1.22 (0.55, 2.70); n = 5*; Tau2 = 0.1; I2 = 12% | 9.70 (2.10, 44.78); n = 2; Tau2 = 0; I2= 0% | NA | ‐ | ‐ | ‐ | ‐ | ‐ | ‐ |
| Tetracycline | 0.78 (0.19, 3.13); n = 1* | 12.10 (1.32, 111.30); n = 1 | 2.00 (1.07, 3.75); n = 5*; Tau2 = 0; I2 = 0% | NA | ‐ | ‐ | ‐ | ‐ | ‐ |
| C. parvum | NA | NA | 0.55 (0.01, 57.48); n = 2; Tau2 = 11; I2 = 94% | 0.31 (0.05, 1.94); n = 1 | NA | ‐ | ‐ | ‐ | ‐ |
| Interferon | NA | NA | 3.25 (1.54, 6.89); n = 1 | NA | NA | ‐ | ‐ | ‐ | ‐ |
| Iodine | 0.47 (0.04, 5.71); n = 1 | 1.76 (0.26, 11.83); n = 1 | 1.25 (0.28, 5.59); n = 1 | NA | NA | ‐ | ‐ | ‐ | ‐ |
| Indwelling pleural catheter | 3.35 (1.64, 6.83); n = 2 Tau2 = 0; I2 = 0% | NA | NA | NA | NA | ‐ | ‐ | ‐ | ‐ |
| Placebo | 13.93 (0.66, 293.99); n = 1 | NA | NA | 3.33 (0.51, 21.58); n = 1 | NA | NA | ‐ | ‐ | ‐ |
| Mustine | NA | 8.00 (1.40, 45.76); n = 1 | NA | 2.72 (0.74, 9.98) n = 2*; Tau2= 0; I2= 0% | 3.00 (0.40, 22.71); n = 1 | NA | NA | ‐ | ‐ |
| Mitoxantrone | NA | NA | 3.18 (1.17, 8.65); n = 1 | NA | NA | 0.75 (0.32, 1.79); n = 1 | NA | NA | ‐ |
| Mepacrine | 2.08 (0.62, 6.96); n = 1 | NA | 0.16 (0.03, 0.89); n = 1 | 0.63 (0.05, 8.20); n = 1 | NA | 0.15 (0.03, 0.64); n = 1* | NA | 7.61 (0.35, 163.82); n = 1 | NA |
| Doxycycline | NA | 42.69 (2.13, 856.61); n = 1 | 0.67 (0.24, 1.86); n = 2; Tau2= 0; I2= 0% | NA | 1.91 (0.43, 8.48); n = 1 | NA | NA | NA | NA |
| Triethylenethiophosphoramide | NA | NA | NA | NA | NA | 2.06 (0.43, 9.80); n = 1* | NA | NA | 4.95 (1.02, 24.10); n = 1* |
| Adriamycin | NA | NA | NA | 1.11 (0.06, 20.49); n = 1* | NA | NA | 0.37 (0.01, 10.18); n = 1* | NA | NA |
| n = the number of studies included in the pair‐wise comparison. * Indicates that the comparison included a three‐arm study. NA = no direct pair‐wise comparison available. Results that are statistically significant at the conventional level of P < 0.05 are shaded in grey. ‐ indicates the odds ratio is already expressed elsewhere in the table comparing the interventions the other way around. | |||||||||
In the majority of cases, there was no evidence against the null hypothesis of no true difference between interventions (Table 1). However in 10 of the direct comparisons, the OR and 95% CI lay away from the null value of 1, giving evidence against the null hypothesis of no difference. A number of methods were less effective than talc poudrage at inducing pleurodesis, including bleomycin (OR 9.70 (95% CI 2.10 to 44.78), participants = 57; studies = 2) (Analysis 1.1), tetracycline (OR 12.10 (95% CI 1.32 to 111.30), participants = 33; studies = 1) (Analysis 4.1), mustine (OR 8.00 (95% CI 1.40 to 45.76), participants = 37; studies = 1) (Analysis 17.1) and doxycycline (OR 42.69 (95% CI 2.13 to 856.61), participants = 31; studies = 1) (Analysis 8.1). Interferon was less effective than bleomycin (OR 3.25 (95% CI 1.54 to 6.89), participants = 160; studies = 1) (Analysis 13.1). Bleomycin was less effective than mepacrine (OR 0.16 (0.03, 0.89), participants = 36; studies = 1) (Analysis 12.3).
Those treated with an IPC had more pleurodesis failures than those receiving talc slurry (OR 3.35 (95% CI 1.64 to 6.83), participants = 160; studies = 2) (Analysis 6.1). Triethylenephosphoramide was less effective than mepacrine (OR 4.95 (95% CI 1.02 to 24.10), participants = 29; studies = 1) (Analysis 14.1). There was also some evidence that tetracycline and mitoxantrone were less effective than bleomycin (OR 2.00 (95% CI 1.07 to 3.75); participants = 220; studies = 5) ) (Analysis 4.1) and OR 3.18 (95% CI 1.17 to 8.65); participants = 85; studies = 1 (Analysis 18.1) respectively). The comparison between talc slurry and talc poudrage gave some weak evidence that talc slurry may be less effective as the 95% CI was close to one (OR 1.31 (95% CI 0.92 to 1.85); participants = 599; studies = 3) (Analysis 2.1).
The heterogeneity between studies making similar comparisons was generally low. However, the comparison between C. parvum and bleomycin revealed a very high level of heterogeneity (Tau2 = 10.59, I2 = 94%) because the two included studies had conflicting results: (OR 0.05 (95% CI 0.01 to 0.29) in Hillerdal 1986; OR 5.69 (95% CI 1.38 to 23.48) in Ostrowski 1989) (Analysis 5.1). The number of participants in the comparison was small (98 patients randomised across the two studies; 78 of whom had sufficient data to be included in the primary outcome analysis) and Hillerdal 1986 was high risk of bias for two domains and unclear risk of bias for a further two. Hillerdal 1986 only included patients with adenocarcinoma or bronchogenic carcinoma, whereas Ostrowski 1989 included all cell types.
Sensitivity analysis of the direct comparisons using the fixed effect meta‐analysis model did not reveal any clinically or statistically meaningful differences (see Appendix 3).
Network meta‐analysis
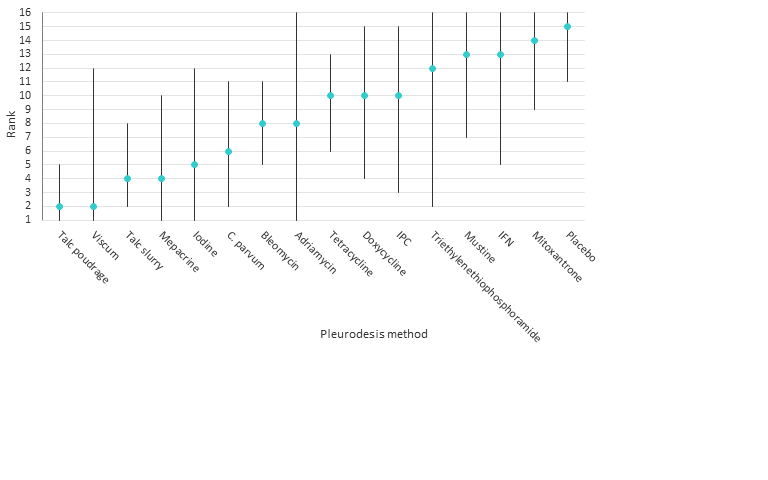
The results of the relative efficacies of the pleurodesis methods generated by the network meta‐analysis, which comprised 41 studies of 16 agents, including 2345 participants are shown in Table 2. The estimated ranks for each of the methods in terms of pleurodesis success are shown in Figure 5.
Estimated (95% Cr‐I) ranks for each of the pleurodesis methods from the main network
| Talc slurry | Talc poudrage | Bleomycin | Tetracycline | C. parvum | Interferon | Iodine | Indwelling pleural catheter | Placebo | Mustine | Mitoxantrone | Mepacrine | Doxycyline | Triethylenethiophosphoramide | viscum | |
| Talc poudrage | 0.42 (0.13, 1.19) | NA | ‐ | ‐ | ‐ | ‐ | ‐ | ‐ | ‐ | ‐ | ‐ | ‐ | ‐ | ‐ | ‐ |
| Bleomycin | 2.56 (1.05, 6.67) | 6.03 (2.19, 20.46) | NA | ‐ | ‐ | ‐ | ‐ | ‐ | ‐ | ‐ | ‐ | ‐ | ‐ | ‐ | ‐ |
| Tetracycline | 3.71 (1.22, 11.67) | 8.77 (2.74, 33.01) | 1.45 (0.59, 3.46) | NA | ‐ | ‐ | ‐ | ‐ | ‐ | ‐ | ‐ | ‐ | ‐ | ‐ | ‐ |
| C. parvum | 1.48 (0.34, 6.57) | 3.49 (0.79, 17.64) | 0.58 (0.16, 1.95) | 0.40 (0.10, 1.52) | NA | ‐ | ‐ | ‐ | ‐ | ‐ | ‐ | ‐ | ‐ | ‐ | ‐ |
| Interferon | 8.49 (0.94, 82.98) | 19.96 (2.22, 229.60) | 3.33 (0.43, 25.66) | 2.29 (0.26, 21.65) | 5.75 (0.55, 64.16) | NA | ‐ | ‐ | ‐ | ‐ | ‐ | ‐ | ‐ | ‐ | ‐ |
| Iodine | 1.25 (0.22, 6.77) | 2.97 (0.55, 17.21) | 0.49 (0.09, 2.49) | 0.34 (0.05, 2.04) | 0.85 (0.11, 6.35) | 0.15 (0.01, 1.90) | NA | ‐ | ‐ | ‐ | ‐ | ‐ | ‐ | ‐ | ‐ |
| Indwelling pleural catheter | 3.47 (0.75, 16.46) | 8.19 (1.32, 59.02) | 1.36 (0.22, 8.01) | 0.94 (0.14, 6.27) | 2.36 (0.28, 19.88) | 0.41 (0.03, 5.96) | 2.76 (0.29, 28.48) | NA | ‐ | ‐ | ‐ | ‐ | ‐ | ‐ | ‐ |
| Placebo | 19.50 (3.73, 128.50) | 46.51 (7.86, 375.90) | 7.64 (1.55, 44.22) | 5.29 (1.04, 31.95) | 13.28 (1.91, 110.80) | 2.29 (0.18, 34.14) | 15.63 (1.72, 179.10) | 5.61 (0.59, 65.18) | NA | ‐ | ‐ | ‐ | ‐ | ‐ | ‐ |
| Mustine | 7.50 (1.35, 43.86) | 17.75 (3.59, 105.70) | 2.94 (0.58, 14.84) | 2.02 (0.43, 9.79) | 5.07 (0.91, 29.81) | 0.88 (0.06, 11.71) | 5.98 (0.68, 58.17) | 2.16 (0.22, 22.76) | 0.38 (0.04, 3.32) | NA | ‐ | ‐ | ‐ | ‐ | ‐ |
| Mitoxantrone | 12.87 (2.36, 89.02) | 30.53 (5.11, 259.50) | 5.04 (1.04, 28.67) | 3.48 (0.64, 22.72) | 8.76 (1.24, 73.66) | 1.51 (0.12, 22.89) | 10.28 (1.12, 119.70) | 3.71 (0.38, 44.85) | 0.66 (0.13, 3.52) | 1.73 (0.19, 17.80 | NA | ‐ | ‐ | ‐ | ‐ |
| Mepacrine | 0.98 (0.22, 4.15) | 2.32 (0.45, 12.99) | 0.38 (0.09, 1.52) | 0.27 (0.05, 1.17) | 0.67 (0.10, 4.06) | 0.12 (0.01, 1.31) | 0.78 (0.09, 6.55) | 0.28 (0.03, 2.32) | 0.05 (0.01, 0.28) | 0.13 (0.02, 0.99) | 0.08 (0.01, 0.47) | NA | ‐ | ‐ | ‐ |
| Doxycycline | 3.49 (0.68, 19.56) | 8.23 (1.70, 50.18) | 1.37 (0.31, 6.09) | 0.94 (0.18, 5.09) | 2.36 (0.46, 13.09) | 0.41 (0.03, 5.14) | 2.78 (0.33, 26.50) | 1.00 (0.11, 10.23) | 0.18 (0.02, 1.53) | 0.47 (0.06, 3.77) | 0.27 (0.03, 2.31) | 3.56 (0.50, 28.59) | NA | ‐ | ‐ |
| Triethylenethiophosphoramide | 5.53 (0.40, 80.97) | 13.07 (0.89, 227.30) | 2.16 (0.16, 29.77) | 1.50 (0.10, 21.61) | 3.74 (0.21, 66.99) | 0.65 (0.02, 17.63) | 4.40 (0.22, 98.58) | 1.59 (0.08, 35.28) | 0.28 (0.02, 3.62) | 0.74 (0.04, 15.00) | 0.43 (0.02, 6.80) | 5.60 (0.55, 63.81) | 1.59 (0.08, 31.05) | NA | ‐ |
| Adriamycin | 2.31 (0.03, 165.40) | 5.53 (0.08, 403.50) | 0.90 (0.01, 59.43) | 0.62 (0.01, 38.58) | 1.57 (0.02, 114.20) | 0.27 (0.00, 27.43) | 1.85 (0.02, 162.70) | 0.67 (0.01, 62.01) | 0.12 (0.00, 9.46) | 0.31 (0.00, 20.50) | 0.18 (0.00, 14.59) | 2.36 (0.03, 191.30) | 0.66 (0.01, 52.71) | 0.42 (0.00, 54.35) | NA |
| Viscum | 0.39 (0.01, 8.23) | 0.92 (0.03, 21.77) | 0.15 (0.01, 2.73) | 0.10 (0.00, 2.17) | 0.26 (0.01, 6.21) | 0.04 (0.00, 1.55) | 0.31 (0.01, 9.07) | 0.11 (0.00, 3.44) | 0.02 (0.00, 0.53) | 0.05 (0.00, 1.41) | 0.03 (0.00, 0.79) | 0.39 (0.01, 10.28) | 0.11 (0.00, 2.83) | 0.07 (0.00, 3.48) | 0.16 (0.00, 26.60) |
| Results that are statistically significant at the conventional level of P < 0.05 are shaded in grey. ‐ indicates the odds ratio is already expressed elsewhere in the table comparing the interventions the other way around. NA= not applicable. | |||||||||||||||
The network comparisons between talc poudrage and bleomycin, tetracycline, interferon (IFN), IPC, placebo, mustine, mitoxantrone and doxycycline, all provided evidence against the null hypotheses of no difference in favour of talc poudrage resulting in fewer pleurodesis failures (See Table 2). The estimated rank of talc poudrage was second of 16 pleurodesis methods (95% Cr‐I 1 to 5).
Other potentially efficacious agents were viscum, talc slurry, mepacrine, iodine and C. parvum, with estimated ranks of second (95% Cr‐I 1 to 12), fourth (95% Cr‐I 2 to 8), fourth (95% Cr‐I 1 to 10), fifth (95% Cr‐I 1 to 12) and sixth (95% Cr‐I 2 to 11) respectively (see Figure 5). The ORs and 95% Cr‐Is comparing talc slurry with tetracycline, placebo, mustine and mitoxantrone, lay far away from the null value of 1, providing evidence that talc slurry is more effective than these other agents. The comparisons between talc slurry and bleomycin and IFN had 95% Cr‐I close to 1, providing some evidence that talc slurry may result in fewer pleurodesis failures.
The network provides some evidence that viscum is more effective than placebo and mitoxantrone, with ORs and 95% Cr‐Is lying far away from the null value of 1. However, the direct evidence on this agent was from only a single small study of 17 patients and the confidence intervals for its estimated rank are very wide, reflecting uncertainty within the network as to its true rank.
Placebo was most probably the least successful pleurodesis agent, with an estimated rank of fifteenth of 16 methods (95% Cr‐I 11 to 16). The ORs and 95% Cr‐Is comparing placebo with talc slurry, talc poudrage, bleomycin, C. parvum, iodine and mepacrine were all far away from 1, providing evidence that placebo is less effective.
Heterogeneity
The between‐study standard deviation in treatment effect estimates (log odds ratios) across the whole network was estimated to be Tau = 0.88 (95% Cr‐I 0.42 to 1.48), suggesting a high degree of heterogeneity, although the wide credible interval indicates a substantial degree of uncertainty around this.
We performed a number of sensitivity analyses to explore the heterogeneity found in the main network based on pre‐defined potential clinical effect modifiers (see Appendix 4). Due to the smaller number of studies in these analyses, many of them contained fewer pleurodesis methods than the main network.
The majority of the sensitivity analyses found less evidence of true differences between the efficacies of individual methods. The estimated ranks were generally similar to the main network, although all ranks had very wide credible intervals and therefore were imprecise. The sensitivity analyses showed very wide credible intervals for the between‐study standard deviation (representing heterogeneity), with the upper limits of 95% Cr‐Is often being close to 2. Since a uniform(0,2) prior distribution was assumed for Tau in each analysis, it is likely that the upper limits would increase further still if a wider prior distribution was assumed.
However, the estimate of the between‐studies standard deviation was reduced when we restricted analysis to those studies with a lower risk of bias (defined as two or fewer ‘high risk’ domains in the risk of bias tool). The credible intervals for Tau did however overlap, so it is unclear whether heterogeneity was truly reduced (Tau 0.46 (95% Cr‐I 0.03 to 1.09)) for the low risk of bias subgroup vs Tau 0.88 (95% Cr‐I 0.43 to 1.49) for the main network) (Appendix 4, Appendix 5, Appendix 6). However, the overlapping credible intervals reflect considerable uncertainty about this. Results were fairly robust to exclusion of the higher risk studies, although with doxycycline and C. parvum perhaps appearing a little better, probably due to the removal of two particular studies (Kuzdzal 2003; Ostrowski 1989).
Due to the diversity of doses used for many of the pleurodesis agents evaluated, we were unable to examine the effect of dose on the degree of heterogeneity observed. This is one potential cause for the unexplained heterogeneity, which was not feasible to examine in the network.
Inconsistency
Several estimated loop‐specific inconsistency factors (Chaimani 2013) were very large, suggesting potential inconsistencies between the direct and indirect evidence (see Figure 6). The CIs around the estimated inconsistency factors were also very wide, due to the small volume of evidence per loop. Only two inconsistency factors had 95% CIs which did not cross the null value of 1. The loop involving talc slurry, talc poudrage and bleomycin did provide evidence of a difference between the direct and indirect evidence, with a ratio of odds ratios (ROR) of 7.0 (95% Cr‐I 1.1 to 43.8). The talc slurry, bleomycin and mepacrine loop also showed significant inconsistency (ROR 10.2 (95% Cr‐I 1.1 to 96.9). There were no obvious differences between the distribution of potential effect modifiers between the three direct comparisons (see Appendix 2; Appendix 4) and hence these inconsistencies could not be explained.
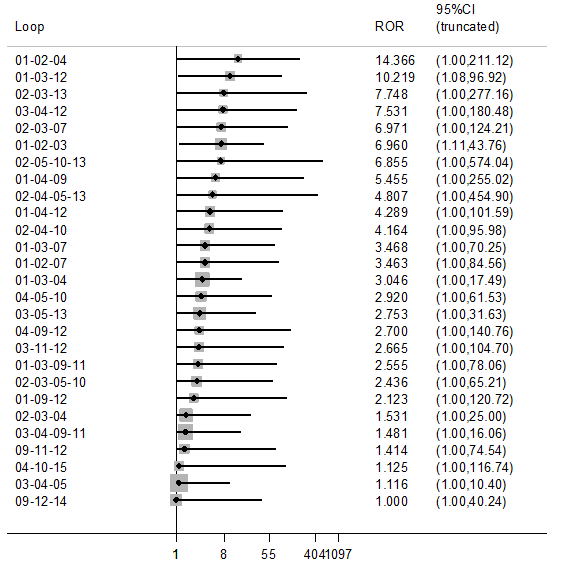
Inconsistency plot for the main network. Treatment codes: 01 = Talc slurry; 02 = Talc poudrage; 03 = Bleomycin; 04 = Tetracycline; 05 = C. parvum; 06 = Interferon; 07 = Iodine; 08 = Indwelling pleural catheter; 09 = Placebo; 10 = Mustine; 11 = Mitoxantrone; 12 = Mepacrine; 13 = Doxycyline; 14 = Triethylenethiophosphoramide; 15 = Adriamycin. Abbreviations: ROR = Ratio of Odds Ratios; 95% CI = 95% Confidence interval. Heterogeneity variance was set at 0.8847 (reflecting the estimation of Tau from the network)
Across the entire network, there was no evidence of global inconsistency. The Deviance Information Criterion (DIC) was 398 for the consistency model and 404 for the inconsistency model, suggesting that the consistency model fits the data marginally better.
Similarly, there was no evidence of global inconsistency for any of the subgroup or sensitivity network meta‐analyses (Appendix 4).
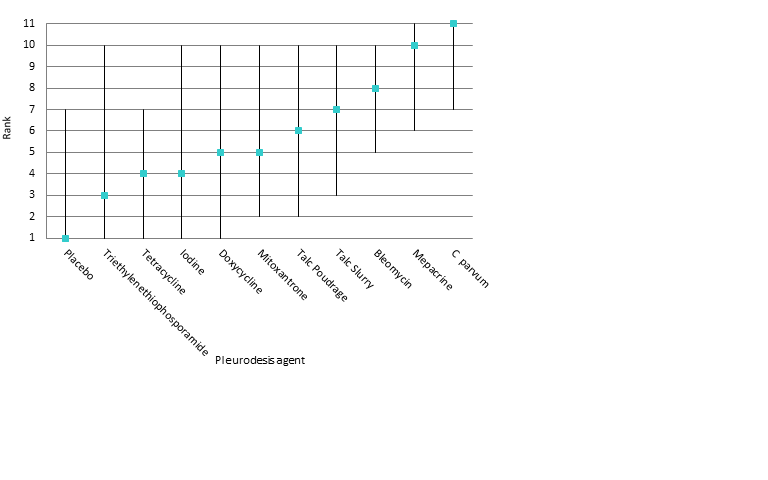
Additional post‐hoc sensitivity analysis
The sensitivity analysis that only evaluated agents given through an intercostal chest tube included 29 studies of 13 agents (see Appendix 7 and Appendix 8). There was very little evidence of substantial differences between the agents, the credible intervals were wide and the estimated rankings for the individual agents were also very imprecise.
The degree of heterogeneity was even higher than the main network (Tau 0.98 (95% Cr‐I 0.45 to 1.72). There was no evidence of global inconsistency (DICs for the consistency and inconsistency models were 271 and 276 respectively). Similar to the main network, there was evidence of loop‐specific inconsistency for the talc slurry, bleomycin and mepacrine loop (ROR 10.2 (95% Cr‐I 1.1 to 96.5)).
Primary outcomes for the methods not included in the network meta‐analysis
Pleurodesis methods
The results of the pair‐wise comparisons of the pleurodesis methods not included in the network meta‐analysis are shown in Table 3.
| Study | Reason study excluded from network | Intrapleural agent or intervention 1 | Pleurodesis failure rate for agent 1 | Intrapleural agent or intervention 2 | Pleurodesis failure rate for agent 2 | OR (95% CI) of agent 1 compared with agent 2*** |
| Du 2013 | Lung cancer specific therapy | Cisplatin and bevacizumab | 6/36 | Cisplatin | 17/34 | 0.20 (0.07, 0.60) |
| Emad 1996* | No pleurodesis failures in the Combined group | Tetracycline** | 3/19 | Combined tetracycline and bleomycin | 0/19 | 8.27 (0.40, 172.05) |
| Bleomycin** | 2/19 | Combined tetracycline and bleomycin | 0/19 | 5.57 (0.25, 124.19) | ||
| Ishida 2006* | Lung cancer specific therapy | OK‐432 | 8/17 | Cisplatin | 11/17 | 0.48 (0.12, 1.92) |
| OK‐432 | 8/17 | OK‐432 and cisplatin | 1/15 | 12.44 (1.32, 117.03) | ||
| Cisplatin | 11/17 | OK‐432 and cisplatin | 1/15 | 25.67 (2.68, 245.84) | ||
| Kasahara 2006 | Lung cancer specific therapy | High dose OK‐432 | 5/19 | Low dose OK‐432 | 3/19 | 1.90 (0.38, 9.44) |
| Luh 1992 | Lung cancer specific therapy | OK‐432 | 3/26 | Mitomycin C | 9/27 | 0.26 (0.06, 1.11) |
| Maskell 2004 | Two Talc slurry preparations | Mixed particle talc | 3/14 | Graded talc (particles >20µm) | 2/14 | 1.64 (0.23, 11.70)) |
| Masuno 1991 | Lung cancer specific therapy | LC9018 and Adriamycin | 10/38 | Adriamycin | 23/38 | 0.23 (0.09, 0.62) |
| Paschoalini 2005 | No pleurodesis failures in Silver Nitrate group | Talc slurry | 1/9 | Silver nitrate | 0/16 | 5.85 (0.21, 158.82) |
| Rintoul 2014 | MPM specific surgical technique | Talc pleurodesis (slurry or poudrage) | 25/62 | VATS pleurectomy | 24/60 | 0.88 (0.43, 1.82) |
| Terra 2015* | Comparison of different doses of Silver Nitrate | 90 mg silver nitrate | 0/20 | 150 mg silver nitrate | 0/20 | not estimable |
| 90 mg silver nitrate | 0/20 | 180 mg silver nitrate | 2/20 | 0.18 (0.01, 4.01) | ||
| 150 mg silver nitrate | 0/20 | 180 mg silver nitrate | 2/20 | 0.19 (0.01, 4.01) | ||
| Yoshida 2007* | Lung cancer specific therapy | OK‐432 | 8/33 | Bleomycin | 11/35 | 0.70 (0.24, 2.03) |
| OK‐432 | 8/33 | Cisplatin and etoposide | 10/34 | 0.77 (0.26, 2.27) | ||
| Bleomycin | 11/35 | Cisplatin and etoposide | 10/34 | 1.10 (0.39, 3.07) | ||
| Zhao 2009 | Lung cancer specific therapy | rAd‐p53 and cisplatin | 3/17 | Cisplatin | 9/18 | 0.21 (0.05, 1.01) |
| *Three‐arm study. **The results for the pair‐wise comparison between tetracycline and bleomycin are included in the network meta‐analysis. ***Results that are statistically significant at the conventional level of P < 0.05 are shaded in grey | ||||||
Two agents (silver nitrate and the combination of bleomycin and tetracycline together) were excluded as there were no pleurodesis failures for the agents, resulting in numerical difficulties when we attempted to include them in the network meta‐analysis model. The pair‐wise comparisons in these studies did not provide evidence against the null hypothesis of no true difference between interventions (see Table 3).
One study was not included in the network as it was a three‐arm trial evaluating different doses of silver nitrate administered via a chest tube (Terra 2015). There were only two of 60 participants who had a failed pleurodesis, both in the group receiving the highest dose of silver nitrate.
Seven studies could not be included in the network meta‐analysis as they evaluated tumour‐specific therapies for patients with MPE due to non‐small cell lung cancer (NSCLC) (Du 2013; Ishida 2006; Kasahara 2006; Luh 1992; Masuno 1991; Yoshida 2007; Zhao 2009). The results could not be generalised to patients with other tumour types and hence these interventions were not deemed jointly randomisable. All the studies randomised only small numbers of participants. However in four of the direct comparisons, the OR and 95% CI lay far away from the null value of 1, giving evidence against the null hypothesis of no difference.
Du 2013 randomised patients with NSCLC to receive three cycles of either cisplatin and intra‐pleural bevacizumab (a humanised monoclonal antibody to VEGF) or cisplatin alone. More patients in the cisplatin‐alone group had pleurodesis failure than in the combination group (6/36 vs 17/34 respectively; OR 5.00 (95% CI 1.66 to 15.09); participants = 70; studies = 1) (Analysis 23.1) (Du 2013).
Masuno 1991 randomised NSCLC patients with MPE to receive up to two doses of either intra‐pleural LC9018 (lyophilised Lactobacillus casei) and Adriamycin or Adriamycin alone. There were more pleurodesis failures in the control group compared to those who received LC9018 (23/38 vs 10/38 respectively; OR 4.29 (95% CI 1.62 to 11.35); participants = 76; studies = 1) (Analysis 15.1) (Masuno 1991).
Finally, Ishida 2006 conducted a three‐arm trial, comparing intrapleural OK‐432, an inactivated product of Streptococcus pyogenes A3 with anti‐tumour immune‐modulatory effects in lung cancer, with cisplatin and combined therapy (both OK‐432 and cisplatin). Those treated with OK‐432 alone had a higher pleurodesis failure rate than those receiving combination treatment (OR 12.44 (95% CI 1.32 to 117.03; participants = 32; studies = 1) but a lower failure rate than those receiving cisplatin alone (OR 0.48 (95% CI 0.12 to 1.92); participants = 34; studies = 1) (Analysis 11.1).
Other methods to optimise pleurodesis
We evaluated a number of methods to optimise pleurodesis, but these were not included in the network because they were not considered jointly randomisable (see Table 4). All the studies included very small numbers of patients and none provided evidence of a difference in pleurodesis failure rates between the treatments being compared (see Table 4). The results of the ongoing TIME‐1 and TIME‐3 studies will provide additional data regarding the effect of drain size, analgesia use and intrapleural fibrinolytics in the future. No randomised controlled trials examining the role of pleuro‐peritoneal shunts were identified.
| Type of method to optimise pleurodesis | Study | Intervention 1 | Pleurodesis failure rate for intervention 1 | Intervention 2 | Pleurodesis failure rate for intervention 2 | OR (95% CI) of intervention 1 compared with intervention 2* |
| Mode of administration | Evans 1993 | Tetracycline pleurodesis at the end of thoracoscopy | 2/15 | Tetracycline pleurodesis through an intercostal cannula | 5/14 | 0.28 (0.04, 1.76) |
| Chest tube size | Clementsen 1998 | Small‐bore chest drain | 2/9 | Large‐bore chest drain | 3/9 | 0.57 (0.07, 4.64) |
| Patient rotation | Mager 2002 | Rotation after instillation of talc | 2/10 | No rotation after instillation of talc | 1/10 | 2.25 (0.17, 29.77) |
| Duration of drainage after administration of the sclerosant | Goodman 2006 | Drain removed 24 hours after pleurodesis | 2/16 | Drain removed 72 hours after pleurodesis | 4/19 | 0.54 (0.08, 3.40) |
| Villanueva 1994 | Drain removal the day after pleurodesis | 2/9 | Drain removal when < 150 ml/day output | 3/15 | 1.14 (0.15, 8.59) | |
| Yildirim 2005 | Fractionated dose oxytetracycline (4 divided doses at 6‐hourly intervals) | 0/12 | Single bedside instillation of oxytetracycline | 2/8 | 0.10 (0.00, 2.50) | |
| Duration of drainage prior to administration of the sclerosant | Ozkul 2014 | Early instillation of talc slurry after drain insertion | 5/40 | Instillation of talc slurry when daily drainage from chest tube < 300 ml/day | 6/39 | 0.79 (0.22, 2.82) |
| Intrapleural fibrinolytics | Okur 2011 | Intrapleural streptokinase | 14/19 | No intrapleural streptokinase | 9/16 | 2.18 (0.53, 9.02) |
| Pleural abrasion at thoracoscopy | Crnjac 2004 | Talc slurry | 11/42 | Thoracoscopic mechanical pleurodesis | 6/45 | 2.31 (0.77, 6.93) |
| * Results that are statistically significant at the conventional level of P < 0.05 are shaded in grey | ||||||
SECONDARY OUTCOMES
Due to the diversity of reporting techniques and outcome measures, it was not possible to perform a formal statistical analysis of many of the pre‐defined secondary outcomes.
Adverse effects/complications
The majority of studies reported data on adverse effects of the interventions, however three studies did not (Evans 1993; Kuzdzal 2003; Villanueva 1994). Kefford 1980 reported side effects but the patients with pleural effusions could not be differentiated from those with ascites or pericardial effusions . Data on side effects were provided in personal communications with two study authors (Goodman 2006; Mager 2002). The methods used to describe the side effects observed varied widely between studies.
Network meta‐analysis was used to compare rates of the most commonly reported side effects, fever and pain.
Fever
The direct evidence regarding fever is shown in Appendix 9. The fever network consisted of 23 trials of 11 different treatments, including 1518 participants. The odds ratios are shown in Table 5 and estimated rankings of the interventions in Figure 7. All the estimates had very wide credible intervals, indicating a large degree of imprecision. However, placebo appeared to be associated with the least fever (estimated rank first of 11 interventions (95% Cr‐I 1 to 7)). The methods associated with the most fever appeared to be C. parvum and mepacrine, with estimated ranks of eleventh (95% Cr‐I 7 to 11) and tenth (95% Cr‐I 6 to 11) respectively. However, the between‐studies standard deviation (Tau) for the whole network was 1.35 (95% Cr‐I 0.58 to 1.95), suggesting a very high degree of heterogeneity. There was no evidence for global inconsistency (DIC for consistency and inconsistency models was 230 and 231 respectively). However, the loop‐specific inconsistency factors were large, suggesting potential inconsistencies between the direct and indirect evidence. The 95% CIs around the inconsistency factors were wide and crossed the null value of 1 in all but one loop. There was strong evidence of inconsistency regarding fever in the bleomycin/tetracycline/C. parvum loop (ROR 59.2 (95% CI 2.6 to 1353.7)).
Estimated rank (95% Cr‐I) for causing fever (a low rank suggests less fever)
| Talc slurry | Talc poudrage | Bleomycin | Tetracycline | C. parvum | Iodine | Mepacrine | Placebo | Mitoxantrone | Doxycycline | |
| Talc poudrage | 0.66 (0.09, 3.98) | NA | ‐ | ‐ | ‐ | ‐ | ‐ | ‐ | ‐ | ‐ |
| Bleomycin | 1.26 (0.24, 6.82) | 1.93 (0.22, 19.42) | NA | ‐ | ‐ | ‐ | ‐ | ‐ | ‐ | ‐ |
| Tetracycline | 0.29 (0.04, 2.09) | 0.45 (0.04, 5.74) | 0.23 (0.06, 0.88) | NA | ‐ | ‐ | ‐ | ‐ | ‐ | ‐ |
| C. parvum | 6.31 (0.61, 70.69) | 9.71 (0.65, 176.70) | 5.01 (0.92, 29.12) | 21.46 (3.10, 175.70) | NA | ‐ | ‐ | ‐ | ‐ | ‐ |
| Iodine | 0.27 (0.02, 3.69) | 0.42 (0.03, 6.09) | 0.21 (0.01, 4.25) | 0.93 (0.03, 23.41) | 0.04 (0.00, 1.29) | NA | ‐ | ‐ | ‐ | ‐ |
| Mepacrine | 4.52 (0.30, 76.00) | 6.95 (0.34, 182.20) | 3.58 (0.40, 36.59) | 15.41 (1.62, 178.80) | 0.71 (0.05, 11.99) | 16.72 (0.43, 831.10) | NA | ‐ | ‐ | ‐ |
| Placebo | 0.06 (0.00, 2.00) | 0.10 (0.00, 4.27) | 0.05 (0.00, 1.08) | 0.22 (0.00, 5.71) | 0.01 (0.00, 0.32) | 0.23 (0.00, 17.55) | 0.01 (0.00, 0.30) | NA | ‐ | ‐ |
| Mitoxantrone | 0.48 (0.02, 10.24) | 0.73 (0.02, 22.95) | 0.38 (0.02, 5.02) | 1.64 (0.07, 29.71) | 0.08 (0.00, 1.60) | 1.75 (0.03, 99.74) | 0.11 (0.00, 2.16) | 7.57 (0.59, 138.80) | NA | ‐ |
| Doxycycline | 0.49 (0.03, 6.13) | 0.75 (0.04, 14.68) | 0.39 (0.05, 2.66) | 1.67 (0.14, 17.22) | 0.08 (0.01, 0.63) | 1.81 (0.05, 69.03) | 0.11 (0.00, 1.93) | 7.69 (0.19, 539.10) | 1.02 (0.04, 33.23) | NA |
| Triethylenephosphoramide | 0.24 (0.00, 17.04) | 0.37 (0.00, 35.93) | 0.19 (0.00, 9.80) | 0.81 (0.02, 47.08) | 0.04 (0.00, 2.63) | 0.88 (0.01, 139.50) | 0.05 (0.00, 1.49) | 3.62 (0.07, 529.40) | 0.49 (0.01, 49.44 | 0.49 (0.01, 45.90) |
| Results that are statistically significant at the conventional level of P < 0.05 are shaded in grey. ‐ indicates the odds ratio is already expressed elsewhere in the table comparing the interventions the other way around. NA= not applicable | ||||||||||
For those studies, which were not included in the network meta‐analysis but provided data on fever, the majority revealed no difference between the interventions (Emad 1996; Kasahara 2006; Masuno 1991; Paschoalini 2005; Terra 2015). Two studies evaluating OK‐432 revealed more fever in this group compared to the control groups (Ishida 2006; Luh 1992; Yoshida 2007) (Analysis 11.3). The mixed talc group had more fever than the graded talc group (OR 15.92 (95% CI 1.81 to 140.16; participants = 46; studies = 1) (Maskell 2004) (Analysis 21.3). The group who received cisplatin alone had less fever than those who also received rAd‐p53 (OR 0.09 (95% CI 0.02 to 0.51; participants = 35; studies = 1) (Zhao 2009) (Analysis 23.3)
Pain
Six studies were not included in the network meta‐analysis as they collected pain scores (rather than whether or not each patient had pain post procedure) (Agarwal 2011; Alavi 2011; Bjermer 1995; Davies 2012; Paschoalini 2005; Zimmer 1997). Bjermer 1995 reported higher levels of pain in the mepacrine group compared to the mitoxantrone group as measured by the WHO analgesic ladder (no raw figures provided) (WHO 2016). The other six studies did not provide evidence of a difference in pain between the methods studied.
Only 17 studies and nine treatments (including 1279 participants) could be included in the network meta‐analysis regarding pain (see Appendix 10, Appendix 11 and Appendix 12). There was no evidence to support a difference between the methods in terms of the proportion of participants complaining of pain after the intervention. All the estimates had very wide confidence intervals, indicating a large degree of imprecision. The between‐studies standard deviation (Tau) for the network was 0.65 (95% Cr‐I 0.05 to 1.63), indicating considerable heterogeneity. There was no evidence of global inconsistency (DIC 177 for the consistency model versus 177 for the inconsistency model). Several of the estimated inconsistency factors were large, although all had 95% CIs which crossed 1, indicating no clear evidence of loop‐specific inconsistency.
Of those studies which reported pain outcomes but were not included in the network for pain, the majority revealed no difference between interventions (Kasahara 2006; Luh 1992; Masuno 1991; Okur 2011; Paschoalini 2005; Terra 2015; Yoshida 2007; Zhao 2009). Those who underwent a small‐bore drain insertion had less pain at the time of insertion than those with a large‐bore drain (OR 0.08 (95% CI 0.01 to 0.75) (Clementsen 1998) (Analysis 19.2)). One study revealed more pain in the OK‐432 groups than controls (Ishida 2006) (Analysis 11.2).
Patient reported breathlessness
Eleven studies reported information regarding control of breathlessness, using a variety of techniques (MRC dyspnoea scale (Mohsen 2011); VAS score (Bjermer 1995; Davies 2012; Diacon 2000; Terra 2015); 'dyspnoea index' (Demmy 2012); QLQ‐C30/LC13 questionnaires (Rintoul 2014), functional class (Masuno 1991; Rafiei 2014; Zimmer 1997), scale of 0 ‐ 10 (Alavi 2011)).
The two studies comparing talc slurry with IPC reported breathlessness scores (Davies 2012 using a VAS score and Demmy 2012 using a 'dyspnoea index'). Davies 2012 found dyspnoea improved in both study arms, to a similar extent at 42 days. However the IPC group had a greater improvement at six months compared to the talc group (mean difference of ‐14 mm (95% CI ‐25.2 to ‐2.8) P = 0.01). Demmy 2012 found that the IPC group had better dyspnoea scores at 30 days than the talc slurry group (8.5 vs 6.1; P = 0.047).
Rafiei 2014 found more patients receiving doxycycline had severe dyspnoea at two months compared to those receiving bleomycin (5/20 (24%) vs 1/21 (5%) respectively; P = 0.01). Bjermer 1995 noted that those receiving mitoxantrone had a larger reduction in breathlessness than the mepacrine‐treated patients (absolute values not reported; P < 0.001). Masuno 1991 did not provide the absolute figures but reported “statistically significant” improvements in dyspnoea one week after treatment at ‘the final judgement’ in the LC9018 group. In the remaining studies reporting dyspnoea, no differences were identified between the study arms in terms of the degree of improvement of dyspnoea (Alavi 2011; Diacon 2000; Mohsen 2011; Rintoul 2014; Terra 2015; Zimmer 1997).
Quality of life and symptom control
Fifteen of 62 studies reported quality of life or assessed a symptoms score other than dyspnoea. The methods used were Karnofsky performance scale (Demmy 2012; Du 2013; Groth 1991; Masuno 1991; Zhao 2009), QLQ‐C30 questionnaire (Davies 2012, Dresler 2005, Rintoul 2014), SF36 scale (Terra 2009), WHOQoL‐bref scale (Terra 2015), EQ5D (Rintoul 2014), VAS Score (Diacon 2000), a symptom questionnaire (Bjermer 1995) and numeric pain scale (Alavi 2011; Paschoalini 2005; Zimmer 1997). Most studies did not report any evidence of a difference between the treatment groups (Alavi 2011; Davies 2012; Diacon 2000; Groth 1991; Paschoalini 2005; Terra 2009; Terra 2015Zimmer 1997). Bjermer 1995 reported a bigger improvement in tiredness in the mitoxatrone group compared to the mepacrine group (absolute figures not provided; P < 0.001). Dresler 2005 noted less fatigue in the talc poudrage group than the talc slurry group (absolute figures not provided; P = 0.016). Those participants who received LC9018 had better performance scores at one week than those who did not (absolute figures not provided; P < 0.05) (Masuno 1991). Zhao 2009 found that more patients who received combination treatment with cisplatin and Ad‐p53 had an improvement in their Performance Score at six weeks than those receiving cisplatin alone (11/17 (65%) vs 6/18 (33%) respectively, P < 0.05). The participants who underwent a VATS partial pleurectomy had better EQ5D scores at six months than the talc group in the MesoVATS study (MD 0.08 (0.003, 0.16); P = 0.042) but no difference in their QLQ‐C30 scores (Rintoul 2014). Demmy 2012 did not provide data by treatment group. Du 2013 reported 30 patients (83%) receiving bevacizumab and cisplatin had an improvement in their Karnofsky performance score as opposed to 15 (50%) in the cisplatin group.
Costs
Only seven of 62 trials reported the relative costs of the interventions. Rapid pleurodesis was found to be cheaper than standard care in Yildirim 2005 (USD 245 (SD 71.5) vs USD 860 (SD 496) respectively). Talc slurry was cheaper than bleomycin in three studies: Ong 2000 evaluated the cost per dose (USD 1 vs USD 309 per dose respectively); Haddad 2004 calculated the complete cost for the entire procedure (USD 488 (SD 212.5) vs USD 796 (SD 207.3) respectively) and Zimmer 1997 calculated the cost of each treatment (USD 12.36 vs USD 955.83 respectively). Talc poudrage was also cheaper than bleomycin in Diacon 2000 (CHF 3893 (Swiss Francs) (USD 4206) vs CHF 4169 (USD 4504) respectively). The total cost of VATS pleurectomy was more than talc pleurodesis (GBP 14,252 (USD 21,682) vs GBP 10,436 (USD 15,876)) (Rintoul 2014). Dresler 2005 reported no difference between the cost of talc slurry and poudrage (no figures quoted).
Mortality
Thirty‐four trials provided data on patient mortality. Evaluating the direct evidence, only two of these found evidence of a difference between the treatment arms. Evans 1993 found survival was longer after thoracoscopic tetracycline pleurodesis than bedside administration (total n = 34; P = 0.03 (raw data only available as a survival curve)). In the comparison between bleomycin and IFN, those receiving bleomycin appeared to live longer (OR 0.46 (95% CI 0.25 to 0.87); n = 160) (Analysis 1.3).
Twenty trials of 12 treatments, including 1430 participants, were incorporated into a network meta‐analysis looking at mortality (see Appendix 13; Appendix 14 and Appendix 15). All but one of the OR 95% Cr‐Is crossed 1, providing no evidence against the null hypothesis of no effect. There was limited evidence that those who received tetracycline lived longer than those receiving mitoxantrone (OR 0.16 (95% Cr‐I 0.03 to 0.72)) (see Appendix 14). Although some of the credible intervals were wide, they were generally narrower than those seen in the pleurodesis efficacy networks. The rankings were very imprecise, with wide confidence intervals: statistically there was no evidence that the rankings of any of the pleurodesis methods differed from each other. The degree of heterogeneity was low (Tau 0.40 (95% Cr‐I 0.02 to 1.21)). There was no evidence of global inconsistency (DIC 211 for the consistency model vs 217 for the inconsistency model) or loop‐specific inconsistency.
The majority of studies, which were not included in the network also showed no differences in mortality (Clementsen 1998; Crnjac 2004; Goodman 2006; Ishida 2006; Mager 2002; Maskell 2004; Rintoul 2014; Terra 2015; Villanueva 1994; Yildirim 2005; Yoshida 2007; Zhao 2009). Evans 1993 reported a longer survival after surgical administration of tetracycline than after medical treatment although no raw data were provided (P = 0.03).
Median survival
Twenty‐five studies reported median survivals for the treatment groups and only one of these found a survival difference between the treatment arms (Masuno 1991: median survival of 232 days in the LC9018 group versus 125 days in the control arm; n = 95; P = 0.008). Kasahara 2006 reported a longer median survival in those receiving high doseOK‐432 than low dose, but did not report the spread or whether this difference was significant (33.6 days versus 22.6 days respectively; n = 38).
Length of inpatient stay
Sixteen of 62 studies reported total length of hospital stay. Many reported no evidence of a statistically significant difference between the groups (Bayly 1978; Haddad 2004; Lynch 1996; Ong 2000; Paschoalini 2005; Schmidt 1997; Terra 2009; Yim 1996; Zimmer 1997). Yildirim 2005 and Goodman 2006 reported shorter length of stay in the group whose drains were removed earlier following sclerosant administration compared to standard care (Yildirim 2005 : mean 2.33 days (SD 0.62) vs 8.33 (SD 4.85) respectively (P < 0.001) 27 participants; Goodman 2006: median 4 days (IQR 4 ‐ 8) vs 8 (6 ‐ 9) respectively (P < 0.01) 41 participants). Ozkul 2014, which evaluated a rapid drainage strategy prior to sclerosant administration, also showed this group had a shorter length of stay than the standard care group (mean 2.2 days versus 9.0 days respectively (P < 0.001) 79 participants). The talc group had a shorter length of stay than the VATS partial pleurectomy group in the MesoVATS study (median 3 days (IQR 2 ‐ 5) vs 7 days (IQR 5 ‐ 11) respectively (P < 0.001); 196 participants) (Rintoul 2014). Those undergoing TMP had a shorter hospital stay than those receiving talc slurry in Crnjac 2004 (mean 5.5 days (SD 2.5) vs 7.5 (SD 3.3) respectively (P = 0.001); 87 participants). Mohsen 2011 found patients receiving iodine had a shorter length of stay than those undergoing talc poudrage (mean 4.5 days (SD 1.1) vs 5.7 (SD 2) respectively (P = 0.02); 42 participants). In TIME‐2, the IPC participants had a shorter inpatient stay than the talc slurry participants (‐3.5 days (95% CI ‐4.8 to ‐1.5) (P < 0.001); 106 participants) (Davies 2012).
There were insufficient data to report length of hospital stay from date of the intervention to discharge.
Patient acceptability
Two trials reported patient acceptability of the interventions (Demmy 2012, Dresler 2005). Demmy 2012 did not provide raw data by treatment group. There was no difference between talc slurry and poudrage in terms of patients’ perception of convenience in Dresler 2005 (no raw data provided).
The only trial evaluating the agent viscum reported that two of 13 participants in the viscum arm withdrew their consent for ongoing study participation after experiencing allergic reactions to the first dose. The outcomes for these participants were not available and hence the trial deemed them non‐evaluable.
Discussion
Summary of main results
The management of MPE has long been subject to debate and research. This systematic review of the current literature attempts to combine all the available randomised evidence regarding the wide variety of interventions for the condition.
Our primary outcome measure was pleurodesis efficacy. Our analysis showed that talc poudrage ranked highly compared with other agents. It has an estimated rank of second of 16 interventions (95% Cr‐I 1 to 5) and there was good evidence (robust to exclusion of higher risk of bias studies) for it being better than seven other pleurodesis methods including bleomycin and tetracycline. There was also some evidence in the full network for it being more efficacious than talc Slurry and doxycyline but this evidence was considerably weakened when the analysis was restricted to only lower risk of bias studies. Uncertainty around the relative efficacy of talc poudrage compared to some other agents is also exacerbated by the relatively high degree of unexplained heterogeneity within the networks and some loop‐specific inconsistencies. The presently recruiting TAPPS trial, comparing talc poudrage with talc slurry will add further data to this comparison in the future (TAPPS), which may add further clarity regarding these conclusions.
The relative efficacy of the other methods examined in terms of pleurodesis success is also inconclusive. A number of agents appeared to be of comparable efficacy, both within the main network and in the sensitivity analysis, in which we looked only at agents used for bedside pleurodesis. This may be because the agents are truly equivalent in their ability to induce a pleurodesis, however these findings could equally reflect lack of evidence to date (statistical imprecision).
All the comparisons showed a substantial degree of both statistical and clinical heterogeneity. Aside from the analysis restricted to studies at lower risk of bias, which did appear to reduce the degree of heterogeneity somewhat, the other sensitivity analyses, selected on the basis of factors hypothesised to be clinical effect modifiers, did not appear to explain the high level of heterogeneity, since estimates of the between‐study standard deviation remained very high. This signifies the complexity of this condition and the treatments, which results in substantial clinical heterogeneity. Possible explanations include different effects of varying tumour subtypes, early lung entrapment, which is not clinically detectable, varying drug doses and subtle procedural factors in terms of the pleurodesis technique such as adequacy of pleural fluid drainage prior to instillation of the sclerosant.
The available data for the secondary outcomes evaluated were more restricted. The network provided some evidence that mepacrine and C. parvum cause more fever than several other agents, however this network had very high unexplained heterogeneity and loop‐specific inconsistency. Only two direct comparisons and one from the network meta‐analysis found evidence of a difference in mortality between treatment groups.
The studies comparing IPC and talc slurry suggested those with an IPC experienced less dyspnoea, although we note the ongoing AMPLE study may add further data regarding this in the future (AMPLE Trial). There were insufficient data to formally analyse the other secondary outcome measures.
Although there were insufficient data to perform meta‐analysis, we also evaluated a number of techniques that could improve the effectiveness of pleurodesis if the agent was delivered via a chest tube. There was a lack of evidence either way regarding the effect of the duration of drainage pre‐ or post‐sclerosant administration, chest tube size, use of fibrinolytics and patient rotation on pleurodesis failure rate. There are a number of ongoing studies which will add further information regarding these factors in the future (TIME‐1; TIME‐3).
Overall completeness and applicability of evidence
This is the largest systematic review of the evidence surrounding interventions in MPE in the published literature. We used robust search strategies to identify all the available randomised evidence and have diligently contacted the study authors regarding missing data where possible.
However, despite this, we had to exclude a number of studies due to insufficient availability of study data. During the process of selecting studies for inclusion in this review, we identified a number of conference abstracts. Given the paucity of data contained in them, we did not feel it valid to include them without obtaining more detailed information. Despite attempting to contact the study authors, in 34 cases we could not obtain additional unpublished data and hence excluded the studies, suggesting the potential for publication bias, which could affect the validity of the results. The small number of studies for each pair‐wise comparison (maximum of five), meant funnel plots would not be informative (Sterne 2011). As the interventions could not be logically ordered, we also decided a comparison‐adjusted funnel plot for the network was not valid (Salanti 2014).
A number of the studies included in this review had very small numbers of participants, which raises the possibility of small study effects which may have resulted in an overestimation of treatment efficacy. Only five of the included studies had outcome data for more than 100 patients (Davies 2012; Dresler 2005; Rintoul 2014; Sartori 2004; Yoshida 2007). However, sensitivity analysis for the direct evidence using random‐ and fixed‐effect models did not show any meaningful differences.
When evaluating different pleurodesis agents, we elected to combine different doses of each agent from the available studies for the purposes of comparison. This was necessary due to variation in the doses between studies, which would have made the network extremely complex. This is a limitation of our review, since differential treatment effects according to doses could have been missed. This is one possible explanation for the high levels of heterogeneity observed in our study, which we were unable to investigate further due to the complexity of the data. One included study was designed to compare different doses of silver nitrate and this revealed no difference in terms of pleurodesis efficacy or adverse events Terra 2015).
Many of the included studies failed to assess patient quality of life, symptom control, acceptability of the intervention to the patient, length of stay and costs. Although these were secondary objectives of our review, they are important factors when selecting management strategies and hence limit the applicability of the evidence from this review to everyday clinical practice. This may be particularly important when considering the potential benefits of IPCs which, despite having a lower pleurodesis rate, may be comparable to talc slurry in terms of control of breathlessness (Davies 2012; Demmy 2012) and may be more acceptable to certain patients due to the shorter length of hospital stay.
It is also important to consider the global availability of some of these agents, when considering the clinical applicability of our findings. In a survey of five English speaking countries, the most commonly used pleurodesis agents were talc poudrage, talc slurry, tetracycline, doxycycline and bleomycin (Lee 2003). Parenteral tetracycline derivatives and C. parvum are not widely available, which precludes their routine use. Other agents included in this review are unlicensed for use as a pleurodesis agent.
Our data regarding the adverse effects of these treatments are limited. As we have selected only RCTs for inclusion in this review, there is the potential that rare but important side effects were missed using our methodology. There are reports of adverse effects of pleurodesis agents resulting from absorption of the agent into the systemic circulation. For example, systemic absorption of mixed particle size talc is thought to be linked to rare but occasionally life‐threatening acute respiratory distress syndrome (ARDS), a risk which is minimised by the use of graded (large particle) talc (Maskell 2004). Mepacrine gained popularity in Scandinavia as a pleurodesis agent, although rare psychotic episodes and seizures, thought to be related to systemic absorption if administered at high doses, limited its use (Bjorkman 1989).
We have only managed to synthesise the data on the main adverse events and so we cannot reliably infer the full side effect profiles of these treatments from this review. An appreciation of the side effect profile of these interventions is vital when weighing up the risks and benefits of the procedures, particularly as many of the patients in this population have a limited life expectancy and hence limiting discomfort during their remaining time is imperative.
Pleurodesis success is one important factor in the successful management of MPE, but may not be the ‘be all and end all’. The definition of pleurodesis efficacy varied between studies, with many studies relying on radiology alone, which is increasingly felt to be inadequate without taking into account symptom recurrence as well. Many patients would rather avoid a hospital admission and be treated as an outpatient which may make use of an indwelling pleural catheter more appealing than a chemical pleurodesis. Moreover, those with a particularly poor prognosis may prefer to be symptomatically treated with a simple thoracentesis and optimal symptom control and avoid more invasive procedures. It was not possible to incorporate these subjective factors into the review process, but they are clearly a crucial element of clinical decision making in this population. Therefore, the ‘best’ approach may not be the same for all patient groups; a question we have not been able to adequately address in this review.
Quality of the evidence
The risk of bias in a number of the included studies is substantial. The vast majority of studies were unblinded, which in part reflects the nature of the interventions being randomised but also the symptom‐based nature of the endpoints measured, precluding blinding of the outcome reporting as well. Documentation of the methods used for sequence generation and allocation concealment were frequently omitted and it was often not possible to obtain this information retrospectively. The sensitivity analysis evaluating only the studies with a lower risk of bias, showed the heterogeneity estimate was reduced in this subgroup, and the overall rankings of most interventions were relatively robust.
There was also variation in the methods used by the different studies to determine pleurodesis failure, in terms of the definition, how patient attrition was handled and the time point at which it was assessed. We did state how this would be handled a priori, using hierarchies of preferences, however these factors may have impacted on the results of the final meta‐analysis.
Given the inevitable death of patients in this palliative population, true intention‐to‐treat analysis was often not performed, resulting in the potential for attrition bias. These missing data were handled differently by the various included studies. Some studies included patients on the basis of their ‘last observation carried forward’ (i.e. their last outcome prior to death) and others excluded these patients from the analysis completely. No studies used other imputation methods to account for these missing data.
The majority of the studies reported the main outcome measures of pleurodesis success, side effects and mortality. However, in a palliative population such as this, patient‐focused outcomes, such as quality of life, symptom control, length of hospital stay and patient acceptability provide valuable, clinically relevant information, but were inconsistently reported in the included studies, precluding robust synthesis. The newer, suitably powered RCTs will report these important outcomes and hence future revisions of this review will hopefully be able to incorporate them into their findings.
We have not reported the Grading of Recommendations, Assessment, Development and Evaluations (GRADE) for our findings in this review and did not state in our protocol that we would. The role of GRADE is not well established in the context of Network Meta‐analysis (NMA) and the approach to how it should be implemented is still a subject of debate (Puhan 2014, Salanti 2014). We felt its inclusion would be highly complex and the results extremely subjective and hence elected not to incorporate it.
Potential biases in the review process
This review is based on the available published evidence and not on individual patient data, which would give a more accurate estimation of treatment effect and a clearer understanding of the heterogeneity (Deeks 2011). However, as several of the studies were published many years ago and individual patient information was therefore not available, patient level meta‐analysis would not be possible without excluding the majority of the available evidence.
In order to allow inclusion of as many eligible studies as possible, we combined data obtained using different definitions of pleurodesis failure and timings in the same analysis. We pre‐defined the methodology for this in the protocol using hierarchies of preferences. We performed sensitivity analyses to ensure the results were robust.
A potential source of bias in our primary outcome measure, pleurodesis efficacy, is the inevitable patient attrition due to mortality reported in many studies. If there had been real differences in mortality (and therefore drop out) across the interventions, this could bias the estimates of relative pleurodesis failure rates. However, analysis of the data on mortality and median survival times did not reveal evidence of differences in the vast majority of comparisons. Only two of 33 studies reporting overall mortality found a difference between treatment arms, and only one of the 24 studies which reported median survival times found a difference between treatment arms. The network meta‐analysis of the mortality data only found evidence of one potential survival difference in the comparison between tetracycline and mitoxantrone.
Another very important consideration is the high degree of between‐study heterogeneity across our treatment effect estimates. We have attempted to explore heterogeneity using subgroup analyses, but were unable to identify any specific reasons for it. The heterogeneity is likely to be related to a combination of factors related to study quality and the diversity of the methodology used in the included trials.
It should also be noted that the initial screening of titles and abstracts was performed by just one reviewer.
Agreements and disagreements with other studies or reviews
A number of other systematic reviews have been published in this area (Shaw 2004; Tan 2006; Xia 2014). All have presented only direct comparisons, rather than also incorporating indirect comparisons of alternative agents using network meta‐analysis methods. We feel that network meta‐analysis is more valid in this field as the diversity of the control groups used when comparing one agent with ‘all others’ means that important relative treatment effects may be either over or under estimated.
We used robust inclusion and exclusion criteria to identify eligible studies, which resulted in some studies included in other systematic reviews in this field being excluded from this one. These studies have been entered into the ‘Excluded studies’ section of this review, with justifications given for their exclusion. The main reasons were failure to use a truly random process to assign treatment groups and the inclusion of ascites or pericardial fluid accumulation, which could not be differentiated in the results section.
The previously published meta‐analyses have all suggested that talc is the most effective agent and is best delivered thoracoscopically. Our data predominantly supports the use of thoracoscopic talc poudrage as an effective pleurodesis method, although we have found a lack of conclusive evidence to suggest it is more effective than some other methods. The choice of agent given via a chest tube based on our network of evidence is inconclusive, which differs from the conclusions drawn by other systematic reviews in this field . Talc does appear to be effective, although other agents such as mepacrine and C. parvum may be equally good.

Study flow diagram

Risk of bias graph: review authors' judgements about each risk of bias item presented as percentages across all included studies.

Risk of bias summary: review authors' judgements about each risk of bias item for each included study.

Network plot of the pleurodesis efficacy network. The nodes are weighted according to the number of participants randomised to the intervention. The edges (line thicknesses) are weighted according to the number of studies included in each comparison.

Estimated (95% Cr‐I) ranks for each of the pleurodesis methods from the main network

Inconsistency plot for the main network. Treatment codes: 01 = Talc slurry; 02 = Talc poudrage; 03 = Bleomycin; 04 = Tetracycline; 05 = C. parvum; 06 = Interferon; 07 = Iodine; 08 = Indwelling pleural catheter; 09 = Placebo; 10 = Mustine; 11 = Mitoxantrone; 12 = Mepacrine; 13 = Doxycyline; 14 = Triethylenethiophosphoramide; 15 = Adriamycin. Abbreviations: ROR = Ratio of Odds Ratios; 95% CI = 95% Confidence interval. Heterogeneity variance was set at 0.8847 (reflecting the estimation of Tau from the network)

Estimated rank (95% Cr‐I) for causing fever (a low rank suggests less fever)

Comparison 1 Bleomycin, Outcome 1 Pleurodesis failure.
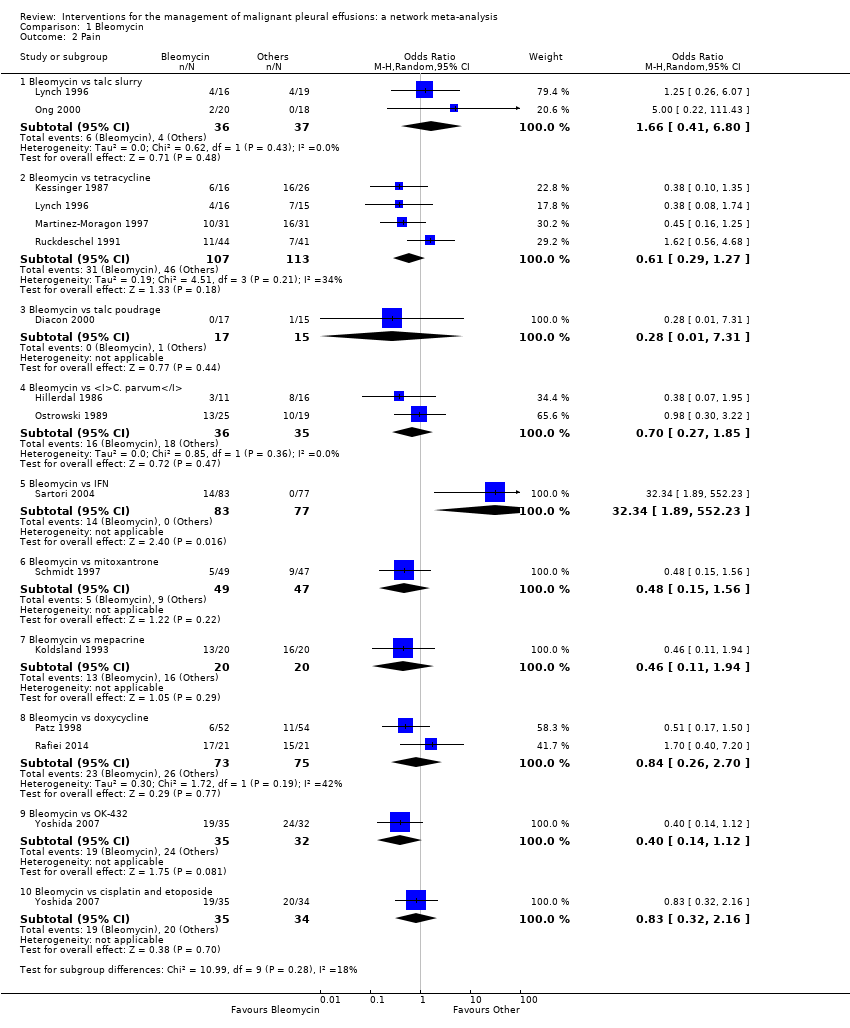
Comparison 1 Bleomycin, Outcome 2 Pain.

Comparison 1 Bleomycin, Outcome 3 Mortality.

Comparison 1 Bleomycin, Outcome 4 Fever.

Comparison 2 Talc slurry, Outcome 1 Pleurodesis failure.

Comparison 2 Talc slurry, Outcome 2 Mortality.

Comparison 2 Talc slurry, Outcome 3 Pain.

Comparison 2 Talc slurry, Outcome 4 Fever.

Comparison 3 Talc poudrage, Outcome 1 Pleurodesis failure.

Comparison 3 Talc poudrage, Outcome 2 Mortality.
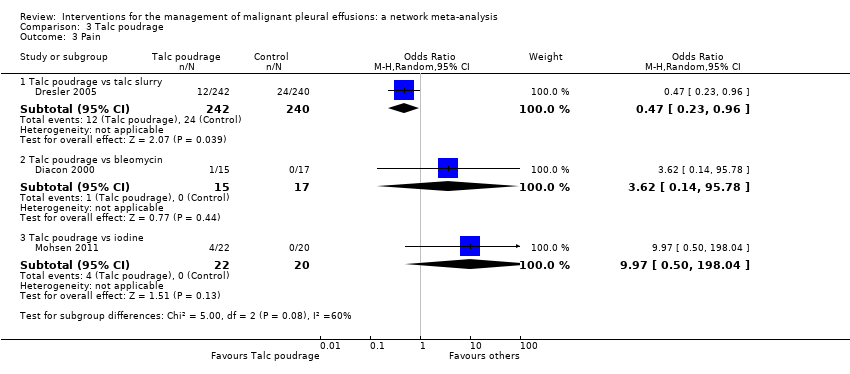
Comparison 3 Talc poudrage, Outcome 3 Pain.

Comparison 3 Talc poudrage, Outcome 4 Fever.
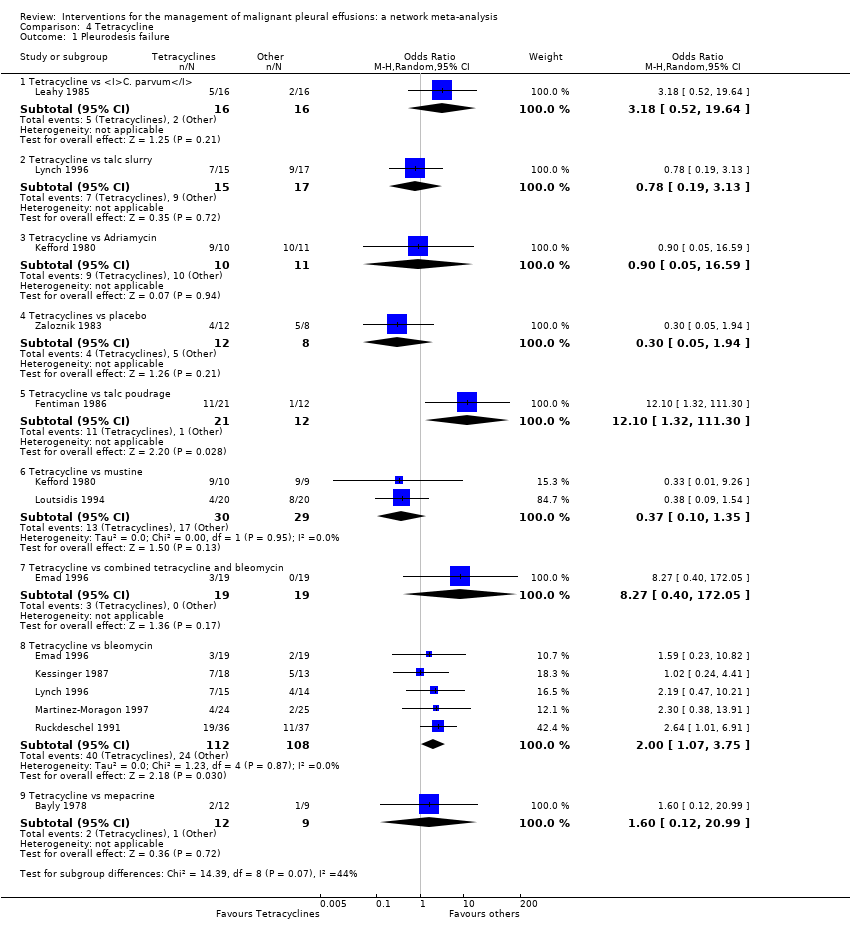
Comparison 4 Tetracycline, Outcome 1 Pleurodesis failure.
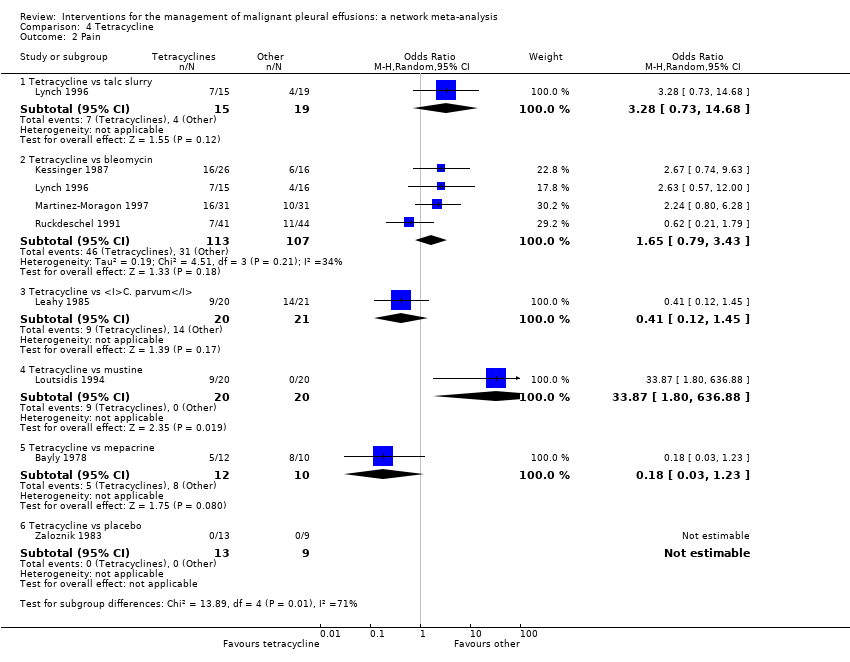
Comparison 4 Tetracycline, Outcome 2 Pain.

Comparison 4 Tetracycline, Outcome 3 Fever.
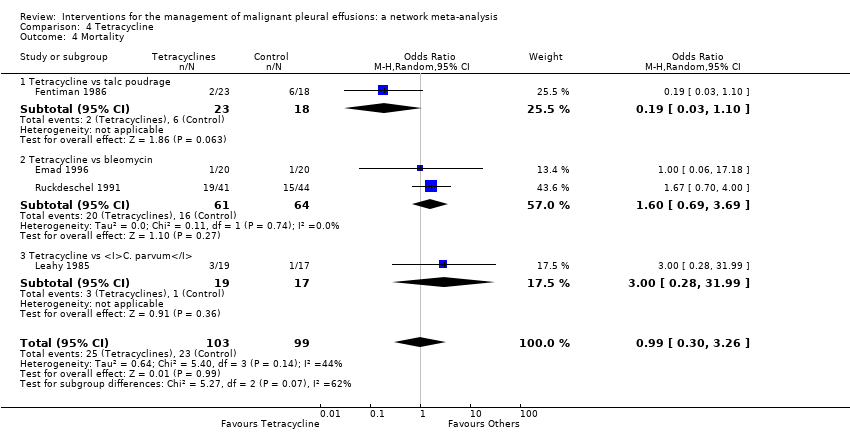
Comparison 4 Tetracycline, Outcome 4 Mortality.

Comparison 5 C. parvum, Outcome 1 Pleurodesis failure.

Comparison 5 C. parvum, Outcome 2 Pain.

Comparison 5 C. parvum, Outcome 3 Fever.

Comparison 5 C. parvum, Outcome 4 Mortality.

Comparison 6 Indwelling pleural catheter (IPC), Outcome 1 Pleurodesis failure.

Comparison 6 Indwelling pleural catheter (IPC), Outcome 2 Mortality.

Comparison 6 Indwelling pleural catheter (IPC), Outcome 3 Pain.

Comparison 7 Iodine, Outcome 1 Pleurodesis failure.

Comparison 7 Iodine, Outcome 2 Fever.

Comparison 7 Iodine, Outcome 3 Mortality.

Comparison 7 Iodine, Outcome 4 Pain.

Comparison 8 Doxycycline, Outcome 1 Pleurodesis failure.

Comparison 8 Doxycycline, Outcome 2 Pain.

Comparison 8 Doxycycline, Outcome 3 Fever.

Comparison 8 Doxycycline, Outcome 4 Mortality.

Comparison 9 Mode of administration, Outcome 1 Pleurodesis failure.

Comparison 10 Duration of drainage after pleurodesis administration, Outcome 1 Pleurodesis failure.

Comparison 10 Duration of drainage after pleurodesis administration, Outcome 2 Mortality.

Comparison 11 OK‐432, Outcome 1 Pleurodesis failure.

Comparison 11 OK‐432, Outcome 2 Pain.

Comparison 11 OK‐432, Outcome 3 Fever.

Comparison 11 OK‐432, Outcome 4 Mortality.

Comparison 12 Mepacrine, Outcome 1 Pain.

Comparison 12 Mepacrine, Outcome 2 Fever.

Comparison 12 Mepacrine, Outcome 3 Pleurodesis failure.

Comparison 12 Mepacrine, Outcome 4 Mortality.

Comparison 13 Interferon (IFN), Outcome 1 Pleurodesis failure.

Comparison 13 Interferon (IFN), Outcome 2 Pain.

Comparison 13 Interferon (IFN), Outcome 3 Fever.

Comparison 13 Interferon (IFN), Outcome 4 Mortality.

Comparison 14 Triethylenethiophophoramide, Outcome 1 Pleurodesis failure.

Comparison 14 Triethylenethiophophoramide, Outcome 2 Pain.
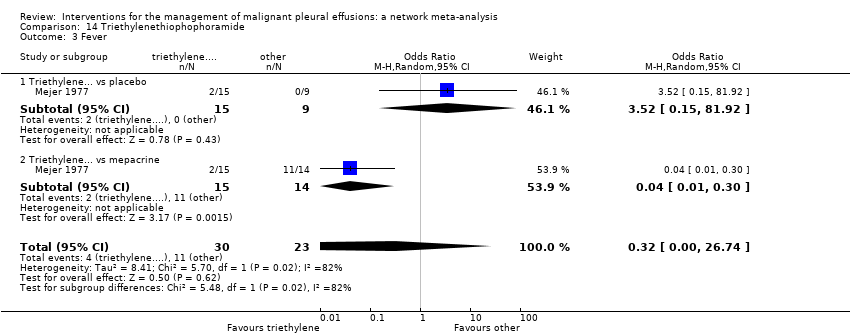
Comparison 14 Triethylenethiophophoramide, Outcome 3 Fever.

Comparison 15 Adriamycin, Outcome 1 Pleurodesis failure.

Comparison 15 Adriamycin, Outcome 2 Fever.

Comparison 15 Adriamycin, Outcome 3 Pain.

Comparison 16 Placebo, Outcome 1 Pleurodesis failure.

Comparison 16 Placebo, Outcome 2 Pain.

Comparison 16 Placebo, Outcome 3 Fever.
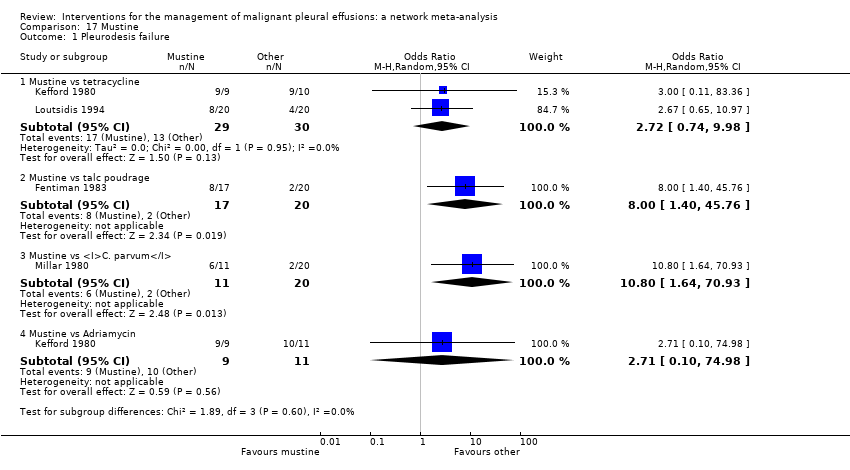
Comparison 17 Mustine, Outcome 1 Pleurodesis failure.

Comparison 17 Mustine, Outcome 2 Fever.

Comparison 17 Mustine, Outcome 3 Mortality.

Comparison 17 Mustine, Outcome 4 Pain.

Comparison 18 Mitoxantrone, Outcome 1 Pleurodesis failure.

Comparison 18 Mitoxantrone, Outcome 2 Pain.

Comparison 18 Mitoxantrone, Outcome 3 Fever.
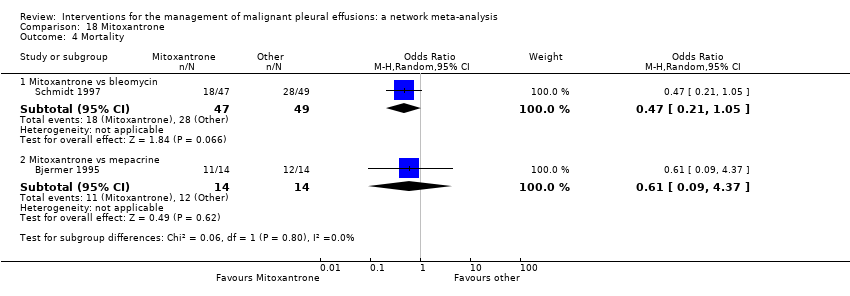
Comparison 18 Mitoxantrone, Outcome 4 Mortality.

Comparison 19 Drain size, Outcome 1 Pleurodesis failure.

Comparison 19 Drain size, Outcome 2 Pain.

Comparison 19 Drain size, Outcome 3 Mortality.

Comparison 20 Thoracoscopic mechanical pleurodesis (TMP), Outcome 1 Pleurodesis failure.

Comparison 20 Thoracoscopic mechanical pleurodesis (TMP), Outcome 2 Mortality.

Comparison 21 Other, Outcome 1 Pleurodesis failure.
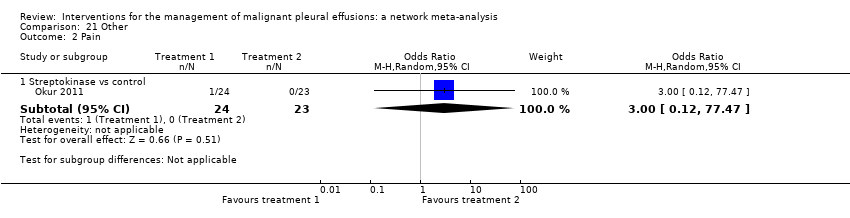
Comparison 21 Other, Outcome 2 Pain.

Comparison 21 Other, Outcome 3 Fever.

Comparison 21 Other, Outcome 4 Mortality.

Comparison 22 Silver nitrate, Outcome 1 Pleurodesis failure.

Comparison 22 Silver nitrate, Outcome 2 Fever.

Comparison 23 Cisplatin, Outcome 1 Pleurodesis failure.

Comparison 23 Cisplatin, Outcome 2 Pain.

Comparison 23 Cisplatin, Outcome 3 Fever.

Comparison 23 Cisplatin, Outcome 4 Mortality.

Comparison 24 Duration of drainage prior to administration of sclerosant, Outcome 1 Pleurodesis failure.

Comparison 25 Dose of silver nitrate, Outcome 1 Pleurodesis failure.

Comparison 25 Dose of silver nitrate, Outcome 2 Mortality.

Comparison 25 Dose of silver nitrate, Outcome 3 Pain.

Comparison 25 Dose of silver nitrate, Outcome 4 Fever.
| Treatment | Talc slurry | Talc poudrage | Bleomycin | Tetracycline | C. parvum | Placebo | Mustine | Mitoxantrone | Mepacrine |
| Talc poudrage | 0.76 (0.54, 1.09); n = 3; Tau2 = 0; I2 = 0% | NA | ‐ | ‐ | ‐ | ‐ | ‐ | ‐ | ‐ |
| Bleomycin | 1.22 (0.55, 2.70); n = 5*; Tau2 = 0.1; I2 = 12% | 9.70 (2.10, 44.78); n = 2; Tau2 = 0; I2= 0% | NA | ‐ | ‐ | ‐ | ‐ | ‐ | ‐ |
| Tetracycline | 0.78 (0.19, 3.13); n = 1* | 12.10 (1.32, 111.30); n = 1 | 2.00 (1.07, 3.75); n = 5*; Tau2 = 0; I2 = 0% | NA | ‐ | ‐ | ‐ | ‐ | ‐ |
| C. parvum | NA | NA | 0.55 (0.01, 57.48); n = 2; Tau2 = 11; I2 = 94% | 0.31 (0.05, 1.94); n = 1 | NA | ‐ | ‐ | ‐ | ‐ |
| Interferon | NA | NA | 3.25 (1.54, 6.89); n = 1 | NA | NA | ‐ | ‐ | ‐ | ‐ |
| Iodine | 0.47 (0.04, 5.71); n = 1 | 1.76 (0.26, 11.83); n = 1 | 1.25 (0.28, 5.59); n = 1 | NA | NA | ‐ | ‐ | ‐ | ‐ |
| Indwelling pleural catheter | 3.35 (1.64, 6.83); n = 2 Tau2 = 0; I2 = 0% | NA | NA | NA | NA | ‐ | ‐ | ‐ | ‐ |
| Placebo | 13.93 (0.66, 293.99); n = 1 | NA | NA | 3.33 (0.51, 21.58); n = 1 | NA | NA | ‐ | ‐ | ‐ |
| Mustine | NA | 8.00 (1.40, 45.76); n = 1 | NA | 2.72 (0.74, 9.98) n = 2*; Tau2= 0; I2= 0% | 3.00 (0.40, 22.71); n = 1 | NA | NA | ‐ | ‐ |
| Mitoxantrone | NA | NA | 3.18 (1.17, 8.65); n = 1 | NA | NA | 0.75 (0.32, 1.79); n = 1 | NA | NA | ‐ |
| Mepacrine | 2.08 (0.62, 6.96); n = 1 | NA | 0.16 (0.03, 0.89); n = 1 | 0.63 (0.05, 8.20); n = 1 | NA | 0.15 (0.03, 0.64); n = 1* | NA | 7.61 (0.35, 163.82); n = 1 | NA |
| Doxycycline | NA | 42.69 (2.13, 856.61); n = 1 | 0.67 (0.24, 1.86); n = 2; Tau2= 0; I2= 0% | NA | 1.91 (0.43, 8.48); n = 1 | NA | NA | NA | NA |
| Triethylenethiophosphoramide | NA | NA | NA | NA | NA | 2.06 (0.43, 9.80); n = 1* | NA | NA | 4.95 (1.02, 24.10); n = 1* |
| Adriamycin | NA | NA | NA | 1.11 (0.06, 20.49); n = 1* | NA | NA | 0.37 (0.01, 10.18); n = 1* | NA | NA |
| n = the number of studies included in the pair‐wise comparison. * Indicates that the comparison included a three‐arm study. NA = no direct pair‐wise comparison available. Results that are statistically significant at the conventional level of P < 0.05 are shaded in grey. ‐ indicates the odds ratio is already expressed elsewhere in the table comparing the interventions the other way around. | |||||||||
| Talc slurry | Talc poudrage | Bleomycin | Tetracycline | C. parvum | Interferon | Iodine | Indwelling pleural catheter | Placebo | Mustine | Mitoxantrone | Mepacrine | Doxycyline | Triethylenethiophosphoramide | viscum | |
| Talc poudrage | 0.42 (0.13, 1.19) | NA | ‐ | ‐ | ‐ | ‐ | ‐ | ‐ | ‐ | ‐ | ‐ | ‐ | ‐ | ‐ | ‐ |
| Bleomycin | 2.56 (1.05, 6.67) | 6.03 (2.19, 20.46) | NA | ‐ | ‐ | ‐ | ‐ | ‐ | ‐ | ‐ | ‐ | ‐ | ‐ | ‐ | ‐ |
| Tetracycline | 3.71 (1.22, 11.67) | 8.77 (2.74, 33.01) | 1.45 (0.59, 3.46) | NA | ‐ | ‐ | ‐ | ‐ | ‐ | ‐ | ‐ | ‐ | ‐ | ‐ | ‐ |
| C. parvum | 1.48 (0.34, 6.57) | 3.49 (0.79, 17.64) | 0.58 (0.16, 1.95) | 0.40 (0.10, 1.52) | NA | ‐ | ‐ | ‐ | ‐ | ‐ | ‐ | ‐ | ‐ | ‐ | ‐ |
| Interferon | 8.49 (0.94, 82.98) | 19.96 (2.22, 229.60) | 3.33 (0.43, 25.66) | 2.29 (0.26, 21.65) | 5.75 (0.55, 64.16) | NA | ‐ | ‐ | ‐ | ‐ | ‐ | ‐ | ‐ | ‐ | ‐ |
| Iodine | 1.25 (0.22, 6.77) | 2.97 (0.55, 17.21) | 0.49 (0.09, 2.49) | 0.34 (0.05, 2.04) | 0.85 (0.11, 6.35) | 0.15 (0.01, 1.90) | NA | ‐ | ‐ | ‐ | ‐ | ‐ | ‐ | ‐ | ‐ |
| Indwelling pleural catheter | 3.47 (0.75, 16.46) | 8.19 (1.32, 59.02) | 1.36 (0.22, 8.01) | 0.94 (0.14, 6.27) | 2.36 (0.28, 19.88) | 0.41 (0.03, 5.96) | 2.76 (0.29, 28.48) | NA | ‐ | ‐ | ‐ | ‐ | ‐ | ‐ | ‐ |
| Placebo | 19.50 (3.73, 128.50) | 46.51 (7.86, 375.90) | 7.64 (1.55, 44.22) | 5.29 (1.04, 31.95) | 13.28 (1.91, 110.80) | 2.29 (0.18, 34.14) | 15.63 (1.72, 179.10) | 5.61 (0.59, 65.18) | NA | ‐ | ‐ | ‐ | ‐ | ‐ | ‐ |
| Mustine | 7.50 (1.35, 43.86) | 17.75 (3.59, 105.70) | 2.94 (0.58, 14.84) | 2.02 (0.43, 9.79) | 5.07 (0.91, 29.81) | 0.88 (0.06, 11.71) | 5.98 (0.68, 58.17) | 2.16 (0.22, 22.76) | 0.38 (0.04, 3.32) | NA | ‐ | ‐ | ‐ | ‐ | ‐ |
| Mitoxantrone | 12.87 (2.36, 89.02) | 30.53 (5.11, 259.50) | 5.04 (1.04, 28.67) | 3.48 (0.64, 22.72) | 8.76 (1.24, 73.66) | 1.51 (0.12, 22.89) | 10.28 (1.12, 119.70) | 3.71 (0.38, 44.85) | 0.66 (0.13, 3.52) | 1.73 (0.19, 17.80 | NA | ‐ | ‐ | ‐ | ‐ |
| Mepacrine | 0.98 (0.22, 4.15) | 2.32 (0.45, 12.99) | 0.38 (0.09, 1.52) | 0.27 (0.05, 1.17) | 0.67 (0.10, 4.06) | 0.12 (0.01, 1.31) | 0.78 (0.09, 6.55) | 0.28 (0.03, 2.32) | 0.05 (0.01, 0.28) | 0.13 (0.02, 0.99) | 0.08 (0.01, 0.47) | NA | ‐ | ‐ | ‐ |
| Doxycycline | 3.49 (0.68, 19.56) | 8.23 (1.70, 50.18) | 1.37 (0.31, 6.09) | 0.94 (0.18, 5.09) | 2.36 (0.46, 13.09) | 0.41 (0.03, 5.14) | 2.78 (0.33, 26.50) | 1.00 (0.11, 10.23) | 0.18 (0.02, 1.53) | 0.47 (0.06, 3.77) | 0.27 (0.03, 2.31) | 3.56 (0.50, 28.59) | NA | ‐ | ‐ |
| Triethylenethiophosphoramide | 5.53 (0.40, 80.97) | 13.07 (0.89, 227.30) | 2.16 (0.16, 29.77) | 1.50 (0.10, 21.61) | 3.74 (0.21, 66.99) | 0.65 (0.02, 17.63) | 4.40 (0.22, 98.58) | 1.59 (0.08, 35.28) | 0.28 (0.02, 3.62) | 0.74 (0.04, 15.00) | 0.43 (0.02, 6.80) | 5.60 (0.55, 63.81) | 1.59 (0.08, 31.05) | NA | ‐ |
| Adriamycin | 2.31 (0.03, 165.40) | 5.53 (0.08, 403.50) | 0.90 (0.01, 59.43) | 0.62 (0.01, 38.58) | 1.57 (0.02, 114.20) | 0.27 (0.00, 27.43) | 1.85 (0.02, 162.70) | 0.67 (0.01, 62.01) | 0.12 (0.00, 9.46) | 0.31 (0.00, 20.50) | 0.18 (0.00, 14.59) | 2.36 (0.03, 191.30) | 0.66 (0.01, 52.71) | 0.42 (0.00, 54.35) | NA |
| Viscum | 0.39 (0.01, 8.23) | 0.92 (0.03, 21.77) | 0.15 (0.01, 2.73) | 0.10 (0.00, 2.17) | 0.26 (0.01, 6.21) | 0.04 (0.00, 1.55) | 0.31 (0.01, 9.07) | 0.11 (0.00, 3.44) | 0.02 (0.00, 0.53) | 0.05 (0.00, 1.41) | 0.03 (0.00, 0.79) | 0.39 (0.01, 10.28) | 0.11 (0.00, 2.83) | 0.07 (0.00, 3.48) | 0.16 (0.00, 26.60) |
| Results that are statistically significant at the conventional level of P < 0.05 are shaded in grey. ‐ indicates the odds ratio is already expressed elsewhere in the table comparing the interventions the other way around. NA= not applicable. | |||||||||||||||
| Study | Reason study excluded from network | Intrapleural agent or intervention 1 | Pleurodesis failure rate for agent 1 | Intrapleural agent or intervention 2 | Pleurodesis failure rate for agent 2 | OR (95% CI) of agent 1 compared with agent 2*** |
| Du 2013 | Lung cancer specific therapy | Cisplatin and bevacizumab | 6/36 | Cisplatin | 17/34 | 0.20 (0.07, 0.60) |
| Emad 1996* | No pleurodesis failures in the Combined group | Tetracycline** | 3/19 | Combined tetracycline and bleomycin | 0/19 | 8.27 (0.40, 172.05) |
| Bleomycin** | 2/19 | Combined tetracycline and bleomycin | 0/19 | 5.57 (0.25, 124.19) | ||
| Ishida 2006* | Lung cancer specific therapy | OK‐432 | 8/17 | Cisplatin | 11/17 | 0.48 (0.12, 1.92) |
| OK‐432 | 8/17 | OK‐432 and cisplatin | 1/15 | 12.44 (1.32, 117.03) | ||
| Cisplatin | 11/17 | OK‐432 and cisplatin | 1/15 | 25.67 (2.68, 245.84) | ||
| Kasahara 2006 | Lung cancer specific therapy | High dose OK‐432 | 5/19 | Low dose OK‐432 | 3/19 | 1.90 (0.38, 9.44) |
| Luh 1992 | Lung cancer specific therapy | OK‐432 | 3/26 | Mitomycin C | 9/27 | 0.26 (0.06, 1.11) |
| Maskell 2004 | Two Talc slurry preparations | Mixed particle talc | 3/14 | Graded talc (particles >20µm) | 2/14 | 1.64 (0.23, 11.70)) |
| Masuno 1991 | Lung cancer specific therapy | LC9018 and Adriamycin | 10/38 | Adriamycin | 23/38 | 0.23 (0.09, 0.62) |
| Paschoalini 2005 | No pleurodesis failures in Silver Nitrate group | Talc slurry | 1/9 | Silver nitrate | 0/16 | 5.85 (0.21, 158.82) |
| Rintoul 2014 | MPM specific surgical technique | Talc pleurodesis (slurry or poudrage) | 25/62 | VATS pleurectomy | 24/60 | 0.88 (0.43, 1.82) |
| Terra 2015* | Comparison of different doses of Silver Nitrate | 90 mg silver nitrate | 0/20 | 150 mg silver nitrate | 0/20 | not estimable |
| 90 mg silver nitrate | 0/20 | 180 mg silver nitrate | 2/20 | 0.18 (0.01, 4.01) | ||
| 150 mg silver nitrate | 0/20 | 180 mg silver nitrate | 2/20 | 0.19 (0.01, 4.01) | ||
| Yoshida 2007* | Lung cancer specific therapy | OK‐432 | 8/33 | Bleomycin | 11/35 | 0.70 (0.24, 2.03) |
| OK‐432 | 8/33 | Cisplatin and etoposide | 10/34 | 0.77 (0.26, 2.27) | ||
| Bleomycin | 11/35 | Cisplatin and etoposide | 10/34 | 1.10 (0.39, 3.07) | ||
| Zhao 2009 | Lung cancer specific therapy | rAd‐p53 and cisplatin | 3/17 | Cisplatin | 9/18 | 0.21 (0.05, 1.01) |
| *Three‐arm study. **The results for the pair‐wise comparison between tetracycline and bleomycin are included in the network meta‐analysis. ***Results that are statistically significant at the conventional level of P < 0.05 are shaded in grey | ||||||
| Type of method to optimise pleurodesis | Study | Intervention 1 | Pleurodesis failure rate for intervention 1 | Intervention 2 | Pleurodesis failure rate for intervention 2 | OR (95% CI) of intervention 1 compared with intervention 2* |
| Mode of administration | Evans 1993 | Tetracycline pleurodesis at the end of thoracoscopy | 2/15 | Tetracycline pleurodesis through an intercostal cannula | 5/14 | 0.28 (0.04, 1.76) |
| Chest tube size | Clementsen 1998 | Small‐bore chest drain | 2/9 | Large‐bore chest drain | 3/9 | 0.57 (0.07, 4.64) |
| Patient rotation | Mager 2002 | Rotation after instillation of talc | 2/10 | No rotation after instillation of talc | 1/10 | 2.25 (0.17, 29.77) |
| Duration of drainage after administration of the sclerosant | Goodman 2006 | Drain removed 24 hours after pleurodesis | 2/16 | Drain removed 72 hours after pleurodesis | 4/19 | 0.54 (0.08, 3.40) |
| Villanueva 1994 | Drain removal the day after pleurodesis | 2/9 | Drain removal when < 150 ml/day output | 3/15 | 1.14 (0.15, 8.59) | |
| Yildirim 2005 | Fractionated dose oxytetracycline (4 divided doses at 6‐hourly intervals) | 0/12 | Single bedside instillation of oxytetracycline | 2/8 | 0.10 (0.00, 2.50) | |
| Duration of drainage prior to administration of the sclerosant | Ozkul 2014 | Early instillation of talc slurry after drain insertion | 5/40 | Instillation of talc slurry when daily drainage from chest tube < 300 ml/day | 6/39 | 0.79 (0.22, 2.82) |
| Intrapleural fibrinolytics | Okur 2011 | Intrapleural streptokinase | 14/19 | No intrapleural streptokinase | 9/16 | 2.18 (0.53, 9.02) |
| Pleural abrasion at thoracoscopy | Crnjac 2004 | Talc slurry | 11/42 | Thoracoscopic mechanical pleurodesis | 6/45 | 2.31 (0.77, 6.93) |
| * Results that are statistically significant at the conventional level of P < 0.05 are shaded in grey | ||||||
| Talc slurry | Talc poudrage | Bleomycin | Tetracycline | C. parvum | Iodine | Mepacrine | Placebo | Mitoxantrone | Doxycycline | |
| Talc poudrage | 0.66 (0.09, 3.98) | NA | ‐ | ‐ | ‐ | ‐ | ‐ | ‐ | ‐ | ‐ |
| Bleomycin | 1.26 (0.24, 6.82) | 1.93 (0.22, 19.42) | NA | ‐ | ‐ | ‐ | ‐ | ‐ | ‐ | ‐ |
| Tetracycline | 0.29 (0.04, 2.09) | 0.45 (0.04, 5.74) | 0.23 (0.06, 0.88) | NA | ‐ | ‐ | ‐ | ‐ | ‐ | ‐ |
| C. parvum | 6.31 (0.61, 70.69) | 9.71 (0.65, 176.70) | 5.01 (0.92, 29.12) | 21.46 (3.10, 175.70) | NA | ‐ | ‐ | ‐ | ‐ | ‐ |
| Iodine | 0.27 (0.02, 3.69) | 0.42 (0.03, 6.09) | 0.21 (0.01, 4.25) | 0.93 (0.03, 23.41) | 0.04 (0.00, 1.29) | NA | ‐ | ‐ | ‐ | ‐ |
| Mepacrine | 4.52 (0.30, 76.00) | 6.95 (0.34, 182.20) | 3.58 (0.40, 36.59) | 15.41 (1.62, 178.80) | 0.71 (0.05, 11.99) | 16.72 (0.43, 831.10) | NA | ‐ | ‐ | ‐ |
| Placebo | 0.06 (0.00, 2.00) | 0.10 (0.00, 4.27) | 0.05 (0.00, 1.08) | 0.22 (0.00, 5.71) | 0.01 (0.00, 0.32) | 0.23 (0.00, 17.55) | 0.01 (0.00, 0.30) | NA | ‐ | ‐ |
| Mitoxantrone | 0.48 (0.02, 10.24) | 0.73 (0.02, 22.95) | 0.38 (0.02, 5.02) | 1.64 (0.07, 29.71) | 0.08 (0.00, 1.60) | 1.75 (0.03, 99.74) | 0.11 (0.00, 2.16) | 7.57 (0.59, 138.80) | NA | ‐ |
| Doxycycline | 0.49 (0.03, 6.13) | 0.75 (0.04, 14.68) | 0.39 (0.05, 2.66) | 1.67 (0.14, 17.22) | 0.08 (0.01, 0.63) | 1.81 (0.05, 69.03) | 0.11 (0.00, 1.93) | 7.69 (0.19, 539.10) | 1.02 (0.04, 33.23) | NA |
| Triethylenephosphoramide | 0.24 (0.00, 17.04) | 0.37 (0.00, 35.93) | 0.19 (0.00, 9.80) | 0.81 (0.02, 47.08) | 0.04 (0.00, 2.63) | 0.88 (0.01, 139.50) | 0.05 (0.00, 1.49) | 3.62 (0.07, 529.40) | 0.49 (0.01, 49.44 | 0.49 (0.01, 45.90) |
| Results that are statistically significant at the conventional level of P < 0.05 are shaded in grey. ‐ indicates the odds ratio is already expressed elsewhere in the table comparing the interventions the other way around. NA= not applicable | ||||||||||
| Outcome or subgroup title | No. of studies | No. of participants | Statistical method | Effect size |
| 1 Pleurodesis failure Show forest plot | 21 | Odds Ratio (M‐H, Random, 95% CI) | Subtotals only | |
| 1.1 Bleomycin vs iodine | 1 | 39 | Odds Ratio (M‐H, Random, 95% CI) | 0.8 [0.18, 3.57] |
| 1.2 Bleomycin vs talc slurry | 5 | 199 | Odds Ratio (M‐H, Random, 95% CI) | 1.22 [0.55, 2.70] |
| 1.3 Bleomycin vs tetracycline | 5 | 220 | Odds Ratio (M‐H, Random, 95% CI) | 0.50 [0.27, 0.93] |
| 1.4 Bleomycin vs talc poudrage | 2 | 57 | Odds Ratio (M‐H, Random, 95% CI) | 9.70 [2.10, 44.78] |
| 1.5 Bleomycin vs C. parvum | 2 | 78 | Odds Ratio (M‐H, Random, 95% CI) | 1.81 [0.02, 189.25] |
| 1.6 Bleomycin vs doxycycline | 2 | 122 | Odds Ratio (M‐H, Random, 95% CI) | 1.50 [0.54, 4.20] |
| 1.7 Bleomycin vs IFN | 1 | 160 | Odds Ratio (M‐H, Random, 95% CI) | 0.31 [0.15, 0.65] |
| 1.8 Bleomycin vs mitoxantrone | 1 | 85 | Odds Ratio (M‐H, Random, 95% CI) | 0.31 [0.12, 0.86] |
| 1.9 Bleomycin vs mepacrine | 1 | 36 | Odds Ratio (M‐H, Random, 95% CI) | 6.40 [1.12, 36.44] |
| 1.10 Bleomycin vs combined tetracycline and bleomycin | 1 | 38 | Odds Ratio (M‐H, Random, 95% CI) | 5.57 [0.25, 124.19] |
| 1.11 Bleomycin vs cisplatin and etoposide | 1 | 69 | Odds Ratio (M‐H, Random, 95% CI) | 1.1 [0.39, 3.07] |
| 1.12 Bleomycin vs OK‐432 | 1 | 68 | Odds Ratio (M‐H, Random, 95% CI) | 1.43 [0.49, 4.17] |
| 1.13 Bleomycin vs viscum | 1 | 17 | Odds Ratio (M‐H, Random, 95% CI) | 5.33 [0.62, 45.99] |
| 2 Pain Show forest plot | 14 | Odds Ratio (M‐H, Random, 95% CI) | Subtotals only | |
| 2.1 Bleomycin vs talc slurry | 2 | 73 | Odds Ratio (M‐H, Random, 95% CI) | 1.66 [0.41, 6.80] |
| 2.2 Bleomycin vs tetracycline | 4 | 220 | Odds Ratio (M‐H, Random, 95% CI) | 0.61 [0.29, 1.27] |
| 2.3 Bleomycin vs talc poudrage | 1 | 32 | Odds Ratio (M‐H, Random, 95% CI) | 0.28 [0.01, 7.31] |
| 2.4 Bleomycin vs C. parvum | 2 | 71 | Odds Ratio (M‐H, Random, 95% CI) | 0.70 [0.27, 1.85] |
| 2.5 Bleomycin vs IFN | 1 | 160 | Odds Ratio (M‐H, Random, 95% CI) | 32.34 [1.89, 552.23] |
| 2.6 Bleomycin vs mitoxantrone | 1 | 96 | Odds Ratio (M‐H, Random, 95% CI) | 0.48 [0.15, 1.56] |
| 2.7 Bleomycin vs mepacrine | 1 | 40 | Odds Ratio (M‐H, Random, 95% CI) | 0.46 [0.11, 1.94] |
| 2.8 Bleomycin vs doxycycline | 2 | 148 | Odds Ratio (M‐H, Random, 95% CI) | 0.84 [0.26, 2.70] |
| 2.9 Bleomycin vs OK‐432 | 1 | 67 | Odds Ratio (M‐H, Random, 95% CI) | 0.40 [0.14, 1.12] |
| 2.10 Bleomycin vs cisplatin and etoposide | 1 | 69 | Odds Ratio (M‐H, Random, 95% CI) | 0.83 [0.32, 2.16] |
| 3 Mortality Show forest plot | 11 | Odds Ratio (M‐H, Random, 95% CI) | Subtotals only | |
| 3.1 Bleomycin vs combined tetracycline and bleomycin | 1 | 40 | Odds Ratio (M‐H, Random, 95% CI) | 1.0 [0.06, 17.18] |
| 3.2 Bleomycin vs talc slurry | 2 | 116 | Odds Ratio (M‐H, Random, 95% CI) | 0.89 [0.29, 2.75] |
| 3.3 Bleomycin vs tetracycline | 2 | 125 | Odds Ratio (M‐H, Random, 95% CI) | 0.63 [0.27, 1.44] |
| 3.4 Bleomycin vs talc poudrage | 1 | 32 | Odds Ratio (M‐H, Random, 95% CI) | 0.82 [0.20, 3.43] |
| 3.5 Bleomycin vs C. parvum | 1 | 55 | Odds Ratio (M‐H, Random, 95% CI) | 0.60 [0.19, 1.94] |
| 3.6 Bleomycin vs IFN | 1 | 160 | Odds Ratio (M‐H, Random, 95% CI) | 0.46 [0.25, 0.87] |
| 3.7 Bleomycin vs mitoxantrone | 1 | 96 | Odds Ratio (M‐H, Random, 95% CI) | 2.15 [0.95, 4.86] |
| 3.8 Bleomycin vs OK‐432 | 1 | 68 | Odds Ratio (M‐H, Random, 95% CI) | 2.66 [0.98, 7.23] |
| 3.9 Bleomycin vs doxycycline | 2 | 122 | Odds Ratio (M‐H, Random, 95% CI) | 1.44 [0.53, 3.90] |
| 3.10 Bleomycin vs cisplatin and etoposide | 1 | 69 | Odds Ratio (M‐H, Random, 95% CI) | 2.22 [0.82, 6.01] |
| 4 Fever Show forest plot | 16 | Odds Ratio (M‐H, Random, 95% CI) | Subtotals only | |
| 4.1 Bleomycin vs talc Slurry | 3 | 99 | Odds Ratio (M‐H, Random, 95% CI) | 0.90 [0.31, 2.56] |
| 4.2 Bleomycin vs talc poudrage | 1 | 32 | Odds Ratio (M‐H, Random, 95% CI) | 0.87 [0.11, 7.05] |
| 4.3 Bleomycin vs tetracycline | 5 | 250 | Odds Ratio (M‐H, Random, 95% CI) | 2.05 [0.67, 6.34] |
| 4.4 Tetracycline vs C. parvum | 2 | 80 | Odds Ratio (M‐H, Random, 95% CI) | 0.43 [0.17, 1.12] |
| 4.5 Bleomycin vs IFN | 1 | 160 | Odds Ratio (M‐H, Random, 95% CI) | 151.35 [9.08, 2522.62] |
| 4.6 Bleomycin vs mitoxantrone | 1 | 96 | Odds Ratio (M‐H, Random, 95% CI) | 1.11 [0.37, 3.36] |
| 4.7 Bleomycin vs mepacrine | 1 | 40 | Odds Ratio (M‐H, Random, 95% CI) | 0.52 [0.14, 1.92] |
| 4.8 Bleomycin vs doxycycline | 2 | 148 | Odds Ratio (M‐H, Random, 95% CI) | 2.69 [0.08, 89.51] |
| 4.9 Bleomycin vs combined tetracycline and bleomycin | 1 | 40 | Odds Ratio (M‐H, Random, 95% CI) | 0.47 [0.04, 5.69] |
| 4.10 Bleomycin vs OK432 | 1 | 67 | Odds Ratio (M‐H, Random, 95% CI) | 0.7 [0.23, 2.13] |
| 4.11 Bleomycin vs cisplatin and etoposide | 1 | 69 | Odds Ratio (M‐H, Random, 95% CI) | 2.22 [0.82, 6.01] |
| Outcome or subgroup title | No. of studies | No. of participants | Statistical method | Effect size |
| 1 Pleurodesis failure Show forest plot | 15 | Odds Ratio (M‐H, Random, 95% CI) | Subtotals only | |
| 1.1 Talc slurry vs talc poudrage | 3 | 599 | Odds Ratio (M‐H, Random, 95% CI) | 1.31 [0.92, 1.85] |
| 1.2 Talc slurry vs bleomycin | 5 | 199 | Odds Ratio (M‐H, Random, 95% CI) | 0.82 [0.37, 1.82] |
| 1.3 Talc slurry vs IPC | 2 | 160 | Odds Ratio (M‐H, Random, 95% CI) | 0.30 [0.15, 0.61] |
| 1.4 Talc slurry vs mepacrine | 1 | 89 | Odds Ratio (M‐H, Random, 95% CI) | 0.48 [0.14, 1.60] |
| 1.5 Talc slurry vs placebo | 1 | 21 | Odds Ratio (M‐H, Random, 95% CI) | 0.07 [0.00, 1.51] |
| 1.6 Talc slurry vs iodine | 1 | 36 | Odds Ratio (M‐H, Random, 95% CI) | 2.13 [0.18, 25.78] |
| 1.7 Talc slurry vs tetracycline | 1 | 32 | Odds Ratio (M‐H, Random, 95% CI) | 1.29 [0.32, 5.17] |
| 1.8 Talc slurry vs silver nitrate | 1 | 25 | Odds Ratio (M‐H, Random, 95% CI) | 5.82 [0.21, 158.82] |
| 1.9 Talc slurry vs TMP | 1 | 87 | Odds Ratio (M‐H, Random, 95% CI) | 2.31 [0.77, 6.93] |
| 2 Mortality Show forest plot | 9 | Odds Ratio (M‐H, Random, 95% CI) | Subtotals only | |
| 2.1 Talc slurry vs talc poudrage | 2 | 397 | Odds Ratio (M‐H, Random, 95% CI) | 0.98 [0.33, 2.85] |
| 2.2 Talc slurry vs bleomycin | 2 | 116 | Odds Ratio (M‐H, Random, 95% CI) | 1.12 [0.36, 3.46] |
| 2.3 Talc slurry vs iodine | 1 | 36 | Odds Ratio (M‐H, Random, 95% CI) | 0.0 [0.0, 0.0] |
| 2.4 Talc slurry vs IPC | 2 | 163 | Odds Ratio (M‐H, Random, 95% CI) | 0.97 [0.45, 2.10] |
| 2.5 Talc slurry vs mepacrine | 1 | 89 | Odds Ratio (M‐H, Random, 95% CI) | 1.88 [0.70, 5.02] |
| 2.6 Talc slurry vs TMP | 1 | 87 | Odds Ratio (M‐H, Random, 95% CI) | 10.64 [0.55, 203.85] |
| 3 Pain Show forest plot | 7 | Odds Ratio (M‐H, Random, 95% CI) | Subtotals only | |
| 3.1 Talc slurry vs bleomycin | 3 | 99 | Odds Ratio (M‐H, Random, 95% CI) | 0.60 [0.15, 2.46] |
| 3.2 Talc slurry vs talc poudrage | 1 | 482 | Odds Ratio (M‐H, Random, 95% CI) | 2.13 [1.04, 4.36] |
| 3.3 Talc slurry vs tetracycline | 1 | 34 | Odds Ratio (M‐H, Random, 95% CI) | 0.30 [0.07, 1.36] |
| 3.4 Talc slurry vs iodine | 1 | 36 | Odds Ratio (M‐H, Random, 95% CI) | 0.0 [0.0, 0.0] |
| 3.5 Talc slurry vs IPC | 1 | 57 | Odds Ratio (M‐H, Random, 95% CI) | 0.31 [0.01, 7.95] |
| 3.6 Talc slurry vs placebo | 1 | 31 | Odds Ratio (M‐H, Random, 95% CI) | 0.0 [0.0, 0.0] |
| 4 Fever Show forest plot | 7 | Odds Ratio (M‐H, Random, 95% CI) | Subtotals only | |
| 4.1 Talc slurry vs talc poudrage | 2 | 479 | Odds Ratio (M‐H, Random, 95% CI) | 1.65 [0.42, 6.48] |
| 4.2 Talc slurry vs bleomycin | 3 | 98 | Odds Ratio (M‐H, Random, 95% CI) | 0.95 [0.36, 2.51] |
| 4.3 Talc slurry vs tetracycline | 1 | 34 | Odds Ratio (M‐H, Random, 95% CI) | 1.09 [0.28, 4.32] |
| 4.4 Talc slurry vs iodine | 1 | 36 | Odds Ratio (M‐H, Random, 95% CI) | 1.6 [0.23, 10.94] |
| 4.5 Talc slurry vs silver nitrate | 1 | 60 | Odds Ratio (M‐H, Random, 95% CI) | 0.7 [0.15, 3.24] |
| Outcome or subgroup title | No. of studies | No. of participants | Statistical method | Effect size |
| 1 Pleurodesis failure Show forest plot | 9 | Odds Ratio (M‐H, Fixed, 95% CI) | Subtotals only | |
| 1.1 Talc poudrage vs talc slurry | 3 | 599 | Odds Ratio (M‐H, Fixed, 95% CI) | 0.77 [0.54, 1.09] |
| 1.2 Talc poudrage vs bleomycin | 2 | 57 | Odds Ratio (M‐H, Fixed, 95% CI) | 0.10 [0.02, 0.48] |
| 1.3 Talc poudrage vs tetracycline | 1 | 33 | Odds Ratio (M‐H, Fixed, 95% CI) | 0.08 [0.01, 0.76] |
| 1.4 Talc poudrage vs iodine | 1 | 42 | Odds Ratio (M‐H, Fixed, 95% CI) | 0.57 [0.08, 3.80] |
| 1.5 Talc poudrage vs mustine | 1 | 37 | Odds Ratio (M‐H, Fixed, 95% CI) | 0.13 [0.02, 0.71] |
| 1.6 Talc poudrage vs doxycycline | 1 | 31 | Odds Ratio (M‐H, Fixed, 95% CI) | 0.02 [0.00, 0.47] |
| 2 Mortality Show forest plot | 6 | Odds Ratio (M‐H, Random, 95% CI) | Subtotals only | |
| 2.1 Talc poudrage vs talc slurry | 2 | 397 | Odds Ratio (M‐H, Random, 95% CI) | 1.02 [0.35, 3.00] |
| 2.2 Talc poudrage vs bleomycin | 1 | 32 | Odds Ratio (M‐H, Random, 95% CI) | 1.22 [0.29, 5.13] |
| 2.3 Talc poudrage vs tetracycline | 1 | 41 | Odds Ratio (M‐H, Random, 95% CI) | 5.25 [0.91, 30.22] |
| 2.4 Talc poudrage vs iodine | 1 | 42 | Odds Ratio (M‐H, Random, 95% CI) | 2.64 [0.58, 12.09] |
| 2.5 Talc poudrage vs mustine | 1 | 46 | Odds Ratio (M‐H, Random, 95% CI) | 0.43 [0.09, 1.96] |
| 3 Pain Show forest plot | 3 | Odds Ratio (M‐H, Random, 95% CI) | Subtotals only | |
| 3.1 Talc poudrage vs talc slurry | 1 | 482 | Odds Ratio (M‐H, Random, 95% CI) | 0.47 [0.23, 0.96] |
| 3.2 Talc poudrage vs bleomycin | 1 | 32 | Odds Ratio (M‐H, Random, 95% CI) | 3.62 [0.14, 95.78] |
| 3.3 Talc poudrage vs iodine | 1 | 42 | Odds Ratio (M‐H, Random, 95% CI) | 9.97 [0.50, 198.04] |
| 4 Fever Show forest plot | 4 | Odds Ratio (M‐H, Random, 95% CI) | Subtotals only | |
| 4.1 Talc poudrage vs talc slurry | 2 | 479 | Odds Ratio (M‐H, Random, 95% CI) | 0.60 [0.15, 2.37] |
| 4.2 Talc poudrage vs bleomycin | 1 | 32 | Odds Ratio (M‐H, Random, 95% CI) | 1.15 [0.14, 9.38] |
| 4.3 Talc poudrage vs iodine | 1 | 42 | Odds Ratio (M‐H, Random, 95% CI) | 4.22 [0.43, 41.45] |
| Outcome or subgroup title | No. of studies | No. of participants | Statistical method | Effect size |
| 1 Pleurodesis failure Show forest plot | 11 | Odds Ratio (M‐H, Random, 95% CI) | Subtotals only | |
| 1.1 Tetracycline vs C. parvum | 1 | 32 | Odds Ratio (M‐H, Random, 95% CI) | 3.18 [0.52, 19.64] |
| 1.2 Tetracycline vs talc slurry | 1 | 32 | Odds Ratio (M‐H, Random, 95% CI) | 0.78 [0.19, 3.13] |
| 1.3 Tetracycline vs Adriamycin | 1 | 21 | Odds Ratio (M‐H, Random, 95% CI) | 0.9 [0.05, 16.59] |
| 1.4 Tetracyclines vs placebo | 1 | 20 | Odds Ratio (M‐H, Random, 95% CI) | 0.30 [0.05, 1.94] |
| 1.5 Tetracycline vs talc poudrage | 1 | 33 | Odds Ratio (M‐H, Random, 95% CI) | 12.10 [1.32, 111.30] |
| 1.6 Tetracycline vs mustine | 2 | 59 | Odds Ratio (M‐H, Random, 95% CI) | 0.37 [0.10, 1.35] |
| 1.7 Tetracycline vs combined tetracycline and bleomycin | 1 | 38 | Odds Ratio (M‐H, Random, 95% CI) | 8.27 [0.40, 172.05] |
| 1.8 Tetracycline vs bleomycin | 5 | 220 | Odds Ratio (M‐H, Random, 95% CI) | 2.00 [1.07, 3.75] |
| 1.9 Tetracycline vs mepacrine | 1 | 21 | Odds Ratio (M‐H, Random, 95% CI) | 1.6 [0.12, 20.99] |
| 2 Pain Show forest plot | 8 | Odds Ratio (M‐H, Random, 95% CI) | Subtotals only | |
| 2.1 Tetracycline vs talc slurry | 1 | 34 | Odds Ratio (M‐H, Random, 95% CI) | 3.28 [0.73, 14.68] |
| 2.2 Tetracycline vs bleomycin | 4 | 220 | Odds Ratio (M‐H, Random, 95% CI) | 1.65 [0.79, 3.43] |
| 2.3 Tetracycline vs C. parvum | 1 | 41 | Odds Ratio (M‐H, Random, 95% CI) | 0.41 [0.12, 1.45] |
| 2.4 Tetracycline vs mustine | 1 | 40 | Odds Ratio (M‐H, Random, 95% CI) | 33.87 [1.80, 636.88] |
| 2.5 Tetracycline vs mepacrine | 1 | 22 | Odds Ratio (M‐H, Random, 95% CI) | 0.18 [0.03, 1.23] |
| 2.6 Tetracycline vs placebo | 1 | 22 | Odds Ratio (M‐H, Random, 95% CI) | 0.0 [0.0, 0.0] |
| 3 Fever Show forest plot | 9 | Odds Ratio (M‐H, Random, 95% CI) | Subtotals only | |
| 3.1 Tetracycline vs talc slurry | 1 | 34 | Odds Ratio (M‐H, Random, 95% CI) | 0.92 [0.23, 3.63] |
| 3.2 Tetracycline vs bleomycin | 5 | 250 | Odds Ratio (M‐H, Random, 95% CI) | 0.49 [0.16, 1.50] |
| 3.3 Tetracycline vs C. parvum | 1 | 36 | Odds Ratio (M‐H, Random, 95% CI) | 0.00 [0.00, 0.06] |
| 3.4 Tetracycline vs mepacrine | 1 | 22 | Odds Ratio (M‐H, Random, 95% CI) | 0.13 [0.02, 0.89] |
| 3.5 Tetracycline vs combination tetracycline and bleomycin | 1 | 40 | Odds Ratio (M‐H, Random, 95% CI) | 0.47 [0.04, 5.69] |
| 3.6 Tetracycline vs placebo | 1 | 22 | Odds Ratio (M‐H, Random, 95% CI) | 0.0 [0.0, 0.0] |
| 3.7 Tetracycline vs mustine | 1 | 40 | Odds Ratio (M‐H, Random, 95% CI) | 0.0 [0.0, 0.0] |
| 4 Mortality Show forest plot | 4 | 202 | Odds Ratio (M‐H, Random, 95% CI) | 0.99 [0.30, 3.26] |
| 4.1 Tetracycline vs talc poudrage | 1 | 41 | Odds Ratio (M‐H, Random, 95% CI) | 0.19 [0.03, 1.10] |
| 4.2 Tetracycline vs bleomycin | 2 | 125 | Odds Ratio (M‐H, Random, 95% CI) | 1.60 [0.69, 3.69] |
| 4.3 Tetracycline vs C. parvum | 1 | 36 | Odds Ratio (M‐H, Random, 95% CI) | 3.0 [0.28, 31.99] |
| Outcome or subgroup title | No. of studies | No. of participants | Statistical method | Effect size |
| 1 Pleurodesis failure Show forest plot | 5 | Odds Ratio (M‐H, Random, 95% CI) | Subtotals only | |
| 1.1 C. parvum vs bleomycin | 2 | 78 | Odds Ratio (M‐H, Random, 95% CI) | 0.55 [0.01, 57.48] |
| 1.2 C. parvum vs tetracycline | 1 | 32 | Odds Ratio (M‐H, Random, 95% CI) | 0.31 [0.05, 1.94] |
| 1.3 C. parvum vs doxycycline | 1 | 35 | Odds Ratio (M‐H, Random, 95% CI) | 0.52 [0.12, 2.33] |
| 1.4 C. parvum vs mustine | 1 | 18 | Odds Ratio (M‐H, Random, 95% CI) | 0.33 [0.04, 2.52] |
| 2 Pain Show forest plot | 4 | 153 | Odds Ratio (M‐H, Random, 95% CI) | 2.51 [1.10, 5.75] |
| 2.1 C. parvum vs bleomycin | 2 | 71 | Odds Ratio (M‐H, Random, 95% CI) | 1.42 [0.54, 3.75] |
| 2.2 C . parvum vs tetracycline | 1 | 41 | Odds Ratio (M‐H, Random, 95% CI) | 2.44 [0.69, 8.66] |
| 2.3 C. parvum vs doxycycline | 1 | 41 | Odds Ratio (M‐H, Random, 95% CI) | 7.37 [1.84, 29.55] |
| 3 Fever Show forest plot | 5 | Odds Ratio (M‐H, Random, 95% CI) | Subtotals only | |
| 3.1 C. parvum vs bleomycin | 2 | 80 | Odds Ratio (M‐H, Random, 95% CI) | 2.30 [0.90, 5.92] |
| 3.2 C. parvum vs tetracycline | 1 | 36 | Odds Ratio (M‐H, Random, 95% CI) | 288.00 [16.62, 4991.05] |
| 3.3 C. parvum vs mustine | 1 | 21 | Odds Ratio (M‐H, Random, 95% CI) | 4.41 [0.16, 121.68] |
| 3.4 C. parvum vs doxycycline | 1 | 41 | Odds Ratio (M‐H, Random, 95% CI) | 7.37 [1.84, 29.55] |
| 4 Mortality Show forest plot | 3 | Odds Ratio (M‐H, Random, 95% CI) | Subtotals only | |
| 4.1 C. parvum vs bleomycin | 1 | 55 | Odds Ratio (M‐H, Random, 95% CI) | 1.66 [0.51, 5.38] |
| 4.2 C. parvum vs tetracycline | 1 | 36 | Odds Ratio (M‐H, Random, 95% CI) | 0.33 [0.03, 3.55] |
| 4.3 C. parvum vs mustine | 1 | 21 | Odds Ratio (M‐H, Random, 95% CI) | 0.42 [0.07, 2.66] |
| Outcome or subgroup title | No. of studies | No. of participants | Statistical method | Effect size |
| 1 Pleurodesis failure Show forest plot | 2 | Odds Ratio (M‐H, Random, 95% CI) | Subtotals only | |
| 1.1 IPC vs talc slurry | 2 | 160 | Odds Ratio (M‐H, Random, 95% CI) | 3.35 [1.64, 6.83] |
| 2 Mortality Show forest plot | 2 | 163 | Odds Ratio (M‐H, Random, 95% CI) | 1.03 [0.48, 2.23] |
| 3 Pain Show forest plot | 1 | Odds Ratio (M‐H, Random, 95% CI) | Subtotals only | |
| Outcome or subgroup title | No. of studies | No. of participants | Statistical method | Effect size |
| 1 Pleurodesis failure Show forest plot | 3 | Odds Ratio (M‐H, Random, 95% CI) | Subtotals only | |
| 1.1 Iodine vs talc poudrage | 1 | 42 | Odds Ratio (M‐H, Random, 95% CI) | 1.76 [0.26, 11.83] |
| 1.2 Iodine vs talc slurry | 1 | 36 | Odds Ratio (M‐H, Random, 95% CI) | 0.47 [0.04, 5.71] |
| 1.3 Iodine vs bleomycin | 1 | 39 | Odds Ratio (M‐H, Random, 95% CI) | 1.25 [0.28, 5.59] |
| 2 Fever Show forest plot | 2 | Odds Ratio (M‐H, Random, 95% CI) | Subtotals only | |
| 2.1 Iodine vs talc slurry | 1 | 36 | Odds Ratio (M‐H, Random, 95% CI) | 0.63 [0.09, 4.28] |
| 2.2 Iodine vs talc poudrage | 1 | 42 | Odds Ratio (M‐H, Random, 95% CI) | 0.24 [0.02, 2.33] |
| 3 Mortality Show forest plot | 1 | Odds Ratio (M‐H, Random, 95% CI) | Subtotals only | |
| 3.1 Iodine vs talc poudrage | 1 | 42 | Odds Ratio (M‐H, Random, 95% CI) | 0.38 [0.08, 1.73] |
| 4 Pain Show forest plot | 2 | Odds Ratio (M‐H, Random, 95% CI) | Subtotals only | |
| 4.1 Iodine vs talc slurry | 1 | 36 | Odds Ratio (M‐H, Random, 95% CI) | 0.0 [0.0, 0.0] |
| 4.2 Iodine vs talc poudrage | 1 | 42 | Odds Ratio (M‐H, Random, 95% CI) | 0.10 [0.01, 1.99] |
| Outcome or subgroup title | No. of studies | No. of participants | Statistical method | Effect size |
| 1 Pleurodesis failure Show forest plot | 4 | Odds Ratio (M‐H, Fixed, 95% CI) | Subtotals only | |
| 1.1 Doxycycline vs talc poudrage | 1 | 31 | Odds Ratio (M‐H, Fixed, 95% CI) | 42.69 [2.13, 856.61] |
| 1.2 Doxycycline vs bleomycin | 2 | 122 | Odds Ratio (M‐H, Fixed, 95% CI) | 0.66 [0.24, 1.83] |
| 1.3 Doxycycline vs C. parvum | 1 | 35 | Odds Ratio (M‐H, Fixed, 95% CI) | 1.91 [0.43, 8.48] |
| 2 Pain Show forest plot | 3 | Odds Ratio (M‐H, Random, 95% CI) | Subtotals only | |
| 2.1 Doxycycline vs bleomycin | 2 | 148 | Odds Ratio (M‐H, Random, 95% CI) | 1.19 [0.37, 3.80] |
| 2.2 Doxycycline vs C. parvum | 1 | 41 | Odds Ratio (M‐H, Random, 95% CI) | 0.10 [0.01, 0.96] |
| 3 Fever Show forest plot | 3 | 189 | Odds Ratio (M‐H, Random, 95% CI) | 0.28 [0.04, 2.16] |
| 3.1 Doxycycline vs bleomycin | 2 | 148 | Odds Ratio (M‐H, Random, 95% CI) | 0.37 [0.01, 12.35] |
| 3.2 Doxycycline vs C. parvum | 1 | 41 | Odds Ratio (M‐H, Random, 95% CI) | 0.14 [0.03, 0.54] |
| 4 Mortality Show forest plot | 1 | Odds Ratio (M‐H, Random, 95% CI) | Subtotals only | |
| 4.1 Doxycycline vs bleomycin | 1 | 80 | Odds Ratio (M‐H, Random, 95% CI) | 0.69 [0.26, 1.87] |
| Outcome or subgroup title | No. of studies | No. of participants | Statistical method | Effect size |
| 1 Pleurodesis failure Show forest plot | 4 | 628 | Odds Ratio (M‐H, Random, 95% CI) | 0.74 [0.52, 1.04] |
| 1.1 Talc | 3 | 599 | Odds Ratio (M‐H, Random, 95% CI) | 0.76 [0.54, 1.09] |
| 1.2 Tetracycline | 1 | 29 | Odds Ratio (M‐H, Random, 95% CI) | 0.28 [0.04, 1.76] |
| Outcome or subgroup title | No. of studies | No. of participants | Statistical method | Effect size |
| 1 Pleurodesis failure Show forest plot | 3 | Odds Ratio (M‐H, Fixed, 95% CI) | Subtotals only | |
| 2 Mortality Show forest plot | 3 | Odds Ratio (M‐H, Random, 95% CI) | Subtotals only | |
| Outcome or subgroup title | No. of studies | No. of participants | Statistical method | Effect size |
| 1 Pleurodesis failure Show forest plot | 4 | Odds Ratio (M‐H, Random, 95% CI) | Subtotals only | |
| 1.1 OK‐432 and mitomycin C | 1 | 53 | Odds Ratio (M‐H, Random, 95% CI) | 0.26 [0.06, 1.11] |
| 1.2 OK‐432 vs cisplatin and etoposide | 1 | 67 | Odds Ratio (M‐H, Random, 95% CI) | 0.77 [0.26, 2.27] |
| 1.3 OK‐432 and cisplatin | 1 | 34 | Odds Ratio (M‐H, Random, 95% CI) | 0.48 [0.12, 1.92] |
| 1.4 High dose vs low dose | 1 | 38 | Odds Ratio (M‐H, Random, 95% CI) | 1.90 [0.38, 9.44] |
| 1.5 OK‐432 vs bleomycin | 1 | 68 | Odds Ratio (M‐H, Random, 95% CI) | 0.70 [0.24, 2.03] |
| 1.6 OK‐432 vs OK‐432 and cisplatin | 1 | 32 | Odds Ratio (M‐H, Random, 95% CI) | 12.44 [1.32, 117.03] |
| 2 Pain Show forest plot | 3 | Odds Ratio (M‐H, Random, 95% CI) | Subtotals only | |
| 2.1 OK‐432 vs cisplatin | 1 | 34 | Odds Ratio (M‐H, Random, 95% CI) | 6.67 [1.15, 38.60] |
| 2.2 OK‐432 vs OK‐432 and cisplatin | 1 | 32 | Odds Ratio (M‐H, Random, 95% CI) | 1.33 [0.33, 5.43] |
| 2.3 OK‐432 vs mitomycin C | 1 | 53 | Odds Ratio (M‐H, Random, 95% CI) | 1.04 [0.14, 8.00] |
| 2.4 OK‐432 vs bleomycin | 1 | 67 | Odds Ratio (M‐H, Random, 95% CI) | 2.53 [0.89, 7.15] |
| 2.5 OK‐432 vs cisplatin and etoposide | 1 | 66 | Odds Ratio (M‐H, Random, 95% CI) | 2.1 [0.73, 6.01] |
| 3 Fever Show forest plot | 3 | Odds Ratio (M‐H, Random, 95% CI) | Subtotals only | |
| 3.1 OK‐432 vs cisplatin | 1 | 34 | Odds Ratio (M‐H, Random, 95% CI) | 256.00 [14.70, 4457.27] |
| 3.2 OK‐432 vs OK‐432 and cisplatin | 1 | 32 | Odds Ratio (M‐H, Random, 95% CI) | 14.00 [1.46, 134.25] |
| 3.3 OK‐432 vs mitomycin C | 1 | 53 | Odds Ratio (M‐H, Random, 95% CI) | 26.67 [5.91, 120.42] |
| 3.4 OK‐432 vs bleomycin | 1 | 67 | Odds Ratio (M‐H, Random, 95% CI) | 1.43 [0.47, 4.35] |
| 3.5 OK‐432 vs cisplatin and etoposide | 1 | 66 | Odds Ratio (M‐H, Random, 95% CI) | 3.17 [1.08, 9.30] |
| 4 Mortality Show forest plot | 2 | Odds Ratio (M‐H, Random, 95% CI) | Subtotals only | |
| 4.1 OK‐432 vs cisplatin | 1 | 34 | Odds Ratio (M‐H, Random, 95% CI) | 1.31 [0.31, 5.53] |
| 4.2 OK‐432 vs combined OK‐432 and cisplatin | 1 | 32 | Odds Ratio (M‐H, Random, 95% CI) | 2.18 [0.44, 10.91] |
| 4.3 OK‐432 vs bleomycin | 1 | 68 | Odds Ratio (M‐H, Random, 95% CI) | 0.38 [0.14, 1.03] |
| 4.4 OK‐432 vs cisplatin and etoposide | 1 | 67 | Odds Ratio (M‐H, Random, 95% CI) | 0.84 [0.32, 2.18] |
| Outcome or subgroup title | No. of studies | No. of participants | Statistical method | Effect size |
| 1 Pain Show forest plot | 3 | 114 | Odds Ratio (M‐H, Random, 95% CI) | 4.56 [1.66, 12.52] |
| 1.1 Mepacrine vs bleomycin | 1 | 40 | Odds Ratio (M‐H, Random, 95% CI) | 2.15 [0.52, 9.00] |
| 1.2 Mepacrine vs tetracycline | 1 | 22 | Odds Ratio (M‐H, Random, 95% CI) | 5.6 [0.81, 38.51] |
| 1.3 Mepacrine vs placebo | 1 | 23 | Odds Ratio (M‐H, Random, 95% CI) | 14.53 [0.71, 298.21] |
| 1.4 Mepacrine vs triethylenethiophosphoramide | 1 | 29 | Odds Ratio (M‐H, Random, 95% CI) | 23.71 [1.19, 474.06] |
| 2 Fever Show forest plot | 3 | Odds Ratio (M‐H, Random, 95% CI) | Subtotals only | |
| 2.1 Mepacrine vs bleomycin | 1 | 40 | Odds Ratio (M‐H, Random, 95% CI) | 1.91 [0.52, 7.01] |
| 2.2 Mepacrine vs tetracycline | 1 | 22 | Odds Ratio (M‐H, Random, 95% CI) | 8.00 [1.13, 56.79] |
| 2.3 Mepacrine vs placebo | 1 | 23 | Odds Ratio (M‐H, Random, 95% CI) | 62.43 [2.85, 1365.52] |
| 2.4 Mepacrine vs triethylene... | 1 | 29 | Odds Ratio (M‐H, Random, 95% CI) | 23.83 [3.35, 169.39] |
| 3 Pleurodesis failure Show forest plot | 5 | Odds Ratio (M‐H, Random, 95% CI) | Subtotals only | |
| 3.1 Mepacrine vs talc slurry | 1 | 89 | Odds Ratio (M‐H, Random, 95% CI) | 2.08 [0.62, 6.96] |
| 3.2 Mepacrine vs bleomycin | 1 | 36 | Odds Ratio (M‐H, Random, 95% CI) | 0.16 [0.03, 0.89] |
| 3.3 Mepacrine vs tetracycline | 1 | 21 | Odds Ratio (M‐H, Random, 95% CI) | 0.63 [0.05, 8.20] |
| 3.4 Mepacrine vs placebo | 1 | 23 | Odds Ratio (M‐H, Random, 95% CI) | 0.07 [0.01, 0.73] |
| 3.5 Mepacrine vs mitoxantrone | 1 | 26 | Odds Ratio (M‐H, Random, 95% CI) | 7.61 [0.35, 163.82] |
| 3.6 Mepacrine vs triethylene... | 1 | 29 | Odds Ratio (M‐H, Random, 95% CI) | 0.20 [0.04, 0.98] |
| 4 Mortality Show forest plot | 2 | Odds Ratio (M‐H, Random, 95% CI) | Subtotals only | |
| 4.1 Mepacrine vs talc slurry | 1 | 89 | Odds Ratio (M‐H, Random, 95% CI) | 0.53 [0.20, 1.43] |
| 4.2 Mepacrine vs mitoxantrone | 1 | 28 | Odds Ratio (M‐H, Random, 95% CI) | 1.64 [0.23, 11.70] |
| Outcome or subgroup title | No. of studies | No. of participants | Statistical method | Effect size |
| 1 Pleurodesis failure Show forest plot | 1 | Odds Ratio (M‐H, Random, 95% CI) | Subtotals only | |
| 1.1 IFN vs bleomycin | 1 | 160 | Odds Ratio (M‐H, Random, 95% CI) | 3.25 [1.54, 6.89] |
| 2 Pain Show forest plot | 1 | 160 | Odds Ratio (M‐H, Random, 95% CI) | 0.03 [0.00, 0.53] |
| 3 Fever Show forest plot | 1 | 160 | Odds Ratio (M‐H, Random, 95% CI) | 0.01 [0.00, 0.11] |
| 4 Mortality Show forest plot | 1 | Odds Ratio (M‐H, Random, 95% CI) | Subtotals only | |
| Outcome or subgroup title | No. of studies | No. of participants | Statistical method | Effect size |
| 1 Pleurodesis failure Show forest plot | 1 | Odds Ratio (M‐H, Random, 95% CI) | Subtotals only | |
| 1.1 Triethylene... vs placebo | 1 | 24 | Odds Ratio (M‐H, Random, 95% CI) | 0.34 [0.03, 3.69] |
| 1.2 Triethylene... vs mepacrine | 1 | 29 | Odds Ratio (M‐H, Random, 95% CI) | 4.95 [1.02, 24.10] |
| 2 Pain Show forest plot | 1 | 53 | Odds Ratio (M‐H, Random, 95% CI) | 1.39 [0.10, 20.15] |
| 2.1 Triethylene... vs mepacrine | 1 | 29 | Odds Ratio (M‐H, Random, 95% CI) | 0.48 [0.10, 2.30] |
| 2.2 Triethylene... vs placebo | 1 | 24 | Odds Ratio (M‐H, Random, 95% CI) | 7.43 [0.35, 156.28] |
| 3 Fever Show forest plot | 1 | 53 | Odds Ratio (M‐H, Random, 95% CI) | 0.32 [0.00, 26.74] |
| 3.1 Triethylene... vs placebo | 1 | 24 | Odds Ratio (M‐H, Random, 95% CI) | 3.52 [0.15, 81.92] |
| 3.2 Triethylene... vs mepacrine | 1 | 29 | Odds Ratio (M‐H, Random, 95% CI) | 0.04 [0.01, 0.30] |
| Outcome or subgroup title | No. of studies | No. of participants | Statistical method | Effect size |
| 1 Pleurodesis failure Show forest plot | 2 | Odds Ratio (M‐H, Random, 95% CI) | Subtotals only | |
| 1.1 Adriamycin vs mustine | 1 | 20 | Odds Ratio (M‐H, Random, 95% CI) | 0.37 [0.01, 10.18] |
| 1.2 Adriamycin vs tetracycline | 1 | 21 | Odds Ratio (M‐H, Random, 95% CI) | 1.11 [0.06, 20.49] |
| 1.3 Adriamycin vs LC9018 and Adriamycin | 1 | 76 | Odds Ratio (M‐H, Random, 95% CI) | 4.29 [1.62, 11.35] |
| 2 Fever Show forest plot | 1 | Odds Ratio (M‐H, Random, 95% CI) | Subtotals only | |
| 3 Pain Show forest plot | 1 | Odds Ratio (M‐H, Random, 95% CI) | Subtotals only | |
| Outcome or subgroup title | No. of studies | No. of participants | Statistical method | Effect size |
| 1 Pleurodesis failure Show forest plot | 4 | Odds Ratio (M‐H, Random, 95% CI) | Subtotals only | |
| 1.1 Placebo vs mepacrine | 1 | 23 | Odds Ratio (M‐H, Random, 95% CI) | 14.40 [1.37, 150.81] |
| 1.2 Placebo vs mitoxantrone | 1 | 95 | Odds Ratio (M‐H, Random, 95% CI) | 1.33 [0.56, 3.17] |
| 1.3 Placebo vs triethylene... | 1 | 24 | Odds Ratio (M‐H, Random, 95% CI) | 2.91 [0.27, 31.21] |
| 1.4 Placebo vs talc slurry | 1 | 21 | Odds Ratio (M‐H, Random, 95% CI) | 13.93 [0.66, 293.99] |
| 1.5 Placebo vs tetracycline | 1 | 20 | Odds Ratio (M‐H, Random, 95% CI) | 3.33 [0.51, 21.58] |
| 2 Pain Show forest plot | 3 | 100 | Odds Ratio (M‐H, Random, 95% CI) | 0.10 [0.01, 0.82] |
| 2.1 Placebo vs talc slurry | 1 | 31 | Odds Ratio (M‐H, Random, 95% CI) | 0.0 [0.0, 0.0] |
| 2.2 Placebo vs tetracycline | 1 | 22 | Odds Ratio (M‐H, Random, 95% CI) | 0.0 [0.0, 0.0] |
| 2.3 Placebo vs mepacrine | 1 | 23 | Odds Ratio (M‐H, Random, 95% CI) | 0.07 [0.00, 1.41] |
| 2.4 Placebo vs triethylene... | 1 | 24 | Odds Ratio (M‐H, Random, 95% CI) | 0.13 [0.01, 2.83] |
| 3 Fever Show forest plot | 2 | Odds Ratio (M‐H, Random, 95% CI) | Subtotals only | |
| 3.1 Placebo vs mepacrine | 1 | 95 | Odds Ratio (M‐H, Random, 95% CI) | 0.31 [0.12, 0.79] |
| 3.2 Placebo vs mitoxantone | 1 | 23 | Odds Ratio (M‐H, Random, 95% CI) | 0.02 [0.00, 0.35] |
| 3.3 Placebo vs triethylene... | 1 | 24 | Odds Ratio (M‐H, Random, 95% CI) | 0.28 [0.01, 6.62] |
| Outcome or subgroup title | No. of studies | No. of participants | Statistical method | Effect size |
| 1 Pleurodesis failure Show forest plot | 4 | Odds Ratio (M‐H, Random, 95% CI) | Subtotals only | |
| 1.1 Mustine vs tetracycline | 2 | 59 | Odds Ratio (M‐H, Random, 95% CI) | 2.72 [0.74, 9.98] |
| 1.2 Mustine vs talc poudrage | 1 | 37 | Odds Ratio (M‐H, Random, 95% CI) | 8.00 [1.40, 45.76] |
| 1.3 Mustine vs C. parvum | 1 | 31 | Odds Ratio (M‐H, Random, 95% CI) | 10.8 [1.64, 70.93] |
| 1.4 Mustine vs Adriamycin | 1 | 20 | Odds Ratio (M‐H, Random, 95% CI) | 2.71 [0.10, 74.98] |
| 2 Fever Show forest plot | 2 | Odds Ratio (M‐H, Random, 95% CI) | Subtotals only | |
| 2.1 Mustine vs tetracycline | 1 | 40 | Odds Ratio (M‐H, Random, 95% CI) | 0.0 [0.0, 0.0] |
| 2.2 Mustine vs C. parvum | 1 | 21 | Odds Ratio (M‐H, Random, 95% CI) | 0.23 [0.01, 6.25] |
| 3 Mortality Show forest plot | 2 | Odds Ratio (M‐H, Random, 95% CI) | Subtotals only | |
| 3.1 Mustine vs talc poudrage | 1 | 46 | Odds Ratio (M‐H, Random, 95% CI) | 2.35 [0.51, 10.86] |
| 3.2 Mustine vs C. parvum | 1 | 21 | Odds Ratio (M‐H, Random, 95% CI) | 2.4 [0.38, 15.32] |
| 4 Pain Show forest plot | 1 | Odds Ratio (M‐H, Random, 95% CI) | Subtotals only | |
| Outcome or subgroup title | No. of studies | No. of participants | Statistical method | Effect size |
| 1 Pleurodesis failure Show forest plot | 3 | Odds Ratio (M‐H, Random, 95% CI) | Subtotals only | |
| 1.1 Mitoxantrone vs placebo | 1 | 95 | Odds Ratio (M‐H, Random, 95% CI) | 0.75 [0.32, 1.79] |
| 1.2 Mitoxantrone vs mepacrine | 1 | 26 | Odds Ratio (M‐H, Random, 95% CI) | 7.61 [0.35, 163.82] |
| 1.3 Mitoxantrone vs bleomycin | 1 | 85 | Odds Ratio (M‐H, Random, 95% CI) | 3.18 [1.17, 8.65] |
| 2 Pain Show forest plot | 1 | 96 | Odds Ratio (M‐H, Random, 95% CI) | 2.08 [0.64, 6.76] |
| 3 Fever Show forest plot | 2 | Odds Ratio (M‐H, Random, 95% CI) | Subtotals only | |
| 3.1 Mitoxantrone vs bleomycin | 1 | 96 | Odds Ratio (M‐H, Random, 95% CI) | 0.90 [0.30, 2.71] |
| 3.2 Mitoxantrone vs placebo | 1 | 95 | Odds Ratio (M‐H, Random, 95% CI) | 3.28 [1.26, 8.49] |
| 4 Mortality Show forest plot | 2 | Odds Ratio (M‐H, Random, 95% CI) | Subtotals only | |
| 4.1 Mitoxantrone vs bleomycin | 1 | 96 | Odds Ratio (M‐H, Random, 95% CI) | 0.47 [0.21, 1.05] |
| 4.2 Mitoxantrone vs mepacrine | 1 | 28 | Odds Ratio (M‐H, Random, 95% CI) | 0.61 [0.09, 4.37] |
| Outcome or subgroup title | No. of studies | No. of participants | Statistical method | Effect size |
| 1 Pleurodesis failure Show forest plot | 1 | 18 | Odds Ratio (M‐H, Random, 95% CI) | 0.57 [0.07, 4.64] |
| 2 Pain Show forest plot | 1 | Odds Ratio (M‐H, Random, 95% CI) | Subtotals only | |
| 3 Mortality Show forest plot | 1 | Odds Ratio (M‐H, Random, 95% CI) | Subtotals only | |
| Outcome or subgroup title | No. of studies | No. of participants | Statistical method | Effect size |
| 1 Pleurodesis failure Show forest plot | 1 | 87 | Odds Ratio (M‐H, Random, 95% CI) | 0.43 [0.14, 1.30] |
| 2 Mortality Show forest plot | 1 | Odds Ratio (M‐H, Random, 95% CI) | Subtotals only | |
| Outcome or subgroup title | No. of studies | No. of participants | Statistical method | Effect size |
| 1 Pleurodesis failure Show forest plot | 4 | 205 | Odds Ratio (M‐H, Random, 95% CI) | 1.26 [0.70, 2.30] |
| 1.1 Rotation vs no rotation | 1 | 20 | Odds Ratio (M‐H, Random, 95% CI) | 2.25 [0.17, 29.77] |
| 1.2 Streptokinase vs no streptokinase | 1 | 35 | Odds Ratio (M‐H, Random, 95% CI) | 2.18 [0.53, 9.02] |
| 1.3 Mixed particle talc vs graded talc | 1 | 28 | Odds Ratio (M‐H, Random, 95% CI) | 1.64 [0.23, 11.70] |
| 1.4 Talc pleurodesis vs VATS parietal pleurectomy | 1 | 122 | Odds Ratio (M‐H, Random, 95% CI) | 1.01 [0.49, 2.09] |
| 2 Pain Show forest plot | 1 | Odds Ratio (M‐H, Random, 95% CI) | Subtotals only | |
| 2.1 Streptokinase vs control | 1 | 47 | Odds Ratio (M‐H, Random, 95% CI) | 3.0 [0.12, 77.47] |
| 3 Fever Show forest plot | 1 | Odds Ratio (M‐H, Random, 95% CI) | Subtotals only | |
| 3.1 Mixed particle talc vs graded talc | 1 | 46 | Odds Ratio (M‐H, Random, 95% CI) | 15.92 [1.81, 140.16] |
| 4 Mortality Show forest plot | 2 | Odds Ratio (M‐H, Random, 95% CI) | Subtotals only | |
| 4.1 Mixed particle talc vs graded talc | 1 | 43 | Odds Ratio (M‐H, Random, 95% CI) | 0.88 [0.25, 3.07] |
| 4.2 Talc pleurodesis vs VATS partial pleurectomy | 1 | 175 | Odds Ratio (M‐H, Random, 95% CI) | 0.92 [0.45, 1.90] |
| Outcome or subgroup title | No. of studies | No. of participants | Statistical method | Effect size |
| 1 Pleurodesis failure Show forest plot | 1 | Odds Ratio (M‐H, Random, 95% CI) | Subtotals only | |
| 2 Fever Show forest plot | 1 | Odds Ratio (M‐H, Random, 95% CI) | Subtotals only | |
| Outcome or subgroup title | No. of studies | No. of participants | Statistical method | Effect size |
| 1 Pleurodesis failure Show forest plot | 3 | Odds Ratio (M‐H, Random, 95% CI) | Subtotals only | |
| 1.1 Cisplatin vs cisplatin and bevacizumab | 1 | 70 | Odds Ratio (M‐H, Random, 95% CI) | 5.0 [1.66, 15.09] |
| 1.2 Cisplatin vs OK‐432 | 1 | 34 | Odds Ratio (M‐H, Random, 95% CI) | 2.06 [0.52, 8.17] |
| 1.3 Cisplatin vs OK‐432 and cisplatin | 1 | 32 | Odds Ratio (M‐H, Random, 95% CI) | 25.67 [2.68, 245.84] |
| 1.4 Cisplatin vs rAd‐p53 and cisplatin | 1 | 35 | Odds Ratio (M‐H, Random, 95% CI) | 4.67 [0.99, 22.03] |
| 2 Pain Show forest plot | 1 | Odds Ratio (M‐H, Random, 95% CI) | Subtotals only | |
| 2.1 Cisplatin vs OK‐432 | 1 | 34 | Odds Ratio (M‐H, Random, 95% CI) | 0.15 [0.03, 0.87] |
| 2.2 Cisplatin vs OK‐432 and cisplatin | 1 | 32 | Odds Ratio (M‐H, Random, 95% CI) | 0.2 [0.03, 1.21] |
| 3 Fever Show forest plot | 2 | Odds Ratio (M‐H, Random, 95% CI) | Subtotals only | |
| 3.1 Cisplatin vs OK‐432 | 1 | 34 | Odds Ratio (M‐H, Random, 95% CI) | 0.00 [0.00, 0.07] |
| 3.2 Cisplatin vs OK‐432 and cisplatin | 1 | 32 | Odds Ratio (M‐H, Random, 95% CI) | 0.05 [0.01, 0.52] |
| 3.3 Cisplatin vs rAd‐p53 and cisplatin | 1 | 35 | Odds Ratio (M‐H, Random, 95% CI) | 0.09 [0.02, 0.51] |
| 4 Mortality Show forest plot | 2 | Odds Ratio (M‐H, Random, 95% CI) | Subtotals only | |
| 4.1 Cisplatin vs OK‐432 | 1 | 34 | Odds Ratio (M‐H, Random, 95% CI) | 0.76 [0.18, 3.23] |
| 4.2 Cisplatin vs combination OK‐432 and cisplatin | 1 | 32 | Odds Ratio (M‐H, Random, 95% CI) | 1.67 [0.32, 8.59] |
| 4.3 Cisplatin vs combination rAd‐p53 and cisplatin | 1 | 35 | Odds Ratio (M‐H, Random, 95% CI) | 0.0 [0.0, 0.0] |
| Outcome or subgroup title | No. of studies | No. of participants | Statistical method | Effect size |
| 1 Pleurodesis failure Show forest plot | 1 | 79 | Odds Ratio (M‐H, Random, 95% CI) | 0.79 [0.22, 2.82] |
| Outcome or subgroup title | No. of studies | No. of participants | Statistical method | Effect size |
| 1 Pleurodesis failure Show forest plot | 1 | Odds Ratio (M‐H, Random, 95% CI) | Subtotals only | |
| 1.1 Silver nitrate 90 mg vs 150 mg | 1 | 40 | Odds Ratio (M‐H, Random, 95% CI) | 0.0 [0.0, 0.0] |
| 1.2 Silver nitrate 90 mg vs 180 mg | 1 | 40 | Odds Ratio (M‐H, Random, 95% CI) | 0.18 [0.01, 4.01] |
| 1.3 Silver nitrate 150 mg vs 180 mg | 1 | 40 | Odds Ratio (M‐H, Random, 95% CI) | 0.18 [0.01, 4.01] |
| 2 Mortality Show forest plot | 1 | Odds Ratio (M‐H, Random, 95% CI) | Subtotals only | |
| 2.1 Silver nitrate 90 mg vs 150 mg | 1 | 39 | Odds Ratio (M‐H, Random, 95% CI) | 3.18 [0.30, 33.58] |
| 2.2 Silver nitrate 90 mg vs 180 mg | 1 | 39 | Odds Ratio (M‐H, Random, 95% CI) | 7.80 [0.38, 161.87] |
| 2.3 Silver nitrate 150 mg vs 180 mg | 1 | 38 | Odds Ratio (M‐H, Random, 95% CI) | 3.16 [0.12, 82.64] |
| 3 Pain Show forest plot | 1 | Odds Ratio (M‐H, Random, 95% CI) | Subtotals only | |
| 3.1 Silver nitrate 90 mg vs 150 mg | 1 | 40 | Odds Ratio (M‐H, Random, 95% CI) | 1.0 [0.13, 7.89] |
| 3.2 Silver nitrate 90 mg vs 180 mg | 1 | 40 | Odds Ratio (M‐H, Random, 95% CI) | 1.0 [0.13, 7.89] |
| 3.3 Silver nitrate 150 mg vs 180 mg | 1 | 40 | Odds Ratio (M‐H, Random, 95% CI) | 1.0 [0.13, 7.89] |
| 4 Fever Show forest plot | 1 | Odds Ratio (M‐H, Random, 95% CI) | Subtotals only | |
| 4.1 Silver nitrate 90 mg vs 150 mg | 1 | 40 | Odds Ratio (M‐H, Random, 95% CI) | 0.63 [0.09, 4.24] |
| 4.2 Silver nitrate 90 mg vs 180 mg | 1 | 40 | Odds Ratio (M‐H, Random, 95% CI) | 1.0 [0.13, 7.89] |
| 4.3 Silver nitrate 150 mg vs 180 mg | 1 | 40 | Odds Ratio (M‐H, Random, 95% CI) | 1.59 [0.24, 10.70] |