Ortesis de la rodilla para el tratamiento del síndrome de dolor patelofemoral
Información
- DOI:
- https://doi.org/10.1002/14651858.CD010513.pub2Copiar DOI

- Base de datos:
-
- Cochrane Database of Systematic Reviews
- Versión publicada:
-
- 08 diciembre 2015see what's new
- Tipo:
-
- Intervention
- Etapa:
-
- Review
- Grupo Editorial Cochrane:
-
Grupo Cochrane de Lesiones óseas, articulares y musculares
- Copyright:
-
- Copyright © 2015 The Cochrane Collaboration. Published by John Wiley & Sons, Ltd.
Cifras del artículo
Altmetric:
Citado por:
Autores
Contributions of authors
TS: contributed to the literature search; reviewed the search results for review eligibility and identified all included trials; adjudicated the data extraction and assessment of 'risk of bias' processes; conducted the data analysis; was involved in the writing and approval of the protocol and the final review; acts as guarantor.
BD: screened the search results for review eligibility and identified all included trials; independently performed the data extraction; assessed the 'risk of bias' for the included studies; provided judgements on the interpretation of the results and conclusions drawn; was involved in the writing and approval of the protocol and the final review.
TM: was involved in the final decisions regarding inclusion or exclusion of studies; independently undertook the data extraction; assessed the 'risk of bias' for the included studies; provided judgements on the interpretation of the results and conclusions drawn; was involved in the writing and approval of the protocol and the final review.
AC: provided judgements on the analysis approaches; provided judgement on the interpretation of the results and conclusions drawn; was involved in the writing and approval of the protocol and the final review.
Declarations of interest
Toby O Smith: none known
Benjamin T Drew: currently holds a NIHR/HEE Clinical Doctoral Fellowship grant
Toby H Meek: none known
Allan B Clark: none known
Acknowledgements
We thank Michael Callaghan, Nigel Hanchard and Helen Handoll for their helpful feedback about versions of the protocol and the full review, and Lindsey Elstub and Laura MacDonald for assistance in the preparation of the protocol and full review. We also thank Joanne Elliott for her assistance in developing and running the search strategies.
This project was supported by the National Institute for Health Research via Cochrane Infrastructure funding to the Cochrane Bone, Joint and Muscle Trauma Group. The views and opinions expressed therein are those of the authors and do not necessarily reflect those of the Systematic Reviews Programme, NIHR, NHS or the Department of Health.
Version history
| Published | Title | Stage | Authors | Version |
| 2015 Dec 08 | Knee orthoses for treating patellofemoral pain syndrome | Review | Toby O Smith, Benjamin T Drew, Toby H Meek, Allan B Clark | |
| 2013 May 31 | Knee orthoses for treating patellofemoral pain syndrome | Protocol | Toby O Smith, Benjamin T Drew, Toby H Meek, Allan B Clark | |
Differences between protocol and review
There were insufficient data to perform subgroup analyses of custom‐made orthosis to a pre‐fabricated (off‐the‐shelf) version, of people age 18 years or over versus those aged under 18 years, or the level of activity (participants who were professional athletes or in the military forces versus recreational athletes).
We merged two original comparators into one comparator on data analysis. The protocol stipulated the comparators 'knee orthosis versus no treatment' and 'knee orthosis and non‐operative intervention (e.g. exercise) versus non‐operative intervention alone'. On reflection of the results from the included studies, these appeared arbitrary distinctions where all participants received some form of treatment, be that exercise or basic military training, which would include knee exercises. Therefore we synthesised these two comparators into the single 'knee orthosis and non‐operative intervention (e.g. exercise) versus non‐operative intervention alone' comparator as presented in the review.
Due to the available data, it was not possible to present an informative 'Summary of Findings' table for all planned comparisons. Therefore we only presented a 'Summary of Findings' table for the main comparison (Knee orthosis and non‐operative intervention (e.g. exercise) versus non‐operative intervention alone).
It was not possible to perform a sensitivity analysis of the presentation of 90% of data versus greater than 10% lost to follow‐up data due to insufficient data for such an analysis.
It was not possible to investigate outcomes dependent on the mode of knee orthoses such as length of time worn per day, whether the orthosis was worn only during physical activity, during therapeutic exercises or all day, since this had not been specifically investigated within the available literature for specific forms of knee orthoses.
It was not possible to assess publication bias for such small sample sizes: the largest number of trials pooled in this review was three. Consequently, it was not possible to ascertain whether the findings of this review were, or were not, affected by publication bias.
Keywords
MeSH
Medical Subject Headings (MeSH) Keywords
Medical Subject Headings Check Words
Adult; Female; Humans; Male; Young Adult;
PICO
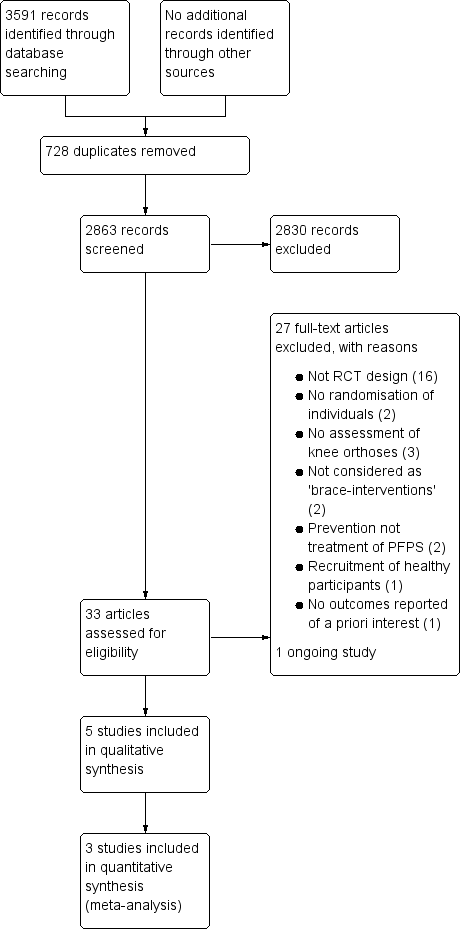
Study flow diagram

Risk of bias graph: review authors' judgements about each risk of bias item presented as percentages across all included studies
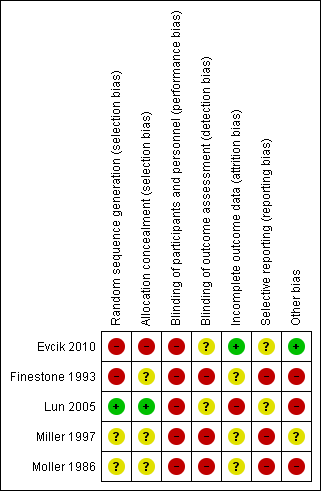
Risk of bias summary: review authors' judgements about each risk of bias item for each included study

Forest plot 1.1. Comparison: knee orthosis and exercises versus exercises alone. Outcome: pain during activity (0 to 10; higher score means worse pain)

Comparison 1 Knee orthosis and non‐operative intervention (exercises) versus non‐operative intervention (exercises) alone, Outcome 1 Pain during activity (0 to 10; higher score means worse pain).
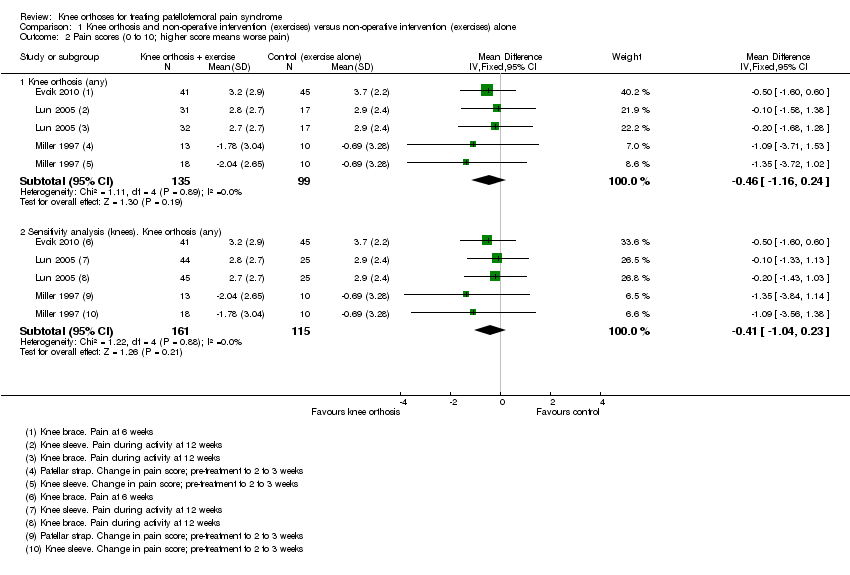
Comparison 1 Knee orthosis and non‐operative intervention (exercises) versus non‐operative intervention (exercises) alone, Outcome 2 Pain scores (0 to 10; higher score means worse pain).

Comparison 1 Knee orthosis and non‐operative intervention (exercises) versus non‐operative intervention (exercises) alone, Outcome 3 Different pain scores (0 to 10; higher score means worse pain) at 12 weeks.
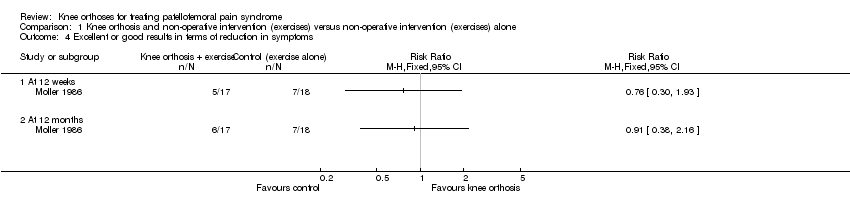
Comparison 1 Knee orthosis and non‐operative intervention (exercises) versus non‐operative intervention (exercises) alone, Outcome 4 Excellent or good results in terms of reduction in symptoms.

Comparison 1 Knee orthosis and non‐operative intervention (exercises) versus non‐operative intervention (exercises) alone, Outcome 5 Functional scores (higher score means higher function).
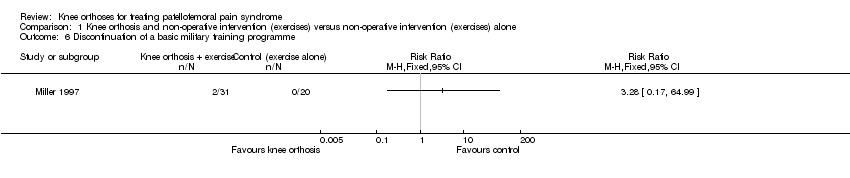
Comparison 1 Knee orthosis and non‐operative intervention (exercises) versus non‐operative intervention (exercises) alone, Outcome 6 Discontinuation of a basic military training programme.

Comparison 2 One type of orthosis versus another type, Outcome 1 Pain score (0 to 10: higher score means worse pain).

Comparison 2 One type of orthosis versus another type, Outcome 2 Functional score (0 to 53: higher scores means greater function).
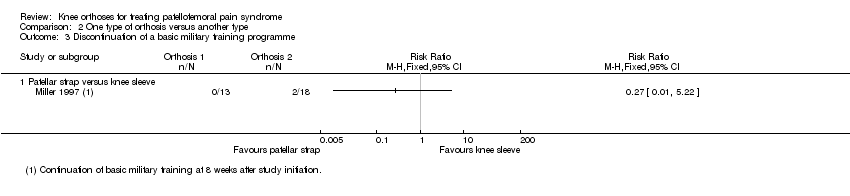
Comparison 2 One type of orthosis versus another type, Outcome 3 Discontinuation of a basic military training programme.

Comparison 2 One type of orthosis versus another type, Outcome 4 Complications.

Comparison 3 Orthosis versus exercise, Outcome 1 Pain during activity (0 to 10: higher score means worse pain).
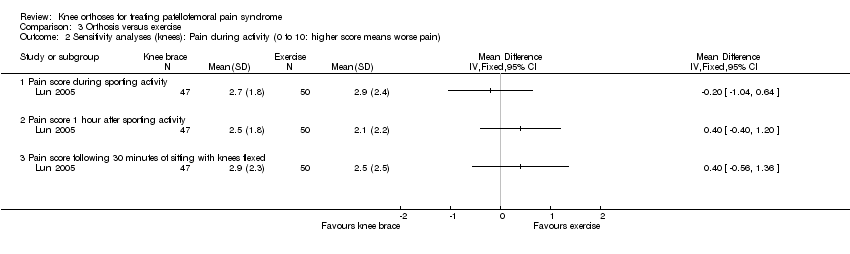
Comparison 3 Orthosis versus exercise, Outcome 2 Sensitivity analyses (knees): Pain during activity (0 to 10: higher score means worse pain).

Comparison 3 Orthosis versus exercise, Outcome 3 Functional scores (0 to 53: higher scores means greater function).
| Knee orthosis and exercise versus exercise alone for patellofemoral pain syndrome (PFPS) | ||||||
| Patient or population: Adults (recruited from health clinics or military recruits) with PFPS (duration of symptoms ranged from acute, under 2 to 3 weeks in two trials, to predominantly chronic in three trials: mean durations 8.3 months, 21 months, 21 months) Settings: Health clinics, home and military training establishments Intervention: Knee orthosis (various types: knee sleeve, knee brace or patellar strap) and exercise (military training, home exercise programme) Comparison: Exercise alone | ||||||
| Outcomes | Illustrative comparative risks* (95% CI) | Relative effect | No of Participants | Quality of the evidence | Comments | |
| Assumed risk | Corresponding risk | |||||
| Exercise alone | Knee orthosis and exercise | |||||
| Pain score (VAS) Scale from: 0 to 10 (higher scores mean worse pain) Follow‐up: 3 to 12 weeks (short‐term) | The mean pain score for the exercise alone group ranged across the control groups from 2.7 to 3.2 points; the mean change score from ‐0.47 to ‐0.96 points | The mean pain score in the knee orthosis and exercise group was 0.46 points lower (1.16 lower to 0.24 higher) | MD ‐0.46 (‐1.16 to 0.24) | 234 (3) | ⊕⊝⊝⊝ | The MD and 95% CIs do not include clinically important treatment effects. MCID: 30 mm on an 100 mm VAS (Lee 2003) |
| Functional outcomes Scale various 2 Follow‐up: 6 and 12 weeks (short‐term) | The mean functional score in the knee orthosis and exercise group was 0.15 points lower (0.69 lower to 0.38 higher) The mean difference in knee function (short‐term) in the knee orthosis group was 0.25 standard deviations lower (0.55 lower to 0.05 higher) | SMD ‐0.25 (‐0.55 to 0.05) | 183 (2) | ⊕⊝⊝⊝ | Lower values equate to higher disability. The SMD result equates to a small difference at most and in absolute terms, the mean differences for each trial were small (e.g. 0.9 for a range 0 to 68) and not clinically important | |
| Quality of Life and General Health Assessments | See comment | See comment | No study reported this outcome | |||
| Impact on sporting and occupational participation | See comment | See comment | 51 (1)4 | ⊕⊝⊝⊝ | One trial reported that 2 out of 31 (6.5%) participants in the knee orthosis groups versus 0 of 20 (0%) in the control group withdrew from their military training programme. | |
| Resource use | See comment | See comment | No study reported this outcome | |||
| Participant satisfaction | See comment | See comment | No study reported this outcome | |||
| Complications Follow‐up: 14 weeks6 | See comment | See comment | 59 with 84 affected knees (1) | ⊕⊝⊝⊝ | Trial reported 16 complications (skin abrasions or discomfort) for 44 knees (36%) of participants in the knee orthosis group. | |
| *The basis for the assumed risk (e.g. the median control group risk across studies) is provided in footnotes. The corresponding risk (and its 95% confidence interval) is based on the assumed risk in the comparison group and the relative effect of the intervention (and its 95% CI). | ||||||
| GRADE Working Group grades of evidence | ||||||
| 1. The quality of the evidence was downgraded two levels for major study limitations resulting in very serious risk of bias (including selection bias (1 trial) and performance bias (all 3 trials)), and one level for indirectness (this reflects the clinical heterogeneity such as variation in the interventions and outcome measures and measurement, and the generally inadequate description of these). There was, however, no statistical heterogeneity in the pooled data. 2. One trial reported WOMAC functional scores (0 to 68; higher values mean worse function) at six weeks and the other the results of a modified version of the Knee Function Scale (0 to 53; higher values mean better function) at 12 weeks. 3. The quality of the evidence was downgraded two levels for major study limitations resulting in very serious risk of bias (including selection bias (1 trial) and performance bias (both trials)), and one level for imprecision (wide confidence intervals and limited data). 4. Data on resumption of sports activities were not split by treatment group in one trial (35 participants). 5. The quality of the evidence was downgraded two levels for major study limitations resulting in very serious risk of bias (including performance and detection biases), and one level for indirectness (abandonment of military training may be for other reasons than serious knee pain). 6. The single study recording this outcome did not record complications for all groups. The follow‐up for complications appeared be during use; i.e. the basic military training programme of 14 weeks.. 7. The quality of the evidence was downgraded two levels for major study limitations resulting in very serious risk of bias (including performance and detection biases and serious unit of analyses issues relating to the inclusion of participants with anterior knee pain in both knees), and imprecision (incomplete data from one small trial). | ||||||
| Outcome or subgroup title | No. of studies | No. of participants | Statistical method | Effect size |
| 1 Pain during activity (0 to 10; higher score means worse pain) Show forest plot | 3 | 234 | Mean Difference (IV, Fixed, 95% CI) | ‐0.46 [‐1.16, 0.24] |
| 1.1 Knee sleeve | 3 | 162 | Mean Difference (IV, Fixed, 95% CI) | ‐0.48 [‐1.31, 0.35] |
| 1.2 Patellar strap | 1 | 23 | Mean Difference (IV, Fixed, 95% CI) | ‐1.09 [‐3.71, 1.53] |
| 1.3 Knee brace | 1 | 49 | Mean Difference (IV, Fixed, 95% CI) | ‐0.20 [‐1.68, 1.28] |
| 2 Pain scores (0 to 10; higher score means worse pain) Show forest plot | 3 | Mean Difference (IV, Fixed, 95% CI) | Subtotals only | |
| 2.1 Knee orthosis (any) | 3 | 234 | Mean Difference (IV, Fixed, 95% CI) | ‐0.46 [‐1.16, 0.24] |
| 2.2 Sensitivity analysis (knees). Knee orthosis (any) | 3 | 276 | Mean Difference (IV, Fixed, 95% CI) | ‐0.41 [‐1.04, 0.23] |
| 3 Different pain scores (0 to 10; higher score means worse pain) at 12 weeks Show forest plot | 1 | Mean Difference (IV, Fixed, 95% CI) | Subtotals only | |
| 3.1 Pain during activity | 1 | 97 | Mean Difference (IV, Fixed, 95% CI) | ‐0.15 [‐1.20, 0.90] |
| 3.2 Sensitivity analysis (knees). Pain during activity | 1 | 139 | Mean Difference (IV, Fixed, 95% CI) | ‐0.15 [‐1.02, 0.72] |
| 3.3 Pain 1 hour after sporting activity | 1 | 97 | Mean Difference (IV, Fixed, 95% CI) | 0.75 [‐0.19, 1.69] |
| 3.4 Sensitivity analysis (knees). Pain 1 hour after sporting activity | 1 | 139 | Mean Difference (IV, Fixed, 95% CI) | 0.75 [‐0.04, 1.53] |
| 3.5 Pain after 30 minutes sitting with knees flexed | 1 | 97 | Mean Difference (IV, Fixed, 95% CI) | 0.25 [‐0.82, 1.32] |
| 3.6 Sensitivity analysis (knees). Pain after sitting with knees flexed | 1 | 139 | Mean Difference (IV, Fixed, 95% CI) | 0.25 [‐0.64, 1.14] |
| 4 Excellent or good results in terms of reduction in symptoms Show forest plot | 1 | Risk Ratio (M‐H, Fixed, 95% CI) | Totals not selected | |
| 4.1 At 12 weeks | 1 | Risk Ratio (M‐H, Fixed, 95% CI) | 0.0 [0.0, 0.0] | |
| 4.2 At 12 months | 1 | Risk Ratio (M‐H, Fixed, 95% CI) | 0.0 [0.0, 0.0] | |
| 5 Functional scores (higher score means higher function) Show forest plot | 2 | Std. Mean Difference (IV, Fixed, 95% CI) | Subtotals only | |
| 5.1 Knee orthosis (any) | 2 | 183 | Std. Mean Difference (IV, Fixed, 95% CI) | ‐0.25 [‐0.55, 0.05] |
| 5.2 Sensitivity analysis (knees): Knee orthosis (any) | 2 | 225 | Std. Mean Difference (IV, Fixed, 95% CI) | ‐0.28 [‐0.55, ‐0.01] |
| 6 Discontinuation of a basic military training programme Show forest plot | 1 | Risk Ratio (M‐H, Fixed, 95% CI) | Totals not selected | |
| Outcome or subgroup title | No. of studies | No. of participants | Statistical method | Effect size |
| 1 Pain score (0 to 10: higher score means worse pain) Show forest plot | 2 | Mean Difference (IV, Fixed, 95% CI) | Totals not selected | |
| 1.1 Patellar strap versus knee sleeve | 1 | Mean Difference (IV, Fixed, 95% CI) | 0.0 [0.0, 0.0] | |
| 1.2 Knee brace versus knee sleeve | 1 | Mean Difference (IV, Fixed, 95% CI) | 0.0 [0.0, 0.0] | |
| 1.3 Knee brace versus knee sleeve (sensitivity analysis: knees) | 1 | Mean Difference (IV, Fixed, 95% CI) | 0.0 [0.0, 0.0] | |
| 1.4 Knee brace versus knee sleeve | 1 | Mean Difference (IV, Fixed, 95% CI) | 0.0 [0.0, 0.0] | |
| 1.5 Knee brace versus knee sleeve (sensitivity analysis: knees) | 1 | Mean Difference (IV, Fixed, 95% CI) | 0.0 [0.0, 0.0] | |
| 2 Functional score (0 to 53: higher scores means greater function) Show forest plot | 1 | Mean Difference (IV, Fixed, 95% CI) | Totals not selected | |
| 2.1 Knee brace versus knee sleeve | 1 | Mean Difference (IV, Fixed, 95% CI) | 0.0 [0.0, 0.0] | |
| 2.2 Knee brace versus knee sleeve (sensitivity analysis: knees) | 1 | Mean Difference (IV, Fixed, 95% CI) | 0.0 [0.0, 0.0] | |
| 3 Discontinuation of a basic military training programme Show forest plot | 1 | Risk Ratio (M‐H, Fixed, 95% CI) | Totals not selected | |
| 3.1 Patellar strap versus knee sleeve | 1 | Risk Ratio (M‐H, Fixed, 95% CI) | 0.0 [0.0, 0.0] | |
| 4 Complications Show forest plot | 1 | Risk Ratio (M‐H, Fixed, 95% CI) | Totals not selected | |
| 4.1 Knee sleeve and patella ring versus knee sleeve without patellar ring | 1 | Risk Ratio (M‐H, Fixed, 95% CI) | 0.0 [0.0, 0.0] | |
| Outcome or subgroup title | No. of studies | No. of participants | Statistical method | Effect size |
| 1 Pain during activity (0 to 10: higher score means worse pain) Show forest plot | 1 | Mean Difference (IV, Fixed, 95% CI) | Totals not selected | |
| 1.1 Pain score during sporting activity | 1 | Mean Difference (IV, Fixed, 95% CI) | 0.0 [0.0, 0.0] | |
| 1.2 Pain score 1 hour after sporting activity | 1 | Mean Difference (IV, Fixed, 95% CI) | 0.0 [0.0, 0.0] | |
| 1.3 Pain score following 30 minutes of sitting with knees flexed | 1 | Mean Difference (IV, Fixed, 95% CI) | 0.0 [0.0, 0.0] | |
| 2 Sensitivity analyses (knees): Pain during activity (0 to 10: higher score means worse pain) Show forest plot | 1 | Mean Difference (IV, Fixed, 95% CI) | Totals not selected | |
| 2.1 Pain score during sporting activity | 1 | Mean Difference (IV, Fixed, 95% CI) | 0.0 [0.0, 0.0] | |
| 2.2 Pain score 1 hour after sporting activity | 1 | Mean Difference (IV, Fixed, 95% CI) | 0.0 [0.0, 0.0] | |
| 2.3 Pain score following 30 minutes of sitting with knees flexed | 1 | Mean Difference (IV, Fixed, 95% CI) | 0.0 [0.0, 0.0] | |
| 3 Functional scores (0 to 53: higher scores means greater function) Show forest plot | 1 | Mean Difference (IV, Fixed, 95% CI) | Totals not selected | |
| 3.1 Participants = denominators | 1 | Mean Difference (IV, Fixed, 95% CI) | 0.0 [0.0, 0.0] | |
| 3.2 Sensitivity analysis (knees) | 1 | Mean Difference (IV, Fixed, 95% CI) | 0.0 [0.0, 0.0] | |