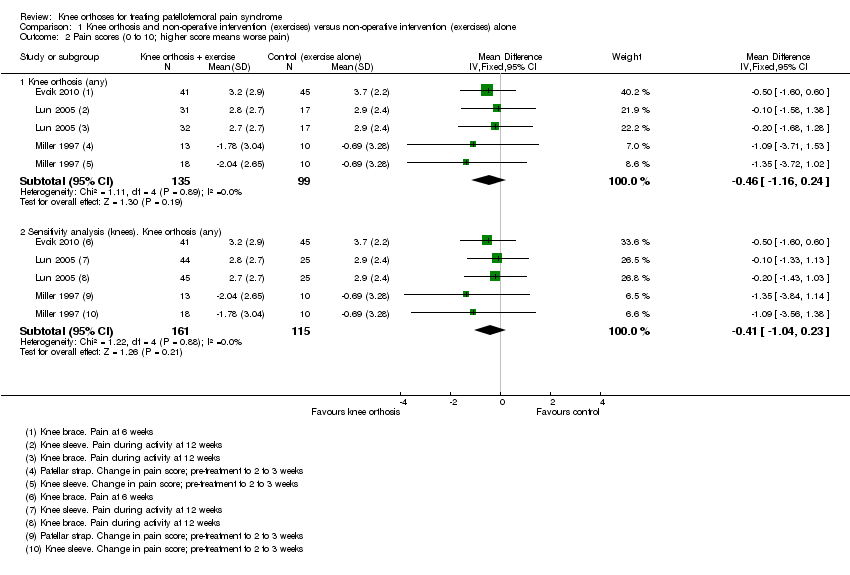
| 1 Pain during activity (0 to 10; higher score means worse pain) Show forest plot | 3 | 234 | Mean Difference (IV, Fixed, 95% CI) | ‐0.46 [‐1.16, 0.24] |
|
| 1.1 Knee sleeve | 3 | 162 | Mean Difference (IV, Fixed, 95% CI) | ‐0.48 [‐1.31, 0.35] |
| 1.2 Patellar strap | 1 | 23 | Mean Difference (IV, Fixed, 95% CI) | ‐1.09 [‐3.71, 1.53] |
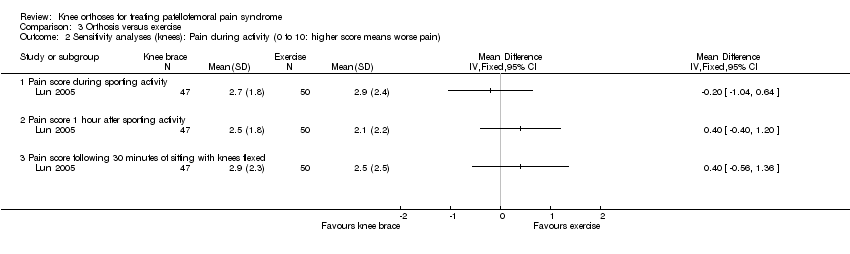
| 1.3 Knee brace | 1 | 49 | Mean Difference (IV, Fixed, 95% CI) | ‐0.20 [‐1.68, 1.28] |
| 2 Pain scores (0 to 10; higher score means worse pain) Show forest plot | 3 | | Mean Difference (IV, Fixed, 95% CI) | Subtotals only |
|
| 2.1 Knee orthosis (any) | 3 | 234 | Mean Difference (IV, Fixed, 95% CI) | ‐0.46 [‐1.16, 0.24] |
| 2.2 Sensitivity analysis (knees). Knee orthosis (any) | 3 | 276 | Mean Difference (IV, Fixed, 95% CI) | ‐0.41 [‐1.04, 0.23] |
| 3 Different pain scores (0 to 10; higher score means worse pain) at 12 weeks Show forest plot | 1 | | Mean Difference (IV, Fixed, 95% CI) | Subtotals only |
|
| 3.1 Pain during activity | 1 | 97 | Mean Difference (IV, Fixed, 95% CI) | ‐0.15 [‐1.20, 0.90] |
| 3.2 Sensitivity analysis (knees). Pain during activity | 1 | 139 | Mean Difference (IV, Fixed, 95% CI) | ‐0.15 [‐1.02, 0.72] |
| 3.3 Pain 1 hour after sporting activity | 1 | 97 | Mean Difference (IV, Fixed, 95% CI) | 0.75 [‐0.19, 1.69] |
| 3.4 Sensitivity analysis (knees). Pain 1 hour after sporting activity | 1 | 139 | Mean Difference (IV, Fixed, 95% CI) | 0.75 [‐0.04, 1.53] |
| 3.5 Pain after 30 minutes sitting with knees flexed | 1 | 97 | Mean Difference (IV, Fixed, 95% CI) | 0.25 [‐0.82, 1.32] |
| 3.6 Sensitivity analysis (knees). Pain after sitting with knees flexed | 1 | 139 | Mean Difference (IV, Fixed, 95% CI) | 0.25 [‐0.64, 1.14] |
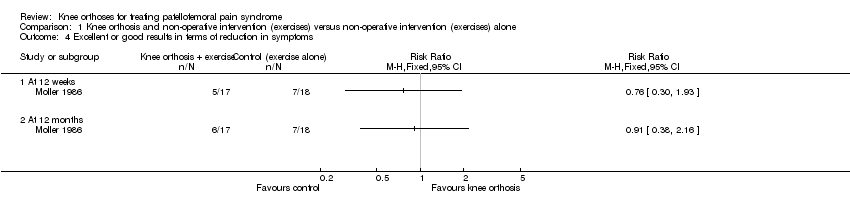
| 4 Excellent or good results in terms of reduction in symptoms Show forest plot | 1 | | Risk Ratio (M‐H, Fixed, 95% CI) | Totals not selected |
|
| 4.1 At 12 weeks | 1 | | Risk Ratio (M‐H, Fixed, 95% CI) | 0.0 [0.0, 0.0] |
| 4.2 At 12 months | 1 | | Risk Ratio (M‐H, Fixed, 95% CI) | 0.0 [0.0, 0.0] |
| 5 Functional scores (higher score means higher function) Show forest plot | 2 | | Std. Mean Difference (IV, Fixed, 95% CI) | Subtotals only |
|
| 5.1 Knee orthosis (any) | 2 | 183 | Std. Mean Difference (IV, Fixed, 95% CI) | ‐0.25 [‐0.55, 0.05] |
| 5.2 Sensitivity analysis (knees): Knee orthosis (any) | 2 | 225 | Std. Mean Difference (IV, Fixed, 95% CI) | ‐0.28 [‐0.55, ‐0.01] |
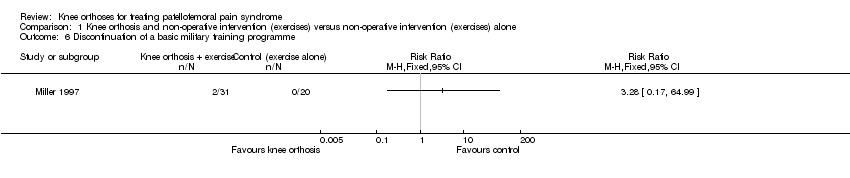
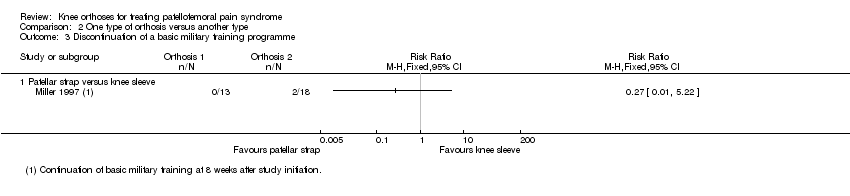
| 6 Discontinuation of a basic military training programme Show forest plot | 1 | | Risk Ratio (M‐H, Fixed, 95% CI) | Totals not selected |
|