Trabeculectomía modificada con dispositivos para el glaucoma
Información
- DOI:
- https://doi.org/10.1002/14651858.CD010472.pub2Copiar DOI

- Base de datos:
-
- Cochrane Database of Systematic Reviews
- Versión publicada:
-
- 01 diciembre 2015see what's new
- Tipo:
-
- Intervention
- Etapa:
-
- Review
- Grupo Editorial Cochrane:
-
Grupo Cochrane de Salud ocular y de la visión
- Copyright:
-
- Copyright © 2015 The Cochrane Collaboration. Published by John Wiley & Sons, Ltd.
Cifras del artículo
Altmetric:
Citado por:
Autores
Contributions of authors
XW conceived and designed the review, screened the search results, assessed trial quality, extracted and entered data, analyzed data and wrote the main text of the review.
RK assessed trial quality, extracted data, participated in the adjudication process, co‐authored the Agreements and disagreements with other studies or reviews section, and helped edit and revise the main text of the review.
AC conceived and designed the review, advised on data interpretations and provided substantial comments on the content of the review.
Sources of support
Internal sources
-
No sources of support supplied
External sources
-
National Eye Institute, National Institutes of Health, USA.
Xue Wang was supported by the Cochrane Eyes and Vision Group US Project, funded by the National Eye Institute Grant 1 U01 EY020522
-
National Institute for Health Research (NIHR), UK.
-
Richard Wormald, Co‐ordinating Editor for Cochrane Eyes and Vision (CEV) acknowledges financial support for his CEV research sessions from the Department of Health through the award made by the National Institute for Health Research to Moorfields Eye Hospital NHS Foundation Trust and UCL Institute of Ophthalmology for a Specialist Biomedical Research Centre for Ophthalmology.
-
The NIHR also funds the CEV Editorial Base in London.
The views expressed in this publication are those of the authors and not necessarily those of the NIHR, NHS, or the Department of Health.
-
Declarations of interest
AC reports grants unrelated to this work from the National Eye Institute, National Institutes of Health, US and the Agency for Healthcare Research and Quality (AHRQ), US. The AHRQ Comparativeness Effectiveness of glaucoma treatment trial is an observational study on the management of glaucoma patients with additional medications, laser trabeculoplasty, or incisional surgery. Modified trabeculectomies are one of the types of incisional surgeries allowed in the trial if the treating physician and patient choose that method to lower eye pressures. Since the study is observational, AC has no role in which treatment modality is chosen.
XW: None known.
RK: None known.
Acknowledgements
We acknowledge Lori Rosman, Trials Search Co‐ordinator for the US Satellite of Cochrane Eyes and Vision (CEV), for developing the search strategy and executing the electronic searches. We thank Sueko M Ng and Dongyu Zhang for their help with screening titles/abstracts and data extraction for the Chinese studies. We thank Andrew Law for his edits and revision of the main text of the review. We also acknowledge the CEV editorial team and the peer reviewers Barbara Hawkins, Kuang Hu, and Brian Song for their insightful comments during the preparation of this review. We thank Guy Ben Simon and his group for sharing their trial data (Dahan 2012).
Version history
| Published | Title | Stage | Authors | Version |
| 2023 Mar 13 | Device‐modified trabeculectomy for glaucoma | Review | Junghyun Park, Thanitsara Rittiphairoj, Xue Wang, Jian-Yu E, Amanda K Bicket | |
| 2015 Dec 01 | Device‐modified trabeculectomy for glaucoma | Review | Xue Wang, Rabeea Khan, Anne Coleman | |
| 2013 Apr 30 | Device modified trabeculectomy for glaucoma | Protocol | Xue Wang, Ruidi Wang, Anne Coleman | |
Differences between protocol and review
1. We planned to assess mean change of IOP from baseline between the two groups. However, as in most cases mean change of IOP was not reported in individual studies, we used postoperative IOP as a surrogate. This may result in some bias because of the differences in baseline IOPs in participants in a few studies.
2. For amniotic membrane studies, losses to follow‐up were not reported in a majority of studies (11/18), and we used the number randomized in the analyses. This may bias the analyses as those participants lost to follow‐up did not contribute to the outcome measurements.
3. For the Ologen studies, one study compared trabeculectomy without MMC versus trabeculectomy and Ologen (Papaconstantinou 2010). The other seven studies were included in the meta‐analysis to give a broader view, but the lack of the use of MMC in one study may have reduced the success rate of the trabeculectomy‐alone group in comparison to the trabeculectomy‐with‐Ologen group. This may have made the trabeculectomy‐with‐Ologen group appear better at IOP reduction than it is.
4. For amniotic membrane studies, three studies only used MMC in the trabeculectomy group but not in the amniotic membrane group (Cho 2013; Khairy 2015; Zheng 2005). Although both MMC and amniotic membrane affect wound healing, whether amniotic membrane can substitute for MMC is unknown. To ensure comparability, MMC should either have been used in both groups, or should not have been used at all. The impact of this on the outcome is unknown.
5. For complications reported for each study, the time of measurement may be different. We combined them in the analyses, based on the assumption that most complications occur within a short time after the surgery. These data should be interpreted with caution.
Keywords
MeSH
Medical Subject Headings (MeSH) Keywords
- *Glaucoma Drainage Implants;
- Amnion [transplantation];
- Biocompatible Materials;
- Collagen [therapeutic use];
- Gelatin [therapeutic use];
- Glaucoma [*surgery];
- Glycosaminoglycans [therapeutic use];
- Intraocular Pressure;
- Polytetrafluoroethylene [therapeutic use];
- Randomized Controlled Trials as Topic;
- Trabeculectomy [*instrumentation, methods];
- Visual Acuity;
Medical Subject Headings Check Words
Humans;
PICO
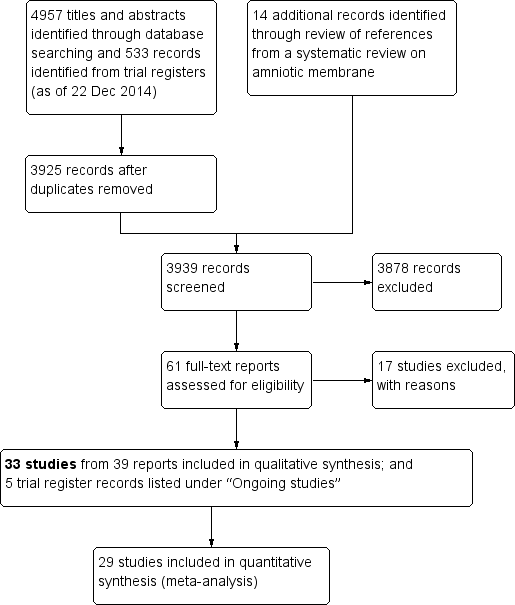
Study flow diagram.

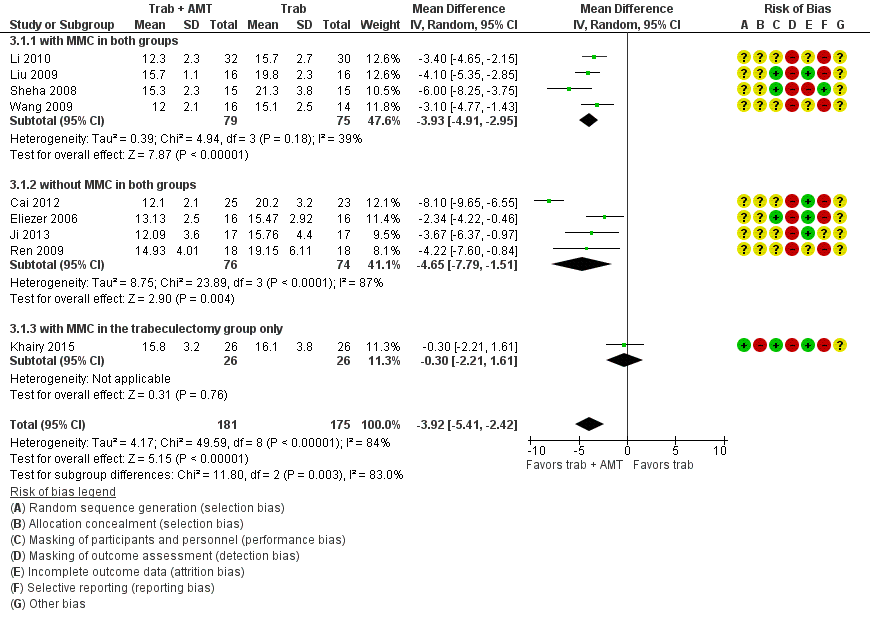
Risk of bias summary: review authors' judgements about each risk of bias item for each included study.

Forest plot of comparison: 2 Trabeculectomy + Ex‐PRESS versus Trabeculectomy, outcome: Postoperative IOP at one year.
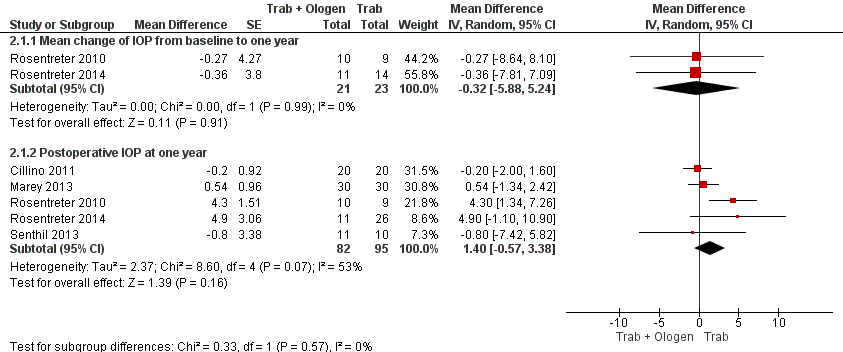
Forest plot of comparison: 2 Trabeculectomy (Trab) + Ologen versus Trabeculectomy (Trab), outcome: 2.1 IOP at one year.
Forest plot of comparison: 4 Trabeculectomy + AMT (amniotic membrane) versus Trabeculectomy, outcome: 4.1 Postoperative IOP at one year.

Forest plot of comparison: 1 Trabeculectomy + E‐PTFE versus Trabeculectomy, outcome: 1.1 Postoperative IOP at one year.

Comparison 1 Trabeculectomy (Trab) + Ex‐PRESS versus Trabeculectomy (Trab), Outcome 1 Postoperative IOP at one year.

Comparison 1 Trabeculectomy (Trab) + Ex‐PRESS versus Trabeculectomy (Trab), Outcome 2 Postoperative IOP at six months.

Comparison 1 Trabeculectomy (Trab) + Ex‐PRESS versus Trabeculectomy (Trab), Outcome 3 Postoperative IOP at two years.

Comparison 1 Trabeculectomy (Trab) + Ex‐PRESS versus Trabeculectomy (Trab), Outcome 4 Postoperative logMAR BCVA at one year.

Comparison 1 Trabeculectomy (Trab) + Ex‐PRESS versus Trabeculectomy (Trab), Outcome 5 Complications.

Comparison 2 Trabeculectomy (Trab) + Ologen versus Trabeculectomy (Trab), Outcome 1 IOP at one year.
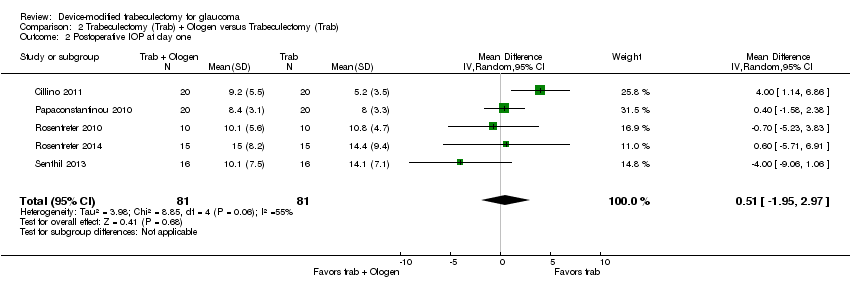
Comparison 2 Trabeculectomy (Trab) + Ologen versus Trabeculectomy (Trab), Outcome 2 Postoperative IOP at day one.

Comparison 2 Trabeculectomy (Trab) + Ologen versus Trabeculectomy (Trab), Outcome 3 Postoperative IOP at six months.

Comparison 2 Trabeculectomy (Trab) + Ologen versus Trabeculectomy (Trab), Outcome 4 Postoperative IOP at two years.
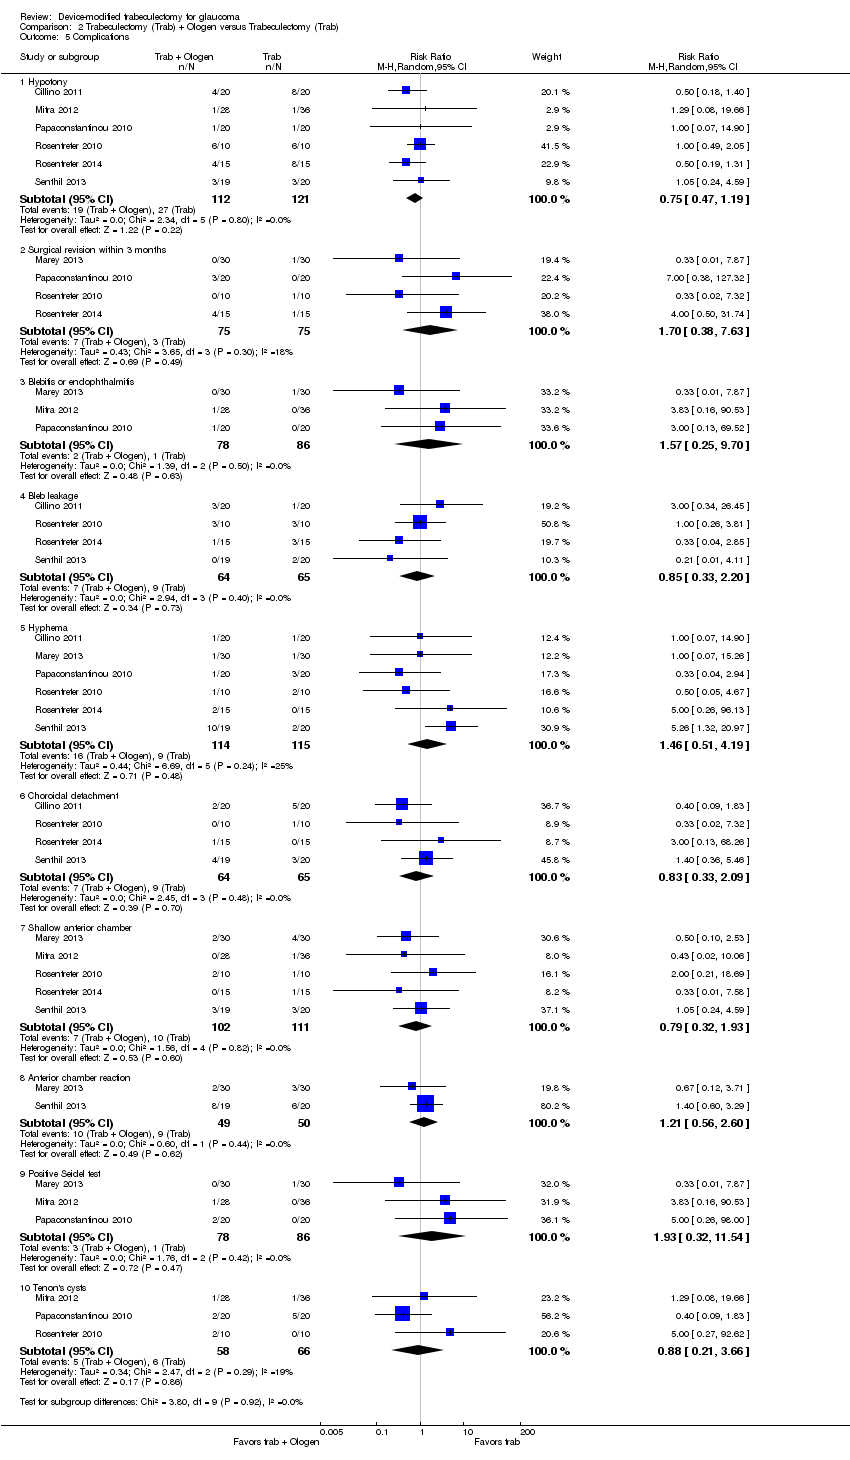
Comparison 2 Trabeculectomy (Trab) + Ologen versus Trabeculectomy (Trab), Outcome 5 Complications.

Comparison 3 Trabeculectomy (Trab) + AMT (amniotic membrane) versus Trabeculectomy (Trab), Outcome 1 Postoperative IOP at one year.

Comparison 3 Trabeculectomy (Trab) + AMT (amniotic membrane) versus Trabeculectomy (Trab), Outcome 2 Postoperative IOP at one day.
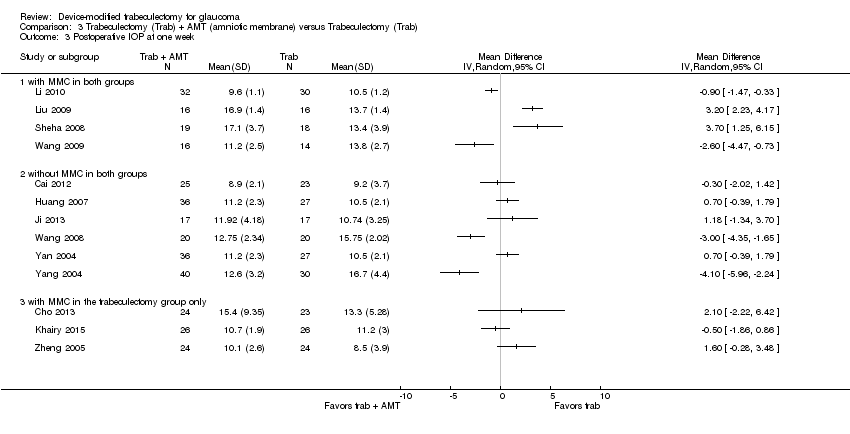
Comparison 3 Trabeculectomy (Trab) + AMT (amniotic membrane) versus Trabeculectomy (Trab), Outcome 3 Postoperative IOP at one week.

Comparison 3 Trabeculectomy (Trab) + AMT (amniotic membrane) versus Trabeculectomy (Trab), Outcome 4 Postoperative IOP at one month.
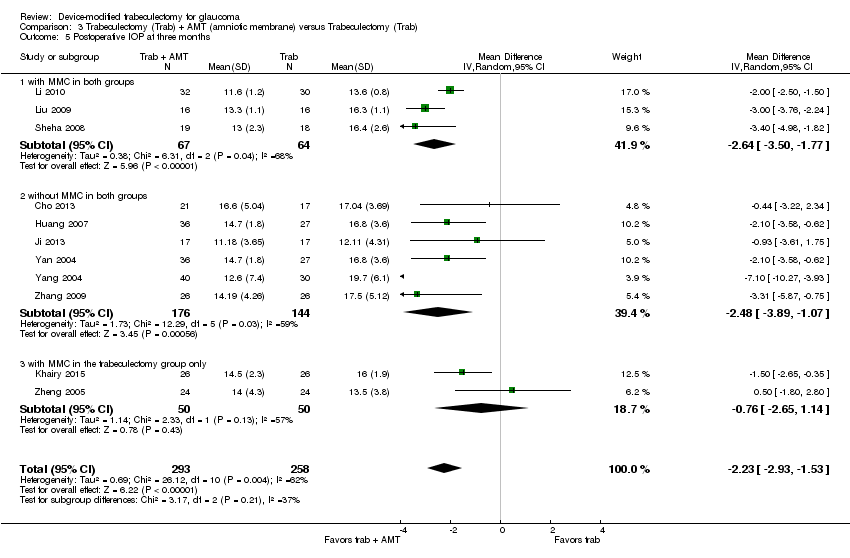
Comparison 3 Trabeculectomy (Trab) + AMT (amniotic membrane) versus Trabeculectomy (Trab), Outcome 5 Postoperative IOP at three months.
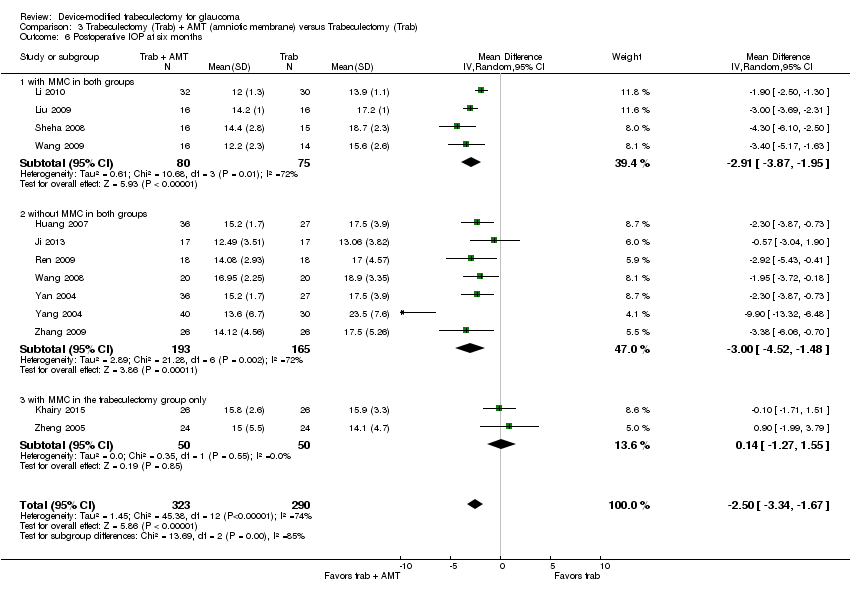
Comparison 3 Trabeculectomy (Trab) + AMT (amniotic membrane) versus Trabeculectomy (Trab), Outcome 6 Postoperative IOP at six months.

Comparison 3 Trabeculectomy (Trab) + AMT (amniotic membrane) versus Trabeculectomy (Trab), Outcome 7 Postoperative IOP at two years.

Comparison 3 Trabeculectomy (Trab) + AMT (amniotic membrane) versus Trabeculectomy (Trab), Outcome 8 Complications.
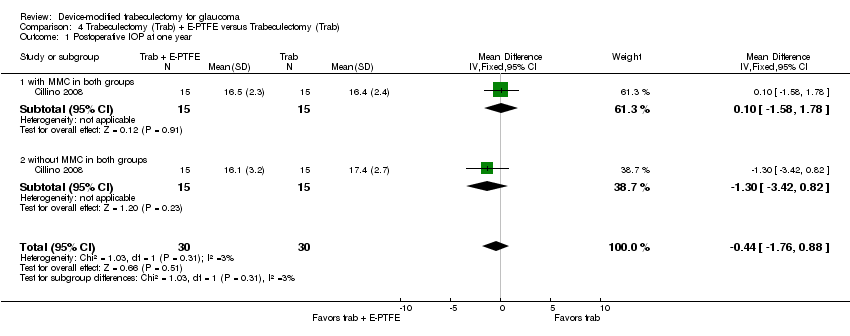
Comparison 4 Trabeculectomy (Trab) + E‐PTFE versus Trabeculectomy (Trab), Outcome 1 Postoperative IOP at one year.

Comparison 4 Trabeculectomy (Trab) + E‐PTFE versus Trabeculectomy (Trab), Outcome 2 Hypotony at 24 months.
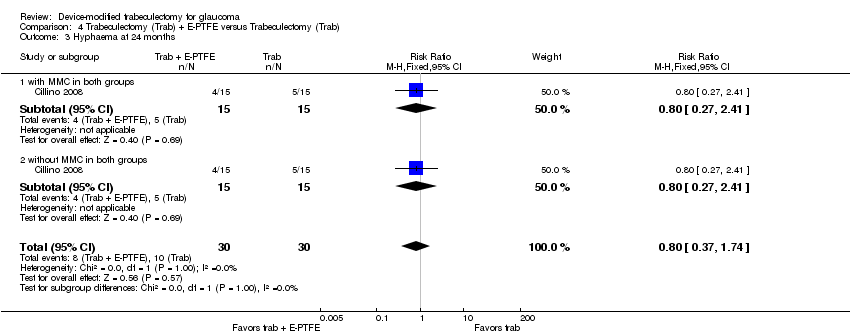
Comparison 4 Trabeculectomy (Trab) + E‐PTFE versus Trabeculectomy (Trab), Outcome 3 Hyphaema at 24 months.
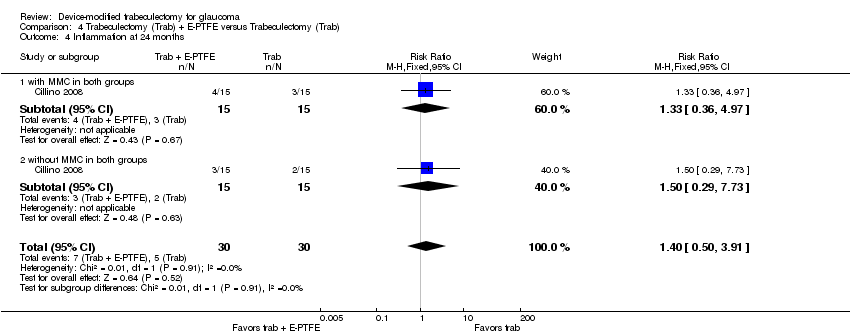
Comparison 4 Trabeculectomy (Trab) + E‐PTFE versus Trabeculectomy (Trab), Outcome 4 Inflammation at 24 months.
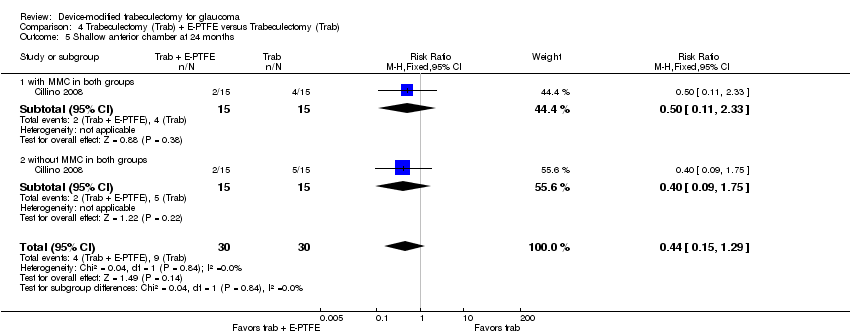
Comparison 4 Trabeculectomy (Trab) + E‐PTFE versus Trabeculectomy (Trab), Outcome 5 Shallow anterior chamber at 24 months.

Comparison 4 Trabeculectomy (Trab) + E‐PTFE versus Trabeculectomy (Trab), Outcome 6 Flat anterior chamber at 24 months.
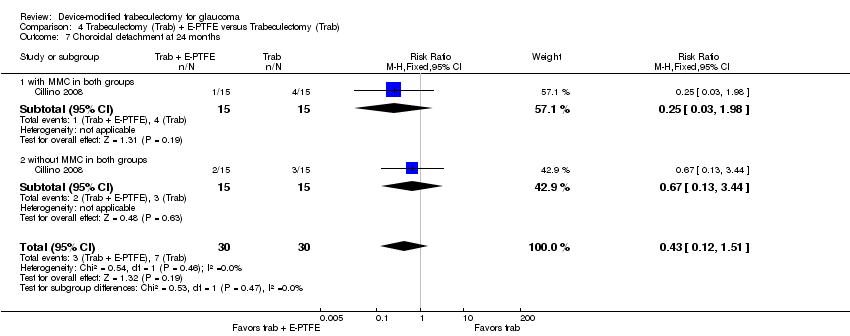
Comparison 4 Trabeculectomy (Trab) + E‐PTFE versus Trabeculectomy (Trab), Outcome 7 Choroidal detachment at 24 months.
| Ex‐PRESS implanted during trabeculectomy compared with trabeculectomy alone for people with open‐angle glaucoma | ||||||
| Patient or population: people with open‐angle glaucoma Settings: ophthalmic surgery Intervention: Ex‐PRESS implanted during trabeculectomy Comparison: trabeculectomy alone | ||||||
| Outcomes | Illustrative comparative risks* (95% CI) | Relative effect | No of Eyes | Quality of the evidence | Comments | |
| Assumed risk | Corresponding risk | |||||
| trabeculectomy alone | Ex‐PRESS | |||||
| Postoperative mean IOP at 1 year | The mean IOP in the trabeculectomy‐alone groups was 13.9 mm Hg, ranged from 11.6 to 16.4 mm Hg | The mean IOP in the Ex‐PRESS groups was | ‐ | 165 | ⊕⊕⊝⊝ | ‐ |
| Postoperative mean logMAR BCVA at 1 year | The mean logMAR BCVA in the trabeculectomy‐alone groups was 0.59, ranged from 0.43 to 0.80 | The mean logMAR BCVA in the Ex‐PRESS groups was | ‐ | 90 | ⊕⊝⊝⊝ | ‐ |
| Complication as defined in protocol‐ Hypotony Follow‐up: ranged from 1 to 5 years | 565 per 1000 | 520 per 1000 (356 to 751) | RR 0.92 (0.63 to 1.33) | 94 (2 studies) | ⊕⊝⊝⊝ | ‐ |
| Other complications reported by included studies | ||||||
| Shallow/flat anterior chamber Follow‐up: ranged from 1 to 5 years | 150 per 1000 | 108 per 1000 | RR 0.72 (0.40 to 1.32) | 294 | ⊕⊝⊝⊝ | ‐ |
| Bleb leakage Follow‐up: ranged from 1 to 5 years | 48 per 1000 | 60 per 1000 | RR 1.26 (0.50 to 3.20) | 294 | ⊕⊝⊝⊝ | ‐ |
| Hyphema Follow‐up: ranged from 1 to 5 years | 82 per 1000 | 27 per 1000 | RR 0.33 (0.12 to 0.94) | 294 | ⊕⊕⊝⊝ | ‐ |
| Cataract surgery Follow‐up: ranged from 1 to 5 years | 152 per 1000 | 49 per 1000 | RR 0.32 (0.14 to 0.74) | 264 | ⊕⊕⊝⊝ | ‐ |
| *The basis for the assumed risk (e.g. the median control group risk across studies) is provided in footnotes. The corresponding risk (and its 95% confidence interval) is based on the assumed risk in the comparison group and the relative effect of the intervention (and its 95% CI). | ||||||
| GRADE Working Group grades of evidence | ||||||
| 1Downgraded for limitations in the design and implementation of available studies suggesting high likelihood of bias (‐1); high likelihood that studies did not mask outcome assessors. | ||||||
| Ologen implanted during trabeculectomy compared with trabeculectomy alone for people with glaucoma | ||||||
| Patient or population: people with glaucoma, including open‐angle, angle‐closure, and uncontrolled IOP Settings: ophthalmic surgery Intervention: Ologen implanted during trabeculectomy Comparison: trabeculectomy alone | ||||||
| Outcomes | Illustrative comparative risks* (95% CI) | Relative effect | No of Eyes | Quality of the evidence | Comments | |
| Assumed risk | Corresponding risk | |||||
| trabeculectomy alone | Ologen | |||||
| Postoperative mean IOP at 1 year | The mean IOP in the trabeculectomy‐alone groups was 15.2 mm Hg, ranged from 11 to 19.3 mm Hg. | The mean IOP in the Ologen groups was | ‐ | 177 | ⊕⊝⊝⊝ | Analyzed using the generic inverse method |
| Postoperative mean logMAR BCVA at 1 year | See comment. | See comment. | ‐ | ‐ | ‐ | Senthil 2013 reported BCVA for 32 eyes at 6 weeks post‐surgery: MD ‐0.24 logMAR, 95% CI ‐0.58 to 0.10 |
| Complication as defined in protocol‐ Hypotony Follow‐up: ranged from 6 to 24 months | 223 per 1000 | 167 per 1000 | RR 0.75 (0.47 to 1.19) | 233 | ⊕⊝⊝⊝ | ‐ |
| Other complications reported by included studies | ||||||
| Shallow anterior chamber Follow‐up: ranged from 6 to 24 months | 90 per 1000 | 71 per 1000 | RR 0.79 (0.32 to 1.93) | 213 | ⊕⊝⊝⊝ | ‐ |
| Bleb leakage Follow‐up: ranged from 6 to 24 months | 138 per 1000 | 117 per 1000 | RR 0.85 (0.33 to 2.20) | 129 | ⊕⊝⊝⊝ | ‐ |
| Hyphema Follow‐up: ranged from 6 to 24 months | 78 per 1000 | 114 per 1000 | RR 1.46 (0.51 to 4.19) | 229 | ⊕⊝⊝⊝ | ‐ |
| Surgical revision Follow‐up: ranged from 6 to 24 months | 40 per 1000 | 68 per 1000 (15 to 305) | RR 1.70 (0.38 to 7.63) | 150 (4 studies) | ⊕⊝⊝⊝ | ‐ |
| *The basis for the assumed risk (e.g. the median control group risk across studies) is provided in footnotes. The corresponding risk (and its 95% confidence interval) is based on the assumed risk in the comparison group and the relative effect of the intervention (and its 95% CI). | ||||||
| GRADE Working Group grades of evidence | ||||||
| 1Downgraded for limitations in the design and implementation of available studies suggesting high likelihood of bias (‐1); high likelihood that studies did not mask outcome assessors. | ||||||
| Amniotic membrane implanted during trabeculectomy compared with trabeculectomy alone for people with glaucoma | ||||||
| Patient or population: people with glaucoma, including open‐angle, angle‐closure, uncontrolled IOP, and refractive glaucoma Settings: ophthalmic surgery Intervention: Amniotic membrane implanted during trabeculectomy Comparison: trabeculectomy alone | ||||||
| Outcomes | Illustrative comparative risks* (95% CI) | Relative effect | No of Eyes | Quality of the evidence | Comments | |
| Assumed risk | Corresponding risk | |||||
| trabeculectomy alone | amniotic membrane | |||||
| Postoperative mean IOP at 1 year | The mean IOP in the trabeculectomy alone groups was 17.6 mm Hg, ranged from 15.1 to 19.8 mm Hg. | The mean IOP in the Ologen groups was | ‐ | 356 | ⊕⊕⊝⊝ | |
| Postoperative mean logMAR BCVA at 1 year | See comment. | See comment. | Only 1 study reported this outcome; the amniotic membrane group had statistically significantly better BCVA than the trabeculectomy group, but no data for between‐group difference were provided | |||
| Complications ‐ Hypotony Follow‐up: ranged from 3 to 24 months | 206 per 1000 | 82 per 1000 | RR 0.40 (0.17 to 0.94) | 205 | ⊕⊕⊝⊝ | ‐ |
| Other complications reported by included studies | ||||||
| Complications ‐ Shallow anterior chamber Follow‐up: ranged from 3 to 24 months | 240 per 1000 | 113 per 1000 | RR 0.47 (0.30 to 0.73) | 632 | ⊕⊕⊝⊝ | ‐ |
| Complications ‐ Bleb leakage Follow‐up: ranged from 3 to 24 months | 327 per 1000 | 91 per 1000 | RR 0.28 (0.10 to 0.79) | 98 | ⊕⊕⊝⊝ | ‐ |
| Complications ‐ Hyphema Follow‐up: ranged from 3 to 24 months | 91 per 1000 | 39 per 1000 | RR 0.43 (0.14 to 1.34) | 235 | ⊕⊝⊝⊝ | ‐ |
| Complications ‐ Surgical revision Follow‐up: ranged from 3 to 24 months | See comment. | See comment. | ‐ | ‐ | None of the studies reported this outcome. | |
| *The basis for the assumed risk (e.g. the median control group risk across studies) is provided in footnotes. The corresponding risk (and its 95% confidence interval) is based on the assumed risk in the comparison group and the relative effect of the intervention (and its 95% CI). | ||||||
| GRADE Working Group grades of evidence | ||||||
| 1Downgraded for limitations in the design and implementation of available studies suggesting high likelihood of bias (‐1); high likelihood that studies did not mask outcome assessors. | ||||||
| Device | Study ID | Study design | Country | Participant diagnosis | Interventions | Total number of participants randomized | Total number of eyes randomized | Total number of eyes analyzed | Longest follow‐up period (months) |
| Ex‐PRESS | RCT, paired‐eye design | South Africa | POAG | Trab + MMC Trab + MMC + Ex‐PRESS | 15 | 30 | 30 | 12 | |
| De Jong 2005 (abstract) | RCT, parallel‐group design | The Netherlands | OAG | Trab + Ex‐PRESS under a scleral flap Trab Trab + Ex‐PRESS under conjunctiva | 109 | 120 | N/A | 6 | |
| RCT, parallel‐group design | The Netherlands | OAG | Trab Trab + Ex‐PRESS | 78 | 78 | 78 | 60 | ||
| RCT, parallel‐group design | USA | OAG | Trab + MMC Trab + MMC + Ex‐PRESS | 120 | 120 | 114 | 24 | ||
| RCT, parallel‐group design | Canada | OAG, uncontrolled IOP | Trab + MMC Trab + MMC + Ex‐PRESS | 64 | 64 | 60 | 12 | ||
| Subtotal for Ex‐PRESS | 386 | 412 | N/A | Range 6 to 60 months | |||||
| Ologen | RCT, parallel‐group design | Italy | POAG, PEXG, uncontrolled IOP | Trab + MMC Trab + Ologen | 40 | 40 | 40 | 24 | |
| RCT, parallel‐group design | India | OAG | Trab + MMC Trab + Ologen | 40 | 40 | 40 | 12 | ||
| RCT, parallel‐group design | Egypt | POAG, ACG, PEXG, uveitic glaucoma, uncontrolled pseudophakic glaucoma | Trab + MMC Trab + Ologen | 60 | 60 | 60 | 12 | ||
| RCT, parallel‐group design | India | Uncontrolled OAG | Trab + MMC Trab + Ologen | 64 | 64 | N/A | 6 | ||
| RCT, parallel‐group design | Greece | glaucoma | Trab Trab + Ologen | 40 | 40 | 40 | 6 | ||
| RCT, parallel‐group design | Germany | OAG, uncontrolled IOP | Trab + MMC Trab + Ologen | 20 | 20 | 20 | 12 | ||
| RCT, parallel‐group design | Germany | OAG, uncontrolled IOP | Trab + MMC Trab + Ologen | 30 | 30 | 30 | 12 | ||
| RCT, parallel‐group design | India | Uncontrolled POAG or PACG | Trab + MMC Trab + Ologen | 33 | 39 | 32 | 24 | ||
| Subtotal for Ologen | 327 | 333 | N/A | Range 6 to 24 month | |||||
| Amniotic membrane | Bruno 2008 (abstract) | RCT, parallel‐group design | N/A | OAG and failed surgery | Trab + MMC Trab + MMC + AMT | 19 | N/A | N/A | 6 |
| RCT, parallel‐group design | China | Refractory glaucoma | Trab Trab + AMT | 40 | 48 | 48 | 12 | ||
| RCT, parallel‐group design | China | POAG, ACG, uncontrolled IOP | Trab + MMC Trab + AMT | 47 | 52 | 39 | 3 | ||
| RCT, parallel‐group design | Brazil | POAG | Trab Trab + AMT | 32 | 32 | N/A | 12 | ||
| RCT, parallel‐group design | China | PACG | Trab Trab + AMT | 50 | 63 | N/A | 6 | ||
| RCT, paired‐eye design | China | Uncontrolled glaucoma | Trab Trab + AMT | 17 | 34 | N/A | 24 | ||
| RCT, parallel‐group design | Egypt | OAG | Trab + MMC Trab + AMT | 52 | 52 | 52 | 24 | ||
| RCT, parallel‐group design | China | Refractory glaucoma | Trab + MMC Trab + MMC + AMT | 50 | 62 | N/A | 12 | ||
| RCT, parallel‐group design | China | Refractory glaucoma | Trab + MMC Trab + MMC + AMT | 35 | 35 | 32 | 12 | ||
| RCT | China | ACG | Trab Trab + AMT | 30 | 36 | N/A | 12 | ||
| RCT, parallel‐group design | Saudi Arabia | Refractory glaucoma | Trab + MMC Trab + MMC + AMT | 37 | 37 | 30 | 12 | ||
| RCT | Greece | POAG, uncontrolled IOP | Trab Trab + AMT | 50 | 59 | 52 | 24 | ||
| RCT, parallel‐group design | China | glaucoma | Trab Trab + AMT | 40 | 40 | N/A | 12 | ||
| RCT | China | Refractory glaucoma | Trab Trab + MMC Trab + MMC + AMT | 38 | 44 | N/A | 12 | ||
| RCT | China | PACG | Trab Trab + AMT | 52 | 63 | 63 | 6 | ||
| RCT, parallel‐group design | China | glaucoma | Trab Trab + AMT | 70 | 70 | N/A | 6 | ||
| RCT | China | ACG | Trab Trab + AMT | 39 | 52 | N/A | 6 | ||
| RCT | China | POAG, PACG | Trab + MMC Trab + AMT | 28 | 48 | N/A | 12 | ||
| Subtotal for amniotic membrane | 726 | N/A | N/A | Range 3 to 24 months | |||||
| E‐PTFE | RCT, parallel‐group design | Italy | POAG, PEXG, uncontrolled IOP | Trab Trab + MMC Trab + E‐PTFE Trab + MMC + E‐PTFE | 60 | 60 | 60 | 24 | |
| Subtotal for E‐PTFE | 60 | 60 | 60 | 24 | |||||
| Gelfilm | Birt 1998 (abstract) | RCT, parallel‐group design | Not reported | Not reported | Trab Trab + Gelfilm Trab + MMC Trab + MMC + Gelfilm | 43 | N/A | N/A | 12 |
| Subtotal for Gelfilm | 43 | N/A | N/A | 12 | |||||
| Total for all included studies | 1542 | N/A | N/A | Range 3 months to 5 years | |||||
| ACG: angle‐closure glaucoma | |||||||||
| Outcome or subgroup title | No. of studies | No. of participants | Statistical method | Effect size |
| 1 Postoperative IOP at one year Show forest plot | 3 | 165 | Mean Difference (IV, Fixed, 95% CI) | ‐1.58 [‐2.74, ‐0.42] |
| 2 Postoperative IOP at six months Show forest plot | 3 | 205 | Mean Difference (IV, Fixed, 95% CI) | 0.18 [‐0.90, 1.26] |
| 3 Postoperative IOP at two years Show forest plot | 3 | 212 | Mean Difference (IV, Fixed, 95% CI) | ‐1.45 [‐2.52, ‐0.37] |
| 4 Postoperative logMAR BCVA at one year Show forest plot | 2 | 90 | Mean Difference (IV, Fixed, 95% CI) | ‐0.15 [‐0.40, 0.10] |
| 5 Complications Show forest plot | 4 | Risk Ratio (M‐H, Fixed, 95% CI) | Subtotals only | |
| 5.1 Hypotony | 2 | 94 | Risk Ratio (M‐H, Fixed, 95% CI) | 0.92 [0.63, 1.33] |
| 5.2 Shallow/flat anterior chamber | 4 | 294 | Risk Ratio (M‐H, Fixed, 95% CI) | 0.72 [0.40, 1.32] |
| 5.3 Bleb leakage | 4 | 294 | Risk Ratio (M‐H, Fixed, 95% CI) | 1.26 [0.50, 3.20] |
| 5.4 Hyphema | 4 | 294 | Risk Ratio (M‐H, Fixed, 95% CI) | 0.33 [0.12, 0.94] |
| 5.5 Cataract surgery | 3 | 264 | Risk Ratio (M‐H, Fixed, 95% CI) | 0.32 [0.14, 0.74] |
| Outcome or subgroup title | No. of studies | No. of participants | Statistical method | Effect size |
| 1 IOP at one year Show forest plot | 5 | Mean Difference (Random, 95% CI) | Subtotals only | |
| 1.1 Mean change of IOP from baseline to one year | 2 | 44 | Mean Difference (Random, 95% CI) | ‐0.32 [‐5.88, 5.24] |
| 1.2 Postoperative IOP at one year | 5 | 177 | Mean Difference (Random, 95% CI) | 1.40 [‐0.57, 3.38] |
| 2 Postoperative IOP at day one Show forest plot | 5 | 162 | Mean Difference (IV, Random, 95% CI) | 0.51 [‐1.95, 2.97] |
| 3 Postoperative IOP at six months Show forest plot | 7 | Mean Difference (IV, Random, 95% CI) | Subtotals only | |
| 3.1 Change of IOP from baseline to six months | 2 | 46 | Mean Difference (IV, Random, 95% CI) | ‐1.24 [‐6.23, 3.76] |
| 3.2 Postoperative IOP at six months | 5 | 236 | Mean Difference (IV, Random, 95% CI) | 0.43 [‐0.97, 1.84] |
| 4 Postoperative IOP at two years Show forest plot | 2 | 55 | Mean Difference (IV, Fixed, 95% CI) | 0.20 [‐1.29, 1.69] |
| 5 Complications Show forest plot | 7 | Risk Ratio (M‐H, Random, 95% CI) | Subtotals only | |
| 5.1 Hypotony | 6 | 233 | Risk Ratio (M‐H, Random, 95% CI) | 0.75 [0.47, 1.19] |
| 5.2 Surgical revision within 3 months | 4 | 150 | Risk Ratio (M‐H, Random, 95% CI) | 1.70 [0.38, 7.63] |
| 5.3 Blebitis or endophthalmitis | 3 | 164 | Risk Ratio (M‐H, Random, 95% CI) | 1.57 [0.25, 9.70] |
| 5.4 Bleb leakage | 4 | 129 | Risk Ratio (M‐H, Random, 95% CI) | 0.85 [0.33, 2.20] |
| 5.5 Hyphema | 6 | 229 | Risk Ratio (M‐H, Random, 95% CI) | 1.46 [0.51, 4.19] |
| 5.6 Choroidal detachment | 4 | 129 | Risk Ratio (M‐H, Random, 95% CI) | 0.83 [0.33, 2.09] |
| 5.7 Shallow anterior chamber | 5 | 213 | Risk Ratio (M‐H, Random, 95% CI) | 0.79 [0.32, 1.93] |
| 5.8 Anterior chamber reaction | 2 | 99 | Risk Ratio (M‐H, Random, 95% CI) | 1.21 [0.56, 2.60] |
| 5.9 Positive Seidel test | 3 | 164 | Risk Ratio (M‐H, Random, 95% CI) | 1.93 [0.32, 11.54] |
| 5.10 Tenon's cysts | 3 | 124 | Risk Ratio (M‐H, Random, 95% CI) | 0.88 [0.21, 3.66] |
| Outcome or subgroup title | No. of studies | No. of participants | Statistical method | Effect size |
| 1 Postoperative IOP at one year Show forest plot | 9 | 356 | Mean Difference (IV, Random, 95% CI) | ‐3.92 [‐5.41, ‐2.42] |
| 1.1 with MMC in both groups | 4 | 154 | Mean Difference (IV, Random, 95% CI) | ‐3.93 [‐4.91, ‐2.95] |
| 1.2 without MMC in both groups | 4 | 150 | Mean Difference (IV, Random, 95% CI) | ‐4.65 [‐7.79, ‐1.51] |
| 1.3 with MMC in the trabeculectomy group only | 1 | 52 | Mean Difference (IV, Random, 95% CI) | ‐0.30 [‐2.21, 1.61] |
| 2 Postoperative IOP at one day Show forest plot | 8 | Mean Difference (IV, Random, 95% CI) | Totals not selected | |
| 2.1 with MMC in both groups | 2 | Mean Difference (IV, Random, 95% CI) | 0.0 [0.0, 0.0] | |
| 2.2 without MMC in both groups | 4 | Mean Difference (IV, Random, 95% CI) | 0.0 [0.0, 0.0] | |
| 2.3 with MMC in the trabeculectomy group only | 2 | Mean Difference (IV, Random, 95% CI) | 0.0 [0.0, 0.0] | |
| 3 Postoperative IOP at one week Show forest plot | 13 | Mean Difference (IV, Random, 95% CI) | Totals not selected | |
| 3.1 with MMC in both groups | 4 | Mean Difference (IV, Random, 95% CI) | 0.0 [0.0, 0.0] | |
| 3.2 without MMC in both groups | 6 | Mean Difference (IV, Random, 95% CI) | 0.0 [0.0, 0.0] | |
| 3.3 with MMC in the trabeculectomy group only | 3 | Mean Difference (IV, Random, 95% CI) | 0.0 [0.0, 0.0] | |
| 4 Postoperative IOP at one month Show forest plot | 13 | 646 | Mean Difference (IV, Random, 95% CI) | ‐1.05 [‐1.96, ‐0.13] |
| 4.1 with MMC in both groups | 3 | 131 | Mean Difference (IV, Random, 95% CI) | ‐1.06 [‐1.84, ‐0.28] |
| 4.2 without MMC in both groups | 7 | 370 | Mean Difference (IV, Random, 95% CI) | ‐1.78 [‐3.65, 0.10] |
| 4.3 with MMC in the trabeculectomy group only | 3 | 145 | Mean Difference (IV, Random, 95% CI) | 0.44 [‐1.21, 2.09] |
| 5 Postoperative IOP at three months Show forest plot | 11 | 551 | Mean Difference (IV, Random, 95% CI) | ‐2.23 [‐2.93, ‐1.53] |
| 5.1 with MMC in both groups | 3 | 131 | Mean Difference (IV, Random, 95% CI) | ‐2.64 [‐3.50, ‐1.77] |
| 5.2 without MMC in both groups | 6 | 320 | Mean Difference (IV, Random, 95% CI) | ‐2.48 [‐3.89, ‐1.07] |
| 5.3 with MMC in the trabeculectomy group only | 2 | 100 | Mean Difference (IV, Random, 95% CI) | ‐0.76 [‐2.65, 1.14] |
| 6 Postoperative IOP at six months Show forest plot | 13 | 613 | Mean Difference (IV, Random, 95% CI) | ‐2.50 [‐3.34, ‐1.67] |
| 6.1 with MMC in both groups | 4 | 155 | Mean Difference (IV, Random, 95% CI) | ‐2.91 [‐3.87, ‐1.95] |
| 6.2 without MMC in both groups | 7 | 358 | Mean Difference (IV, Random, 95% CI) | ‐3.00 [‐4.52, ‐1.48] |
| 6.3 with MMC in the trabeculectomy group only | 2 | 100 | Mean Difference (IV, Random, 95% CI) | 0.14 [‐1.27, 1.55] |
| 7 Postoperative IOP at two years Show forest plot | 2 | Mean Difference (IV, Fixed, 95% CI) | Subtotals only | |
| 7.1 with MMC in the trabeculectomy group only | 1 | 52 | Mean Difference (IV, Fixed, 95% CI) | ‐0.20 [‐2.16, 1.76] |
| 7.2 without MMC in both groups | 1 | 34 | Mean Difference (IV, Fixed, 95% CI) | ‐2.96 [‐5.52, ‐0.40] |
| 8 Complications Show forest plot | 17 | Risk Ratio (M‐H, Random, 95% CI) | Subtotals only | |
| 8.1 Hypotony | 5 | 205 | Risk Ratio (M‐H, Random, 95% CI) | 0.40 [0.17, 0.94] |
| 8.2 Shallow anterior chamber | 13 | 632 | Risk Ratio (M‐H, Random, 95% CI) | 0.47 [0.30, 0.73] |
| 8.3 Hyphema | 5 | 235 | Risk Ratio (M‐H, Random, 95% CI) | 0.43 [0.14, 1.34] |
| 8.4 Bleb leakage | 2 | 98 | Risk Ratio (M‐H, Random, 95% CI) | 0.28 [0.10, 0.79] |
| 8.5 Encapsulated blebs | 5 | 175 | Risk Ratio (M‐H, Random, 95% CI) | 0.23 [0.08, 0.69] |
| 8.6 Choroidal detachment | 4 | 187 | Risk Ratio (M‐H, Random, 95% CI) | 0.47 [0.13, 1.71] |
| Outcome or subgroup title | No. of studies | No. of participants | Statistical method | Effect size |
| 1 Postoperative IOP at one year Show forest plot | 1 | 60 | Mean Difference (IV, Fixed, 95% CI) | ‐0.44 [‐1.76, 0.88] |
| 1.1 with MMC in both groups | 1 | 30 | Mean Difference (IV, Fixed, 95% CI) | 0.10 [‐1.58, 1.78] |
| 1.2 without MMC in both groups | 1 | 30 | Mean Difference (IV, Fixed, 95% CI) | ‐1.30 [‐3.42, 0.82] |
| 2 Hypotony at 24 months Show forest plot | 1 | 60 | Risk Ratio (M‐H, Fixed, 95% CI) | 0.29 [0.11, 0.77] |
| 2.1 with MMC in both groups | 1 | 30 | Risk Ratio (M‐H, Fixed, 95% CI) | 0.43 [0.14, 1.35] |
| 2.2 without MMC in both groups | 1 | 30 | Risk Ratio (M‐H, Fixed, 95% CI) | 0.14 [0.02, 1.02] |
| 3 Hyphaema at 24 months Show forest plot | 1 | 60 | Risk Ratio (M‐H, Fixed, 95% CI) | 0.8 [0.37, 1.74] |
| 3.1 with MMC in both groups | 1 | 30 | Risk Ratio (M‐H, Fixed, 95% CI) | 0.8 [0.27, 2.41] |
| 3.2 without MMC in both groups | 1 | 30 | Risk Ratio (M‐H, Fixed, 95% CI) | 0.8 [0.27, 2.41] |
| 4 Inflammation at 24 months Show forest plot | 1 | 60 | Risk Ratio (M‐H, Fixed, 95% CI) | 1.4 [0.50, 3.91] |
| 4.1 with MMC in both groups | 1 | 30 | Risk Ratio (M‐H, Fixed, 95% CI) | 1.33 [0.36, 4.97] |
| 4.2 without MMC in both groups | 1 | 30 | Risk Ratio (M‐H, Fixed, 95% CI) | 1.5 [0.29, 7.73] |
| 5 Shallow anterior chamber at 24 months Show forest plot | 1 | 60 | Risk Ratio (M‐H, Fixed, 95% CI) | 0.44 [0.15, 1.29] |
| 5.1 with MMC in both groups | 1 | 30 | Risk Ratio (M‐H, Fixed, 95% CI) | 0.5 [0.11, 2.33] |
| 5.2 without MMC in both groups | 1 | 30 | Risk Ratio (M‐H, Fixed, 95% CI) | 0.4 [0.09, 1.75] |
| 6 Flat anterior chamber at 24 months Show forest plot | 1 | 60 | Risk Ratio (M‐H, Fixed, 95% CI) | 0.6 [0.08, 4.28] |
| 6.1 with MMC in both groups | 1 | 30 | Risk Ratio (M‐H, Fixed, 95% CI) | 1.0 [0.07, 14.55] |
| 6.2 without MMC in both groups | 1 | 30 | Risk Ratio (M‐H, Fixed, 95% CI) | 0.33 [0.01, 7.58] |
| 7 Choroidal detachment at 24 months Show forest plot | 1 | 60 | Risk Ratio (M‐H, Fixed, 95% CI) | 0.43 [0.12, 1.51] |
| 7.1 with MMC in both groups | 1 | 30 | Risk Ratio (M‐H, Fixed, 95% CI) | 0.25 [0.03, 1.98] |
| 7.2 without MMC in both groups | 1 | 30 | Risk Ratio (M‐H, Fixed, 95% CI) | 0.67 [0.13, 3.44] |