Trabeculectomía modificada con dispositivos para el glaucoma
Resumen
Antecedentes
El glaucoma es una neuropatía óptica que da lugar a pérdida de la visión y ceguera. Es la segunda causa más frecuente de ceguera irreversible en todo el mundo. El tratamiento principal para el glaucoma intenta reducir la presión intraocular (PIO) para disminuir o prevenir la pérdida de visión adicional. La PIO se puede disminuir con fármacos, así como con cirugías con láser o de incisión. La trabeculectomía es el procedimiento quirúrgico de incisión más habitual para tratar el glaucoma. La trabeculectomía modificada con dispositivos está destinada a mejorar el drenaje del humor acuoso para disminuir la PIO. La trabeculectomía modificada con dispositivos incluye Ex‐PRESS, Ologen, membrana amniótica, membrana de politetrafluoretileno expandido (PTFE‐E), Gelfilm y otros. Sin embargo, no se conoce la efectividad y la seguridad de estos dispositivos.
Objetivos
Evaluar la efectividad relativa, principalmente con respecto al control de la PIO y la seguridad, del uso de diferentes dispositivos como complementos de la trabeculectomía en comparación con trabeculectomía estándar en los ojos con glaucoma.
Métodos de búsqueda
Se realizaron búsquedas en CENTRAL (que contiene el registro de ensayos del Grupo Cochrane de Trastornos de los Ojos y la Visión [Cochrane Eyes and Vision Group]) (2014, número 12), Ovid MEDLINE, Ovid MEDLINE In‐Process and Other Non‐Indexed Citations, Ovid MEDLINE Daily, Ovid OLDMEDLINE (enero 1946 hasta diciembre 2014), EMBASE (enero 1980 hasta diciembre 2014), PubMed (1948 hasta diciembre 2014), Latin American and Caribbean Literature on Health Sciences (LILACS) (enero 1982 hasta diciembre 2014), en el metaRegister of Controlled Trials (mRCT) (www.controlled‐trials.com), ClinicalTrials.gov (www.clinicaltrials.gov) y en la World Health Organization (WHO) International Clinical Trials Registry Platform (ICTRP) (www.who.int/ictrp/search/en). No se aplicó ninguna restricción de fecha o idioma en las búsqueda electrónicas de ensayos. Se buscó por última vez en las bases de datos electrónicas el 22 de diciembre 2014.
Criterios de selección
Se incluyeron los ensayos controlados aleatorios que compararon los dispositivos utilizados durante la trabeculectomía con trabeculectomía solamente. También se incluyeron los estudios en los que se utilizaron antimetabolitos en alguno o en ambos grupos de tratamiento.
Obtención y análisis de los datos
Se utilizaron los procedimientos estándar previstos por Cochrane.
Resultados principales
Se encontraron 33 estudios que cumplieron los criterios de inclusión, de los cuales 30 se publicaron como artículos de revistas a texto completo y tres como resúmenes de congresos. Sólo cinco estudios han sido registrados. Los 33 estudios incluyeron 1542 participantes con glaucoma y compararon cinco tipos de dispositivos implantados durante la trabeculectomía versus trabeculectomía sola. Cinco estudios informaron el uso de Ex‐PRESS (386 participantes), ocho estudios informaron el uso de Ologen (327 participantes), 18 estudios informaron el uso de membrana amniótica (726 participantes), un estudio informó el uso de PTFE‐E (60 participantes) y un estudio informó el uso de Gelfilm (43 participantes). Estos estudios se realizaron en América del Norte, América del Sur, Europa, Asia y el Medio Oriente. Los períodos de seguimiento planificados de los participantes variaron de tres meses a cinco años. Los estudios se informaron de manera deficiente, lo que limitó la capacidad de evaluar el riesgo de sesgo en muchos dominios. Solamente dos estudios ocultaron explícitamente la evaluación de resultado, por lo que 31 estudios se consideraron con riesgo alto de sesgo de detección.
Pruebas de baja calidad de tres estudios indicaron que el uso de Ex‐PRESS en comparación con trabeculectomía sola se puede asociar con una PIO ligeramente inferior al año (diferencia de medias [DM] ‐1,58 mmHg; intervalo de confianza [IC] del 95%: ‐2,74 a ‐0,42; 165 ojos). La cirugía de catarata y el hipema pueden ser menos frecuentes en el grupo de Ex‐PRESS que en el grupo de trabeculectomía sola (cirugía de catarata: cociente de riesgos [CR] 0,32; IC del 95%: 0,14 a 0,74; tres estudios, pruebas de baja calidad; hipema: CR 0,33; IC del 95%: 0,12 a 0,94; cuatro estudios, pruebas de baja calidad). El efecto de Ex‐PRESS para prevenir la hipotonía no está claro (CR 0,92; IC del 95%: 0,63 a 1,33; dos estudios, pruebas de muy baja calidad). Todos estos estudios recibieron financiamiento del fabricante del dispositivo.
Pruebas de muy baja calidad de cinco estudios indican que el uso de Ologen en comparación con trabeculectomía sola se asocia con una PIO ligeramente mayor al año (DM 1,40 mmHg; IC del 95%: ‐0,57 a 3,38; 177 ojos). El efecto de Ologen para prevenir la hipotonía no está claro (CR 0,75; IC del 95%: 0,47 a 1,19; cinco estudios, pruebas de muy baja calidad). Las diferencias entre los dos grupos de tratamiento en otras complicaciones informadas tampoco fueron concluyentes.
Pruebas de baja calidad de nueve estudios indican que el uso de la membrana amniótica con trabeculectomía se puede asociar con una PIO inferior al año en comparación con trabeculectomía sola (DM ‐3,92 mmHg; IC del 95%: ‐5,41 a ‐2,42; 356 ojos). Pruebas de baja calidad indicaron que el uso de membrana amniótica puede prevenir los eventos adversos y las complicaciones como la hipotonía (CR 0,40; IC del 95%: 0,17 a 0,94; cinco estudios, pruebas de baja calidad).
El informe del único estudio de PTFE‐E (60 ojos) no mostró diferencias importantes en la PIO posoperatoria al año (DM ‐0,44 mmHg; IC del 95%: ‐1,76 a 0,88) entre los grupos de trabeculectomía + PTFE‐E versus trabeculectomía sola. La hipotonía fue la única complicación posoperatoria observada con menor frecuencia en el grupo de PTFE‐E en comparación con el grupo de trabeculectomía sola (CR 0,29; IC del 95%: 0,11 a 0,77).
El único estudio de Gelfilm informó incertidumbre con respecto a la diferencia en la PIO y las tasas de complicación entre los dos grupos al año; no se proporcionaron datos adicionales en el informe del estudio.
Conclusiones de los autores
En general, el uso de dispositivos con trabeculectomía estándar puede ayudar a una mayor reducción de la PIO al año de seguimiento que la trabeculectomía sola; sin embargo, debido a los posibles sesgos y la imprecisión en las estimaciones del efecto, la calidad de las pruebas es baja. Cuando se examinaron los resultados dentro de los subgrupos según el tipo de dispositivo utilizado, los hallazgos indicaron que el uso de un dispositivo Ex‐PRESS o una membrana amniótica como complemento de la trabeculectomía puede ser ligeramente más efectivo para reducir la PIO al año después de la cirugía en comparación con la trabeculectomía sola. Las pruebas de que estos dispositivos son tan seguros como la trabeculectomía sola no están claras. Debido a diversas limitaciones en el diseño y en la realización de los estudios incluidos, la aplicabilidad de esta síntesis de pruebas a otras poblaciones o contextos es incierta. Se necesitan estudios de investigación adicionales para determinar la efectividad y la seguridad de otros dispositivos y en subgrupos poblacionales, como los pacientes con diferentes tipos de glaucoma, de diversas razas y grupos étnicos y con diferentes tipos de lentes (p.ej. fáquicos, seudofáquicos).
PICOs
Resumen en términos sencillos
Trabeculectomía modificada con dispositivos para el glaucoma
Pregunta de la revisión
Se examinaron las pruebas acerca de la efectividad y la seguridad del uso de dispositivos en una cirugía estándar (trabeculectomía) para el tratamiento del glaucoma.
Antecedentes
El glaucoma es una enfermedad del nervio óptico que da lugar a pérdida de la visión y ceguera. Es la segunda causa principal de ceguera a nivel mundial, y la ceguera causada por el glaucoma es permanente. El tratamiento para el glaucoma intenta reducir la presión en el ojo (PIO), lo que ayuda a desacelerar o prevenir la pérdida de visión adicional provocada por el glaucoma. La presión ocular se puede disminuir con fármacos, así como con tratamiento con láser o cirugía. La trabeculectomía, el procedimiento quirúrgico estándar más frecuente para el tratamiento del glaucoma, se puede modificar al utilizar ayudas o dispositivos durante la cirugía. Los estudios actuales informaron el uso de diversos dispositivos como Ex‐PRESS, Ologen, membrana amniótica, membrana de politetrafluoretileno extendido (PTFE‐E), Gelfilm, gold shunt, T‐flux, etc.
Características de los estudios
Se encontraron 33 estudios que cumplieron los criterios de inclusión. Estos estudios incluyeron a 1542 participantes con glaucoma y compararon cinco tipos de dispositivos implantados durante la trabeculectomía versus trabeculectomía sola. Cinco estudios informaron el uso de Ex‐PRESS (386 participantes), ocho estudios informaron el uso de Ologen (327 participantes), 18 estudios informaron el uso de membrana amniótica (726 participantes), un estudio informó el uso de PTFE‐E (60 participantes) y un estudio informó el uso de Gelfilm (43 participantes). Estos estudios se realizaron en América del Norte, América del Sur, Europa, Asia y el Medio Oriente. Los períodos de seguimiento planificados de los participantes variaron de tres meses a cinco años.
Resultados clave
Tres estudios encontraron que el uso del implante Ex‐PRESS durante la trabeculectomía puede reducir ligeramente la presión ocular en alrededor de 1,6 mmHg más que la trabeculectomía sola. Otro estudio no encontró diferencias en la presión ocular al año entre la trabeculectomía combinada con Ex‐PRESS versus trabeculectomía sola. Cinco estudios no encontraron diferencias importantes entre la trabeculectomía y el Ologen en comparación con la trabeculectomía sola. Nueve estudios encontraron que el uso de la membrana amniótica durante la trabeculectomía puede reducir la PIO en alrededor de 4 mmHg más que la trabeculectomía sola al año de seguimiento. No se encontraron diferencias importantes en la presión ocular posoperatoria al año entre la trabeculectomía + PTFE‐E y la trabeculectomía sola. No se encontraron suficientes datos con respecto a las pruebas para el uso de Gelfilm. No se conoce si estos dispositivos tienen la misma seguridad que la trabeculectomía sola. Las pruebas están actualizadas hasta el 22 diciembre 2014.
Calidad de la evidencia
La calidad general de los estudios incluidos varió según el tipo de dispositivo estudiado. Específicamente, la calidad fue muy baja en los estudios de Ex‐PRESS, muy baja en los estudios de Ologen, baja en los estudios de la membrana amniótica e incierta en los estudios de otros dispositivos. Debido a las diversas deficiencias en el diseño de los estudios y al informe incompleto, los datos se deben interpretar con cuidado, en particular en los estudios de la membrana amniótica.
Authors' conclusions
Summary of findings
| Ex‐PRESS implanted during trabeculectomy compared with trabeculectomy alone for people with open‐angle glaucoma | ||||||
| Patient or population: people with open‐angle glaucoma Settings: ophthalmic surgery Intervention: Ex‐PRESS implanted during trabeculectomy Comparison: trabeculectomy alone | ||||||
| Outcomes | Illustrative comparative risks* (95% CI) | Relative effect | No of Eyes | Quality of the evidence | Comments | |
| Assumed risk | Corresponding risk | |||||
| trabeculectomy alone | Ex‐PRESS | |||||
| Postoperative mean IOP at 1 year | The mean IOP in the trabeculectomy‐alone groups was 13.9 mm Hg, ranged from 11.6 to 16.4 mm Hg | The mean IOP in the Ex‐PRESS groups was | ‐ | 165 | ⊕⊕⊝⊝ | ‐ |
| Postoperative mean logMAR BCVA at 1 year | The mean logMAR BCVA in the trabeculectomy‐alone groups was 0.59, ranged from 0.43 to 0.80 | The mean logMAR BCVA in the Ex‐PRESS groups was | ‐ | 90 | ⊕⊝⊝⊝ | ‐ |
| Complication as defined in protocol‐ Hypotony Follow‐up: ranged from 1 to 5 years | 565 per 1000 | 520 per 1000 (356 to 751) | RR 0.92 (0.63 to 1.33) | 94 (2 studies) | ⊕⊝⊝⊝ | ‐ |
| Other complications reported by included studies | ||||||
| Shallow/flat anterior chamber Follow‐up: ranged from 1 to 5 years | 150 per 1000 | 108 per 1000 | RR 0.72 (0.40 to 1.32) | 294 | ⊕⊝⊝⊝ | ‐ |
| Bleb leakage Follow‐up: ranged from 1 to 5 years | 48 per 1000 | 60 per 1000 | RR 1.26 (0.50 to 3.20) | 294 | ⊕⊝⊝⊝ | ‐ |
| Hyphema Follow‐up: ranged from 1 to 5 years | 82 per 1000 | 27 per 1000 | RR 0.33 (0.12 to 0.94) | 294 | ⊕⊕⊝⊝ | ‐ |
| Cataract surgery Follow‐up: ranged from 1 to 5 years | 152 per 1000 | 49 per 1000 | RR 0.32 (0.14 to 0.74) | 264 | ⊕⊕⊝⊝ | ‐ |
| *The basis for the assumed risk (e.g. the median control group risk across studies) is provided in footnotes. The corresponding risk (and its 95% confidence interval) is based on the assumed risk in the comparison group and the relative effect of the intervention (and its 95% CI). | ||||||
| GRADE Working Group grades of evidence | ||||||
| 1Downgraded for limitations in the design and implementation of available studies suggesting high likelihood of bias (‐1); high likelihood that studies did not mask outcome assessors. | ||||||
| Ologen implanted during trabeculectomy compared with trabeculectomy alone for people with glaucoma | ||||||
| Patient or population: people with glaucoma, including open‐angle, angle‐closure, and uncontrolled IOP Settings: ophthalmic surgery Intervention: Ologen implanted during trabeculectomy Comparison: trabeculectomy alone | ||||||
| Outcomes | Illustrative comparative risks* (95% CI) | Relative effect | No of Eyes | Quality of the evidence | Comments | |
| Assumed risk | Corresponding risk | |||||
| trabeculectomy alone | Ologen | |||||
| Postoperative mean IOP at 1 year | The mean IOP in the trabeculectomy‐alone groups was 15.2 mm Hg, ranged from 11 to 19.3 mm Hg. | The mean IOP in the Ologen groups was | ‐ | 177 | ⊕⊝⊝⊝ | Analyzed using the generic inverse method |
| Postoperative mean logMAR BCVA at 1 year | See comment. | See comment. | ‐ | ‐ | ‐ | Senthil 2013 reported BCVA for 32 eyes at 6 weeks post‐surgery: MD ‐0.24 logMAR, 95% CI ‐0.58 to 0.10 |
| Complication as defined in protocol‐ Hypotony Follow‐up: ranged from 6 to 24 months | 223 per 1000 | 167 per 1000 | RR 0.75 (0.47 to 1.19) | 233 | ⊕⊝⊝⊝ | ‐ |
| Other complications reported by included studies | ||||||
| Shallow anterior chamber Follow‐up: ranged from 6 to 24 months | 90 per 1000 | 71 per 1000 | RR 0.79 (0.32 to 1.93) | 213 | ⊕⊝⊝⊝ | ‐ |
| Bleb leakage Follow‐up: ranged from 6 to 24 months | 138 per 1000 | 117 per 1000 | RR 0.85 (0.33 to 2.20) | 129 | ⊕⊝⊝⊝ | ‐ |
| Hyphema Follow‐up: ranged from 6 to 24 months | 78 per 1000 | 114 per 1000 | RR 1.46 (0.51 to 4.19) | 229 | ⊕⊝⊝⊝ | ‐ |
| Surgical revision Follow‐up: ranged from 6 to 24 months | 40 per 1000 | 68 per 1000 (15 to 305) | RR 1.70 (0.38 to 7.63) | 150 (4 studies) | ⊕⊝⊝⊝ | ‐ |
| *The basis for the assumed risk (e.g. the median control group risk across studies) is provided in footnotes. The corresponding risk (and its 95% confidence interval) is based on the assumed risk in the comparison group and the relative effect of the intervention (and its 95% CI). | ||||||
| GRADE Working Group grades of evidence | ||||||
| 1Downgraded for limitations in the design and implementation of available studies suggesting high likelihood of bias (‐1); high likelihood that studies did not mask outcome assessors. | ||||||
| Amniotic membrane implanted during trabeculectomy compared with trabeculectomy alone for people with glaucoma | ||||||
| Patient or population: people with glaucoma, including open‐angle, angle‐closure, uncontrolled IOP, and refractive glaucoma Settings: ophthalmic surgery Intervention: Amniotic membrane implanted during trabeculectomy Comparison: trabeculectomy alone | ||||||
| Outcomes | Illustrative comparative risks* (95% CI) | Relative effect | No of Eyes | Quality of the evidence | Comments | |
| Assumed risk | Corresponding risk | |||||
| trabeculectomy alone | amniotic membrane | |||||
| Postoperative mean IOP at 1 year | The mean IOP in the trabeculectomy alone groups was 17.6 mm Hg, ranged from 15.1 to 19.8 mm Hg. | The mean IOP in the Ologen groups was | ‐ | 356 | ⊕⊕⊝⊝ | |
| Postoperative mean logMAR BCVA at 1 year | See comment. | See comment. | Only 1 study reported this outcome; the amniotic membrane group had statistically significantly better BCVA than the trabeculectomy group, but no data for between‐group difference were provided | |||
| Complications ‐ Hypotony Follow‐up: ranged from 3 to 24 months | 206 per 1000 | 82 per 1000 | RR 0.40 (0.17 to 0.94) | 205 | ⊕⊕⊝⊝ | ‐ |
| Other complications reported by included studies | ||||||
| Complications ‐ Shallow anterior chamber Follow‐up: ranged from 3 to 24 months | 240 per 1000 | 113 per 1000 | RR 0.47 (0.30 to 0.73) | 632 | ⊕⊕⊝⊝ | ‐ |
| Complications ‐ Bleb leakage Follow‐up: ranged from 3 to 24 months | 327 per 1000 | 91 per 1000 | RR 0.28 (0.10 to 0.79) | 98 | ⊕⊕⊝⊝ | ‐ |
| Complications ‐ Hyphema Follow‐up: ranged from 3 to 24 months | 91 per 1000 | 39 per 1000 | RR 0.43 (0.14 to 1.34) | 235 | ⊕⊝⊝⊝ | ‐ |
| Complications ‐ Surgical revision Follow‐up: ranged from 3 to 24 months | See comment. | See comment. | ‐ | ‐ | None of the studies reported this outcome. | |
| *The basis for the assumed risk (e.g. the median control group risk across studies) is provided in footnotes. The corresponding risk (and its 95% confidence interval) is based on the assumed risk in the comparison group and the relative effect of the intervention (and its 95% CI). | ||||||
| GRADE Working Group grades of evidence | ||||||
| 1Downgraded for limitations in the design and implementation of available studies suggesting high likelihood of bias (‐1); high likelihood that studies did not mask outcome assessors. | ||||||
Background
Description of the condition
Glaucoma is an optic neuropathy that leads to vision loss and blindness (Foster 2002). Among the many known and unknown factors that contribute to the damage to the optic nerve, elevated intraocular pressure (IOP) is the only modifiable risk factor (Coleman 2012). Normally, the IOP is maintained in balance when the rate of aqueous production by the ciliary body is equal to the rate of its outflow from the posterior to the anterior chamber through the trabecular meshwork and the canal of Schlemm in the anterior chamber angle (Small 1986). When excess aqueous humor is produced or when part or all of the drainage system of aqueous humor is blocked, the result is an increase in IOP, which has been shown to be associated with progressive glaucomatous optic nerve damage (Pan 2011; Turkoski 2012).
There are several types of glaucoma, of which open‐angle glaucoma (OAG) and angle‐closure glaucoma (ACG) are two major types.
Epidemiology
The World Health Organization (WHO) has estimated that glaucoma is the second most frequent cause of blindness worldwide (Quigley 2011). It has been estimated that there were 60.5 million people with OAG and ACG in 2010, and the number will increase globally to 79.6 million by 2020. The most common type of glaucoma is OAG, accounting for 74% of glaucoma cases worldwide. ACG is less common. Women comprise 55% of OAG cases, 70% of ACG cases, and 59% of all glaucoma cases. Asians represent 47% of people who have glaucoma and 87% of those with ACG (Quigley 2006).
Symptoms and diagnosis
OAG is often asymptomatic initially. There is no pain and those affected tend not to notice the loss of visual field until central vision is affected in the later stage of the disease; by then optic nerve damage is often already severe (Boland 2008; Quigley 2011; Small 1986). The symptoms for ACG vary. It may occur suddenly without warning or gradually with progressive deterioration; patients may have signs and symptoms including severe pain and red eye, decreased or cloudy vision, nausea, vomiting, and bradycardia (Boland 2008; Douglas 1975; Small 1986). Clinical examinations for diagnosing glaucoma include, but are not limited to, tonometry, gonioscopy, optic nerve imaging, visual acuity measurement, and visual field assessment.
Description of the intervention
Trabeculectomy, first introduced by John Cairns in 1968 and then modified by Watson in 1972, remains the gold standard and is the most common incisional surgical procedure for the treatment of glaucoma (Cairns 1968; Watson 1972; Watson 1981). It includes lifting the conjunctiva and dissecting a partial thickness scleral flap and then making a perforating scleral entrance into the anterior chamber to allow aqueous humor drainage. Trabeculectomy may also include removing part of the eye's trabecular meshwork and adjacent structures. This procedure lowers IOP by allowing aqueous fluid to percolate into the subconjunctival space through the scleral hole or the cut ends of the trabecular meshwork into the subconjunctival space. Over the years trabeculectomy has been modified in various ways, including the use of 5‐fluorouracil (5‐FU) (Green 2014) and mitomycin C (MMC) (Wilkins 2005), and creation of a fornix‐based rather than the traditional limbus‐based conjunctival flap. Most recently, the modifications have included the use of adjunctive devices with standard trabeculectomy. Surgeons may use a tube without a reservoir (for example, Ex‐PRESS) or a space‐holder or reservoir to enhance aqueous humor outflow or to modify healing (for example, Ologen) and to promote continued drainage from the anterior chamber through a standard partial thickness scleral flap used in a standard trabeculectomy. Another technique, a device composed of both a silicone tube and an explant plate, called an aqueous shunt, is also a surgical option to treat glaucoma, but this technique is not within the scope of this review (Minckler 2006).
How the intervention might work
We consider in this review adjunctive devices used with trabeculectomy to lower IOP, with and without concomitant use of antimetabolites. The devices used with standard trabeculectomy are intended to maintain drainage of aqueous humor, and may be used with or without antimetabolites to maintain patency of the bleb (a bubble‐like blister of conjunctiva to facilitate drainage).
Tube implants
1. Ex‐PRESS mini glaucoma implant
The Ex‐PRESS implant is a miniature stainless steel shunt developed as an adjunct to trabeculectomy to promote continued aqueous drainage. The device is implanted under a partial thickness scleral flap to allow aqueous humor to flow from the anterior chamber to the subconjunctival space; implantation leads to the formation of a thin‐walled filtration bleb, similar to the bleb formed during standard trabeculectomy. Investigators who have conducted retrospective studies and randomized controlled trials have reported that the Ex‐PRESS shunt provides IOP control that is similar to or better than that provided by standard trabeculectomy (Dahan 2012; De Jong 2009; Francis 2011; Gallego‐Pinazo 2009; Maris 2007). They have also reported that the Ex‐PRESS shunt results in fewer complications, fewer postoperative surgical interventions, and less need for glaucoma medications. The device is manufactured by Alcon (a Novartis company).
2. Silicon tube implant
Jordan 2006 reported the use of a silicon tube implant for suprachoroidal drainage during a standard trabeculectomy. The tube was inserted at a junction connecting the anterior chamber and the suprachoroidal space. These investigators concluded that the tube was an effective surgical adjunct to treat intractable glaucoma. However, Jordan 2006 was not a randomized controlled trial, and the effectiveness and safety of silicon tube implants are unclear. The device is produced by a variety of manufacturers.
Antimetabolites and biodegradable implant
Wound healing and scar formation are the main sequelae that limit IOP lowering after standard trabeculectomy. They may lead to fibrosis of the bleb and obstruction of the drainage fistula, and finally cause bleb failure (Skuta 1987). Antifibrotic agents, such as 5‐FU and MMC, have been demonstrated to be effective in delaying wound healing and thus improving the success rate of trabeculectomy (Azuara‐Blanco 1998; Fraser 2004). Therefore, 5‐FU and MMC have become widely used as adjuncts to glaucoma‐filtering surgery. Although 5‐FU and MMC improve the success of trabeculectomy, concern persists about the complications associated with antimetabolites, for example bleb‐related infections, bleb leaks, and bleb dysesthesia (defined as burning, foreign body sensation, tearing, pain, or ocular discomfort in an eye with a filtering bleb) (Bell 1997; Jampel 1992; Lama 2003). Biodegradable implants have therefore been developed for use with trabeculectomy to maintain drainage while avoiding the use or reducing the amount of antimetabolite used by the surgeon.
1. Ologen implant
The Ologen implant is a plate‐shaped, tissue bioengineered, biodegradable porous collagen‐glycosaminoglycan matrix used during trabeculectomy. The device randomly reorganizes the regeneration of myofibroblasts, fibroblasts, and the secreted extracellular matrix, and consequently reduces postoperative scar formation (Dietlein 2008; Tseng 1999). Investigators who have conducted studies in animal models and several randomized clinical trials have reported that Ologen implanted in the subconjunctival space provides an alternative method for controlling the wound‐healing process and avoids the complications associated with the use of antifibrotic agents (Chen 2006; Cillino 2011; Hsu 2008; Papaconstantinou 2010; Rosentreter 2010). The device is manufactured by PRO Top & Mediking Co. Ltd and its subsidiaries: Body organ biomedical Corps, Optous, Aeon Astron B.V., OculusGen Biomedical.
2. Amniotic membrane
Human amniotic membrane is an antifibrotic, anti‐inflammatory agent. It was known for its beneficial effect in preventing subconjunctival fibrosis in glaucoma filtering surgery by suppressing transforming growth factor ß, as this signaling system is a strategy for preventing scarring during wound healing (Ricci 2013). A Cochrane review also found amniotic membrane to be useful for treating acute ocular surface burns (Clare 2012). Although recent animal and human studies on amniotic membrane have been promising, it remains unclear whether these membranes can provide a potential alternative tissue to conjunctiva in the construction of filtration blebs during trabeculectomy (Barton 2001; Eliezer 2006; Ji 2013; Khairy 2015; Sheha 2008; Stavrakas 2012). The device is produced by a variety of manufacturers.
Other implants
Other devices have been developed and studied for non‐penetrating glaucoma surgeries.
1. Expanded polytetrafluoroethylene (E‐PTFE) membrane implant
E‐PTFE is an expanded polytetrafluoroethylene implant made up of solid nodes interconnected by a thin fibril matrix. Its use has been reported in several animal studies and human trials in the form of either a membrane patch or an implant placed beneath the partial thickness scleral flap (Bae 1988; Cillino 2008; Jacob 2001) or combined with a silicone tube shunt (Choi 2003; Kim 2003). The device is manufactured by GORE Inc., under the brand names Gore‐Tex® and PRECLUDE®.
2. Gelfilm (absorbable gelatin film) implant
Gelfilm is a sterile film derived from denaturated collagen. When moistened, the film is about 0.075 mm thick and can be cut to fit the eye during surgery. The film is absorbed completely within one to six months, so that no additional surgery is required to remove the implant. Gelfilm is thought to prevent adhesion of ocular structures, which may be helpful in preventing closure of drainage passages created by trabeculectomy. The device is manufactured by Pfizer.
3. SOLX Gold Shunt
The SOLX Gold Shunt is a new biocompatible device made of pure gold (24 carat) that reduces IOP by using the eye's natural pressure difference (www.solx.com/content/solx‐gold‐shunt). The device is inserted into the anterior chamber through a special corneal or scleral incision, with the posterior end left in the suprachoroidal space. The device is currently approved for use in Canada and a few European countries, and is under evaluation in a multicenter clinical trial in the United States (clinicaltrials.gov; NCT01282346). The device is manufactured by SOLZ Inc.
Why it is important to do this review
The purpose of this review is to compare the effectiveness and safety of device‐modified trabeculectomy procedures versus standard trabeculectomy in the surgical treatment of glaucoma with or without the use of antifibrotic agents. Device‐modified trabeculectomy is a relatively new procedure; many studies have not had sample sizes sufficiently large to provide reliable evidence to assess the effectiveness and safety of the procedure. It is therefore important to examine the evidence from multiple completed studies. When meta‐analysis of outcomes is appropriate, pooling across studies should increase the power and yield valuable information. Authors of a few recently published articles have addressed the effectiveness and safety of the Ex‐PRESS and Ologen devices (Chen 2014; He 2014; Wang 2013a). However, a comprehensive, rigorous systematic review in this area is warranted.
Objectives
To assess the relative effectiveness, primarily with respect to IOP control and safety, of the use of different devices as adjuncts to trabeculectomy compared with standard trabeculectomy in eyes with glaucoma.
Methods
Criteria for considering studies for this review
Types of studies
We included only randomized controlled trials in this review.
Types of participants
We include trials in which the participants were 18 or more years of age and had been diagnosed with glaucoma. We include trials in which participants had any type of glaucoma (for example, primary open‐angle glaucoma, angle‐closure glaucoma, pigmentary glaucoma, exfoliation glaucoma, and secondary glaucoma such as neovascular glaucoma) except pediatric and congenital glaucoma. There were no restrictions with regard to participant gender, ethnicity, comorbidity, use of adjunctive medication, lens status (phakic, aphakic, or pseudophakic), or number of participants enrolled in an individual trial. We excluded studies in which all participants were less than 18 years of age, as pediatric glaucoma and congenital glaucoma were not the purpose of this review. Surgical interventions for primary congenital glaucoma are evaluated in another Cochrane review (Ghate 2015).
Types of interventions
We include trials that compared, with or without the use of antimetabolites, device‐modified trabeculectomy versus standard trabeculectomy. The devices we intended to assess include the Ex‐PRESS, silicone tube implant, Ologen, amniotic membrane, expanded polytetrafluoroethylene (E‐PTFE), Gelfilm, and SOLX Gold Shunt, which are all popular devices used in glaucoma surgeries and can be deployed under a standard trabeculectomy flap. In future updates of this review, we will include other new devices used in a trabeculectomy. We planned to make the following comparisons:
-
Trabeculectomy + any of the above devices versus trabeculectomy alone;
-
Trabeculectomy + any device + antimetabolites (MMC, 5‐FU, or both) versus trabeculectomy + antimetabolites (MMC, 5‐FU, or both);
-
Trabeculectomy + Ologen device versus trabeculectomy + antimetabolites (MMC, 5‐FU, or both).
There are two pairs of comparisons that we did not plan to include, as these are already covered in other Cochrane reviews:
-
MMC with 5‐FU on the outcome of standard trabeculectomy (Clarke 2006);
-
Fornix‐based (the modification) versus traditional limbus‐based trabeculectomy (Al‐Haddad 2015).
In addition, we excluded studies in which trabeculectomy combined with cataract surgery were performed or were permitted, as this was outside the scope of this review.
Types of outcome measures
Primary outcomes
The primary outcomes for comparison of treatments of this review included:
-
Change in IOP, measured as a mean decrease from baseline (immediate preoperative IOP) at one year after the intervention when IOP had been measured using Goldmann tonometry, TonoPen, or another standard device. When change in IOP was not available, and when baseline IOP distributions were similar in the two surgery groups, we compared postoperative IOP as a surrogate to estimate the effect of device‐modified trabeculectomy.
-
We planned to report IOP fluctuation, assessed as a standard deviation or range of IOPs before or one year after the procedure, whenever such data were available.
Secondary outcomes
The secondary outcomes for comparison of treatments included:
-
Mean change in IOP from baseline, measured on day one, during weeks one to 12, at four to six months, seven to 12 months, and thereafter as available throughout follow‐up. When change in IOP was not available, and when baseline IOPs were similar between treatment groups, we used postoperative IOP to estimate the relative effect of device‐modified trabeculectomy in the meta‐analyses.
-
Best‐corrected visual acuity (BCVA), measured using a Snellen chart or Snellen equivalent and assessed at one year postintervention. We analyzed BCVA data as a continuous outcome in the meta‐analyses.
-
Visual field change, measured in units of mean deviation or mean defect (the average point‐wise difference between a given test result and the normal age‐matched reference value) at one year postintervention.
-
Quality of life, measured by the National Eye Institute Visual Function Questionnaire (NEI VFQ) or any other validated instrument at one year postintervention.
-
Frequency of the following complications: loss of vision of more than two lines, IOP < 5 mm Hg (hypotony), surgical revision within three months and one year after surgery, endophthalmitis or blebitis, retinal detachment, corneal transplant, cataract extraction (among phakic eyes), choroidal hemorrhage, and others as reported in the included studies.
Search methods for identification of studies
Electronic searches
We searched CENTRAL (which contains the Cochrane Eyes and Vision Trials Register) (2014 Issue 12), Ovid MEDLINE, Ovid MEDLINE In‐Process and Other Non‐Indexed Citations, Ovid MEDLINE Daily, Ovid OLDMEDLINE (January 1946 to December 2014), EMBASE (January 1980 to December 2014), PubMed (1948 to December 2014), Latin American and Caribbean Literature on Health Sciences (LILACS) (January 1982 to December 2014), the metaRegister of Controlled Trials (mRCT) (www.controlled‐trials.com), ClinicalTrials.gov (www.clinicaltrials.gov), and the World Health Organization (WHO) International Clinical Trials Registry Platform (ICTRP) (www.who.int/ictrp/search/en). We did not impose any date, language, or publication status restrictions in the electronic search for trials. All electronic databases were all searched on 22 December 2014.
See: Appendices for details of search strategies for CENTRAL (Appendix 1), MEDLINE (Appendix 2), EMBASE (Appendix 3), PubMed (Appendix 4), LILACS (Appendix 5), mRCT (Appendix 6), ClinicalTrials.gov (Appendix 7), and ICTRP (Appendix 8).
Searching other resources
We searched the references listed in reports from included studies to identify additional relevant studies, without restriction regarding language or date of publication.
Data collection and analysis
Selection of studies
Two review authors independently reviewed the titles and abstracts of all reports identified through the electronic and manual searches. We first classified all titles and abstracts as 'definitely relevant', 'unsure', or 'definitely not relevant'. We then adjudicated discrepancies through discussion and retrieved full‐text reports for those classified as 'definitely relevant' or 'unsure' by both review authors. By review of full‐text reports, we independently assessed eligibility and classified each study as 'include', 'unsure', or 'exclude'. For studies labeled as 'unsure' at this stage, we requested further information from study investigators. When they did not respond within two weeks, we used the information available. We resolved disagreements by discussion between the two review authors. When resolution was not possible, we consulted a third review author. All publications from studies that met the inclusion criteria then underwent assessment of risk of bias and data extraction. We recorded the reasons for exclusion of studies classified as 'exclude' in the 'Characteristics of excluded studies' tables. For reports not published in English or Chinese, we planned to use Google Translate to screen titles and abstracts and to ask translators to translate or assess reports for full‐text screening. However, all reports relevant to this review were published in English or Chinese languages.
Data extraction and management
Two review authors independently extracted data regarding study design and methods, participant characteristics, and the primary and secondary outcomes, and recorded the information onto paper data collection forms developed in collaboration with Cochrane Eyes and Vision. Whenever there were discrepancies between review authors, we reached consensus by discussion. When we could not reach a consensus, we consulted a third review author who made the final decision. We contacted study investigators to obtain missing information and to elucidate unclear reporting. When they did not respond within two weeks, we used the information available. One review author entered data into Review Manager 5 (RevMan 2014) and a second review author verified the data entered.
Assessment of risk of bias in included studies
Two review authors independently assessed each included study for risks of bias as part of the data extraction process. We based our judgments on the tools for assessing risk of bias set forth in Chapter 8 of the Cochrane Handbook for Systematic Reviews of Interventions (Higgins 2011).
We judged each study with respect to the following risk of bias domains:
-
Selection bias (sequence generation and allocation concealment before randomization);
-
Performance bias (masking of participants and personnel);
-
Detection bias (masking of outcome assessors);
-
Attrition bias (incomplete outcome data);
-
Reporting bias (selective outcome reporting);
-
Other potential sources of bias (e.g., funding source).
We assessed each trial for each risk of bias criterion as being at high, at low , or at unclear risk of bias (lack of information or uncertainty over the potential for bias).
Measures of treatment effect
Dichotomous outcomes
We analyzed dichotomous outcomes, such as complications, using summary risk ratios (RRs) with 95% confidence intervals (CIs).
Continuous outcomes
We estimated the difference between continuous outcomes, such as mean change (or mean) IOP and BCVA, as the mean difference (MD) with 95% CIs for IOP. We planned to analyze IOP fluctuations, visual field changes, and quality‐of‐life scores as continuous outcomes, but such data were not available.
Unit of analysis issues
The unit of analysis was the eye that had glaucoma surgery. We recorded whether studies used a parallel‐group design or a paired‐eye design, and whether the study used matched‐analysis when a paired‐eye design was used. When both eyes of all or some participants were allocated to the same intervention group, we recorded the information as available and did not estimate or impute intra‐person correlations for individual outcomes.
More than half of the studies (18/33) were parallel‐group designs and included only one eye per participant. Both eyes of some participants were included in another 13 parallel‐group trials; an average of 22% of participants across these 13 trials contributed both eyes to the analysis. Two trials were paired‐eye designs in which each participant had one eye in each intervention group. None of the 13 studies that included more than one eye per participant accounted for intra‐person correlation.
Dealing with missing data
We contacted study investigators to request missing data or to clarify unclearly reported data or information, including but not limited to information about study methods, effect estimates, and standard deviations of effect estimates. When study investigators did not respond within two weeks or after three attempts to contact them, we used the available information. We did not impute data for this review.
Assessment of heterogeneity
We assessed clinical and methodological heterogeneity among included trials by examining variations in the trial designs and methods, characteristics of the trial participants, variations in interventions, and lengths of follow‐up. We assessed statistical heterogeneity among the reported treatment effect estimates of included trials by examining the overlap of the 95% CIs on estimates from individual trials in forest plots and I² values (Higgins 2003). We considered poor overlap in the 95% CIs and an I² above 50% as indications of substantial statistical heterogeneity.
Assessment of reporting biases
We investigated whether our review was subject to reporting biases. For selective reporting bias, we compared outcomes specified in trial protocols or trial register records with outcomes reported in published full‐text articles. When no trial protocol or trial register record was available, we examined whether outcomes specified in the Methods section were reported in the Results section of the same published report. We did not use funnel plots to examine signs of asymmetry due to the limited number of studies included in the same meta‐analysis.
Data synthesis
We determined whether data synthesis in meta‐analyses was appropriate based on evidence of heterogeneity. When we considered that there was substantial heterogeneity, we presented results in a narrative summary. In the absence of clinical and methodological heterogeneity across studies, and when the I² statistic was less than 50% (indicating no substantial statistical heterogeneity), when the I² statistic was greater than 50% but all studies favored the same intervention, or when the I² statistic was greater than 50% but no study showed a clinical difference between groups, we combined study results using a random‐effects meta‐analysis model. When the number of included studies was small (three or fewer), we used a fixed‐effect model.
Subgroup analysis and investigation of heterogeneity
We conducted subgroup analysis for comparisons of outcomes with use of individual devices and surgeries including adjuvant antimetabolites (e.g. MMC) in one or both the intervention groups. We were not able to carry out the following planned subgroup analyses as the included studies did not stratify participants based on 1) the status of the lens (i.e. eyes that possessed their natural lens (phakic), eyes without the crystalline lens (aphakic, cataract extraction), or eyes with an intraocular lens implanted that replaced the eye's natural lens (pseudophakic)); 2) ethnicity; 3) baseline IOP; or 4) type of glaucoma.
Sensitivity analysis
We were not able to conduct sensitivity analyses to assess the influence on effect estimates of excluding studies at a high risk of reporting bias, as studies at a high risk of reporting bias were grouped with respect to interventions compared. We had also planned to conduct a sensitivity analysis after excluding industry‐funded studies; however, funding information was not always available, so we did not have enough information to conduct such analyses.
Summary of findings
We reported risk ratios and measures of effect in a ‘Summary of findings’ table, showing our judgment of the quality of the evidence by outcome using the GRADE system (Guyatt 2011).
Our prespecified outcome measures were:
-
Change in IOP, measured as a mean decrease from baseline (immediate preoperative IOP) at one year after the intervention, when IOP had been measured using Goldmann tonometry, TonoPen, or another standard device. When change in IOP was not available, and when baseline IOP distributions were similar in the two surgery groups, we compared postoperative IOPs as a surrogate to estimate the effect of device‐modified trabeculectomy.
-
We planned to report IOP fluctuation, assessed as a standard deviation or range of IOPs before or one year after the procedure, whenever such data were available.
-
Mean change in IOP from baseline, measured on day one, during weeks one to 12, at four to six months, seven to 12 months, and thereafter as available throughout follow‐up. When change in IOP was not available, and when baseline IOPs were similar between treatment groups, we used postoperative IOP to estimate the relative effect of device‐modified trabeculectomy in the meta‐analyses.
-
Best‐corrected visual acuity (BCVA), measured using a Snellen chart or Snellen equivalent and assessed at one year postintervention. We analyzed BCVA data as a continuous outcome in the meta‐analyses.
-
Visual field change, measured in units of mean deviation or mean defect (the average point‐wise difference between a given test result and the normal age‐matched reference value) at one year postintervention.
-
Quality of life, measured by the National Eye Institute Visual Function Questionnaire (NEI VFQ) or any other validated instrument at one year postintervention.
-
Frequency of the following complications: loss of vision of more than two lines, IOP < 5 mm Hg (hypotony), surgical revision within three months and one year after surgery, endophthalmitis or blebitis, retinal detachment, corneal transplant, cataract extraction (among phakic eyes), choroidal hemorrhage, and others as reported in the included studies.
Results
Description of studies
Results of the search
The electronic searches as of 22 December 2014 yielded 4957 titles and abstracts and 533 records from trial registers (Figure 1). After the Trials Search Co‐ordinator removed 1565 duplicate records, there remained 3509 unique titles and abstracts and 416 unique records from trial registers. Two review authors (XW and RK) independently reviewed these 3925 records and through review of titles and abstracts identified a systematic review written in Chinese that included another 14 Chinese articles that we had not identified in our searches (Gao 2013). We therefore screened a total of 3939 records and assessed 3878 as 'not relevant', leaving 61 reports for full‐text review. Two review authors (XW and RK) independently reviewed these 61 full‐text reports, and found 39 reports of 33 unique studies that were eligible for this review. These included 30 studies published as full‐length journal articles and three studies reported only as conference abstracts (Birt 1998; Bruno 2008; De Jong 2005). Additionally, five trials were ongoing and we recorded the study characteristics in the 'Characteristics of ongoing studies' tables. We excluded the remaining 17 reports from 17 studies.

Study flow diagram.
Included studies
The following is a summary of the characteristics of the 33 included studies. Twenty‐one studies were published in English and 12 studies that had assessed amniotic membrane were published in Chinese. Details of each trial are presented in the 'Characteristics of included studies' tables. We also summarized the basic study characteristics in Table 1.
| Device | Study ID | Study design | Country | Participant diagnosis | Interventions | Total number of participants randomized | Total number of eyes randomized | Total number of eyes analyzed | Longest follow‐up period (months) |
| Ex‐PRESS | RCT, paired‐eye design | South Africa | POAG | Trab + MMC Trab + MMC + Ex‐PRESS | 15 | 30 | 30 | 12 | |
| De Jong 2005 (abstract) | RCT, parallel‐group design | The Netherlands | OAG | Trab + Ex‐PRESS under a scleral flap Trab Trab + Ex‐PRESS under conjunctiva | 109 | 120 | N/A | 6 | |
| RCT, parallel‐group design | The Netherlands | OAG | Trab Trab + Ex‐PRESS | 78 | 78 | 78 | 60 | ||
| RCT, parallel‐group design | USA | OAG | Trab + MMC Trab + MMC + Ex‐PRESS | 120 | 120 | 114 | 24 | ||
| RCT, parallel‐group design | Canada | OAG, uncontrolled IOP | Trab + MMC Trab + MMC + Ex‐PRESS | 64 | 64 | 60 | 12 | ||
| Subtotal for Ex‐PRESS | 386 | 412 | N/A | Range 6 to 60 months | |||||
| Ologen | RCT, parallel‐group design | Italy | POAG, PEXG, uncontrolled IOP | Trab + MMC Trab + Ologen | 40 | 40 | 40 | 24 | |
| RCT, parallel‐group design | India | OAG | Trab + MMC Trab + Ologen | 40 | 40 | 40 | 12 | ||
| RCT, parallel‐group design | Egypt | POAG, ACG, PEXG, uveitic glaucoma, uncontrolled pseudophakic glaucoma | Trab + MMC Trab + Ologen | 60 | 60 | 60 | 12 | ||
| RCT, parallel‐group design | India | Uncontrolled OAG | Trab + MMC Trab + Ologen | 64 | 64 | N/A | 6 | ||
| RCT, parallel‐group design | Greece | glaucoma | Trab Trab + Ologen | 40 | 40 | 40 | 6 | ||
| RCT, parallel‐group design | Germany | OAG, uncontrolled IOP | Trab + MMC Trab + Ologen | 20 | 20 | 20 | 12 | ||
| RCT, parallel‐group design | Germany | OAG, uncontrolled IOP | Trab + MMC Trab + Ologen | 30 | 30 | 30 | 12 | ||
| RCT, parallel‐group design | India | Uncontrolled POAG or PACG | Trab + MMC Trab + Ologen | 33 | 39 | 32 | 24 | ||
| Subtotal for Ologen | 327 | 333 | N/A | Range 6 to 24 month | |||||
| Amniotic membrane | Bruno 2008 (abstract) | RCT, parallel‐group design | N/A | OAG and failed surgery | Trab + MMC Trab + MMC + AMT | 19 | N/A | N/A | 6 |
| RCT, parallel‐group design | China | Refractory glaucoma | Trab Trab + AMT | 40 | 48 | 48 | 12 | ||
| RCT, parallel‐group design | China | POAG, ACG, uncontrolled IOP | Trab + MMC Trab + AMT | 47 | 52 | 39 | 3 | ||
| RCT, parallel‐group design | Brazil | POAG | Trab Trab + AMT | 32 | 32 | N/A | 12 | ||
| RCT, parallel‐group design | China | PACG | Trab Trab + AMT | 50 | 63 | N/A | 6 | ||
| RCT, paired‐eye design | China | Uncontrolled glaucoma | Trab Trab + AMT | 17 | 34 | N/A | 24 | ||
| RCT, parallel‐group design | Egypt | OAG | Trab + MMC Trab + AMT | 52 | 52 | 52 | 24 | ||
| RCT, parallel‐group design | China | Refractory glaucoma | Trab + MMC Trab + MMC + AMT | 50 | 62 | N/A | 12 | ||
| RCT, parallel‐group design | China | Refractory glaucoma | Trab + MMC Trab + MMC + AMT | 35 | 35 | 32 | 12 | ||
| RCT | China | ACG | Trab Trab + AMT | 30 | 36 | N/A | 12 | ||
| RCT, parallel‐group design | Saudi Arabia | Refractory glaucoma | Trab + MMC Trab + MMC + AMT | 37 | 37 | 30 | 12 | ||
| RCT | Greece | POAG, uncontrolled IOP | Trab Trab + AMT | 50 | 59 | 52 | 24 | ||
| RCT, parallel‐group design | China | glaucoma | Trab Trab + AMT | 40 | 40 | N/A | 12 | ||
| RCT | China | Refractory glaucoma | Trab Trab + MMC Trab + MMC + AMT | 38 | 44 | N/A | 12 | ||
| RCT | China | PACG | Trab Trab + AMT | 52 | 63 | 63 | 6 | ||
| RCT, parallel‐group design | China | glaucoma | Trab Trab + AMT | 70 | 70 | N/A | 6 | ||
| RCT | China | ACG | Trab Trab + AMT | 39 | 52 | N/A | 6 | ||
| RCT | China | POAG, PACG | Trab + MMC Trab + AMT | 28 | 48 | N/A | 12 | ||
| Subtotal for amniotic membrane | 726 | N/A | N/A | Range 3 to 24 months | |||||
| E‐PTFE | RCT, parallel‐group design | Italy | POAG, PEXG, uncontrolled IOP | Trab Trab + MMC Trab + E‐PTFE Trab + MMC + E‐PTFE | 60 | 60 | 60 | 24 | |
| Subtotal for E‐PTFE | 60 | 60 | 60 | 24 | |||||
| Gelfilm | Birt 1998 (abstract) | RCT, parallel‐group design | Not reported | Not reported | Trab Trab + Gelfilm Trab + MMC Trab + MMC + Gelfilm | 43 | N/A | N/A | 12 |
| Subtotal for Gelfilm | 43 | N/A | N/A | 12 | |||||
| Total for all included studies | 1542 | N/A | N/A | Range 3 months to 5 years | |||||
ACG: angle‐closure glaucoma
AMT: amniotic membrane
E‐PTFE: expanded polytetrafluoroethylene
IOP: intraocular pressure
MMC: mitomycin C
N/A: not applicable
OAG: open‐angle glaucoma
PACG: primary angle‐closure glaucoma
PEXG: pseudoexfoliation glaucoma
POAG: primary open‐angle glaucoma
RCT: randomized controlled trial
Types of participants
The 33 studies included 1542 participants and had follow‐up periods ranging from three months to five years after surgery. The studies represented adults of both genders. One study did not specify the participants' diagnoses (Birt 1998), but all other studies included participants with different types of glaucoma, including primary open‐angle glaucoma, angle‐closure glaucoma, uveitic glaucoma, pseudophakic glaucoma, pseudoexfoliation glaucoma, refractory glaucoma, and uncontrolled intraocular pressure (IOP). None of the studies stratified participants by type of glaucoma, race, or lens type. These studies were conducted in North America, South America, Europe, Asia, and the Middle East.
Types of interventions
The 33 studies, reported in 36 full‐text articles and three conference abstracts, assessed five different devices used with standard trabeculectomy: Ex‐PRESS, Ologen, amniotic membrane, expanded polytetrafluoroethylene (E‐PTFE), and Gelfilm. No trials assessed silicon tube implant or SOLX Gold Shunt.
Five studies assessed the use of trabeculectomy with Ex‐PRESS compared with trabeculectomy alone (Dahan 2012; De Jong 2005; De Jong 2009; Netland 2014; Wagschal 2013). Five studies enrolled a total of 412 eyes of 386 participants. Four of the five studies were two‐arm studies that compared trabeculectomy alone versus trabulectomy and Ex‐PRESS, with mitomycin C (MMC) applied to both groups. One study was a three‐arm trial: (1) Ex‐PRESS implanted under scleral flap with standard trabeculectomy, (2) Ex‐PRESS implanted under conjunctiva with standard trabeculectomy, and (3) trabeculectomy alone (De Jong 2005).
Eight studies assessed the use of Ologen (Cillino 2011; Maheshwari 2012; Marey 2013; Mitra 2012; Papaconstantinou 2010; Rosentreter 2010; Rosentreter 2014; Senthil 2013). They enrolled a total of 333 eyes of 327 participants. While seven of the eight studies compared trabeculectomy + MMC with trabeculectomy + Ologen implant, one study compared trabeculectomy versus trabeculectomy + Ologen implant without any use of MMC or 5‐fluorouracil (5‐FU) (Papaconstantinou 2010).
Eighteen studies, reported in 17 full‐text articles and one conference abstract, assessed the use of amniotic membrane compared with trabeculectomy, with or without the use of MMC (Bruno 2008; Cai 2012; Cho 2013; Eliezer 2006; Huang 2007; Ji 2013; Khairy 2015; Li 2010; Liu 2009; Ren 2009; Sheha 2008; Stavrakas 2012; Wang 2008; Wang 2009; Yan 2004; Yang 2004; Zhang 2009; Zheng 2005). Findings from 13 of these studies were published in Chinese and accounted for 647 eyes of 536 participants, more than 70% of all 726 participants in the 18 studies.
One study assessed the use of E‐PTFE and compared four intervention groups: 1) trabeculectomy; 2) trabeculectomy + E‐PTFE; 3) trabeculectomy + MMC; and 4) trabeculectomy + E‐PTFE + MMC (Cillino 2008). The study included 60 eyes of 60 glaucoma participants who had primary open‐angle glaucoma, pseudoexfoliation glaucoma or uncontrolled IOP; 15 eyes of 15 participants were assigned to each of the four surgery groups. The study was conducted in Italy and all participants were followed for 24 months.
One study, which was reported only in a conference abstract, evaluated Gelfilm and MMC using a two‐by‐two factorial design, and compared outcomes among four intervention groups (Birt 1998). The study included 43 participants (number of eyes not specified): 14 participants in the trabeculectomy group, 11 in the trabeculectomy + Gelfilm group, seven in the trabeculectomy + MMC group, and 11 in the trabeculectomy + Gelfilm + MMC group. All participants completed one year of follow‐up.
Types of outcomes
All studies considered IOP control as their main outcome; however, the method in which IOP outcomes were reported differed among studies. None of the studies reported the data as change of IOP from baseline (although two studies reported individual participant data so we were able to calculate the mean change in IOP from baseline). All studies reported postoperative IOP at certain time points, and one study did not report any quantitative data but provided a descriptive summary only.
Thirteen studies reported visual acuity outcomes at different time points; one study reported visual field outcomes; and all studies reported postoperative complications. None of the studies reported IOP fluctuation or quality‐of‐life outcomes.
Funding sources
Of the 33 studies, the funding source of seven studies had been reported: six studies were supported by industry (Dahan 2012; De Jong 2009; Netland 2014; Rosentreter 2010; Rosentreter 2014; Wagschal 2013) and one study reported receiving no funding (Senthil 2013). Reports from the other 26 studies did not disclose information about sources of funding.
Excluded studies
We excluded 17 studies and listed the reasons for exclusion in the 'Characteristics of excluded studies' tables. We excluded nine studies due to insufficient information for confirmation of randomized controlled trial (RCT) status, three studies due to their inclusion of children under 18 years of age and failure to report outcomes for adult participants separately, two studies for not being RCTs, one study due to insufficient follow‐up time, one study with no device included in the comparison group, and one study was only available as a registered trial in clinicaltrials.gov with no indication of having enrolled participants.
Risk of bias in included studies
Figure 2 shows a summary of the 'Risk of bias in included studies' assessments. All but one study had a high risk of detection bias. Most studies either had missing or inadequate information in study reports to assess the risk of selection bias. A description for each domain is summarized below.

Risk of bias summary: review authors' judgements about each risk of bias item for each included study.
Allocation
Of the 33 studies, 10 specified adequate methods of randomization and we assessed them as being at low risk of bias: three out of five studies for Ex‐PRESS (De Jong 2009; Netland 2014; Wagschal 2013), four out of eight studies for Ologen (Cillino 2011; Papaconstantinou 2010; Rosentreter 2014; Senthil 2013), three out of 18 studies for amniotic membrane (Cho 2013; Khairy 2015; Stavrakas 2012). The one study that evaluated E‐PTFE did not use a completely random allocation method (medical chart number), so we judged it to be at high risk of bias (Cillino 2008). All other 22 studies did not specify methods for random sequence generation, so we judged them to be at unclear risk of bias.
Of the 33 studies, only three performed proper allocation concealment and we judged them to be at low risk of bias: one out of eight studies for Ologen, one out of 18 studies for amniotic membrane, and one study for E‐PTFE (Cho 2013; Cillino 2008; Cillino 2011). We judged Khairy 2015 to be at high risk of bias as the investigators labeled the envelope used to allocate the treatment. The other 29 studies did not specify the method for allocation concealment, so we judged them to be at unclear risk of bias.
Masking (performance bias and detection bias)
Authors of reports from 14 of the 33 studies noted masking of participants: two of five studies for Ex‐PRESS (Dahan 2012; De Jong 2009), six of eight studies for Ologen (Cillino 2011; Marey 2013; Papaconstantinou 2010; Rosentreter 2010; Rosentreter 2014; Senthil 2013), five of 18 studies for amniotic membrane (Eliezer 2006; Khairy 2015; Liu 2009; Sheha 2008; Stavrakas 2012), and one study for E‐PTFE (Cillino 2008). The remaining 19 studies did not report whether participants were masked and we judged them to be at unclear risk of performance bias. Because masking of surgeons is logistically difficult and because trabeculectomy is a standardized procedure (all 14 studies described the surgical procedures in detail), we did not consider the lack of masking of surgeons to be an important modifiable source of bias.
Investigators of one of the 33 studies reported masking of outcome assessors (Cillino 2011) and one study used a special protocol to minimize bias (Netland 2014); we judged these two studies to be at low and unclear risk of detection bias, respectively. None of the other 31 studies specified masking of outcome assessors. Due to the easy detection of devices when examining the eye, unmasked outcome assessors could tend to anticipate and thus report favorable change in IOP among participants with the implant or alternatively, among participants who received the surgery the outcome assessor preferred; we therefore judged these studies to be at high risk of detection bias.
Incomplete outcome data
Of the 33 studies, investigators of 17 studies reported few or no losses to follow‐up, resulting in our assessment of them to be at low risk of attrition bias: four of six trials of Ex‐PRESS (Dahan 2012; De Jong 2009; Netland 2014; Wagschal 2013), five of eight studies for Ologen (Cillino 2011; Marey 2013; Papaconstantinou 2010; Rosentreter 2010; Rosentreter 2014), six of 18 studies for amniotic membrane (Cai 2012; Eliezer 2006; Ji 2013; Khairy 2015; Liu 2009; Stavrakas 2012), one study for E‐PTFE (Cillino 2008), and one study for Gelfilm (Birt 1998). Four studies had a relatively large percentage of losses to follow‐up (> 10%) and we assessed the risk of attrition bias to be high for these studies (Bruno 2008; Cho 2013; Senthil 2013; Sheha 2008). We assessed the remaining 12 studies at unclear risk of attrition bias as they did not report the number of losses to follow‐up; nine of the 12 studies were amniotic membrane studies.
Selective reporting
We judged 16 of 33 studies as being at low risk of reporting bias as they had 1) clinical trial registry records and reported all outcomes listed in the registry (Dahan 2012; Netland 2014; Rosentreter 2010; Rosentreter 2014; Wagschal 2013), or 2) reported all outcome measures defined in the Methods section of the full‐text reports (Cho 2013; De Jong 2005; De Jong 2009; Marey 2013; Mitra 2012; Papaconstantinou 2010; Senthil 2013; Sheha 2008; Stavrakas 2012; Wang 2008; Zhang 2009). We judged six studies to have unclear risk of bias because some outcomes that were measured were not reported in primary result papers, but we presume they will be reported in future publications from the trials (Bruno 2008; Cillino 2008; Cillino 2011; Ji 2013; Maheshwari 2012). We rated the remaining 11 studies at high risk of bias, as the outcome measures were not defined in the Methods section of the full text and no protocol or trial registration was publicly available.
Studies judged to be at low risk of reporting bias by devices: all studies for Ex‐PRESS, six of eight studies for Ologen, and five of 18 studies for amniotic membrane (Cho 2013; Sheha 2008; Stavrakas 2012; Wang 2008; Zhang 2009). Studies judged to be at unclear risk of reporting bias by devices: one of eight studies for Ologen, two of 18 studies for amniotic membrane, the only study that evaluated E‐PTFE (Bruno 2008; Cillino 2008; Cillino 2011; Ji 2013; Maheshwari 2012). The study for Gelfilm was at a high risk of reporting bias (Birt 1998), as were 11 of 18 studies for amniotic membrane (Cai 2012; Eliezer 2006; Huang 2007; Khairy 2015; Li 2010; Liu 2009; Ren 2009; Wang 2009; Yan 2004; Yang 2004; Zheng 2005).
Other potential sources of bias
We judged one out of 33 included studies to be at low risk of having other potential sources of bias. We judged three studies to be at high risk because one did not recruit an adequate number of participants that met the prespecified power requirements of the study (Rosentreter 2010), and two studies received funding from the manufacturer of the device (Dahan 2012; Netland 2014). We judged the remaining studies to be at unclear risk of bias, as methodological details were reported insufficiently to render a judgment of low or high risk of bias.
Effects of interventions
See: Summary of findings for the main comparison Summary of findings for Ex‐PRESS; Summary of findings 2 Summary of findings for Ologen; Summary of findings 3 Summary of findings for amniotic membrane
Trabeculectomy + Ex‐PRESS versus trabeculectomy
Five studies assessed the use of Ex‐PRESS (Dahan 2012; De Jong 2005; De Jong 2009; Netland 2014; Wagschal 2013). Four of five studies reported a sample size calculation: Dahan 2012 had a power of 96% to detect a 2.0 mm Hg intraocular pressure (IOP) difference between groups; De Jong 2009 had a power of 80% to detect a 32% between‐group difference in IOP; and both Netland 2014 and Wagschal 2013 had power of 80% to detect a 2.0 mm Hg IOP difference between groups. De Jong 2005 did not report a power or sample size calculation. The overall risk of bias for these studies was high or unclear, especially with respect to detection bias and potential conflicts of interest. Four of five studies reported receiving some funding or resource support from the device manufacturer (Dahan 2012; De Jong 2009; Netland 2014; Wagschal 2013) and one study did not reported information on potential conflicts of interest (De Jong 2005).
Intraocular pressure (IOP)
Four studies reported postoperative IOP at follow‐up time points (Dahan 2012; De Jong 2009; Netland 2014; Wagschal 2013). Dahan 2012 reported IOP data at last follow‐up time point and presented a figure with IOP reduction over time. The study encompassed 30 eyes of 15 participants at one year, 20 eyes of 10 participants at two years, and 14 eyes of seven participants at 30 months (last follow‐up). Upon our request, the study investigators shared their original data, so we were able to calculate the mean change in IOP from baseline to one‐year follow‐up and postoperative IOP at various follow‐up time points (months 6, 12, and 24).
At one year, only Dahan 2012 provided data on the mean change in mean IOP for 30 eyes of 15 participants from baseline to one‐year follow‐up. We calculated the mean change in IOP from baseline to one‐year follow‐up. It is uncertain whether use of Ex‐PRESS (MD ‐14.07, SD 8.50) leads to IOP reduction at one year (MD ‐14.73, SD 12.60) because the quality of the evidence is very low (MD 0.67, 95% CI ‐7.52 to 8.86).
At one year, three studies comprising 165 eyes reported mean IOP by treatment group (Dahan 2012; De Jong 2009; Wagschal 2013). We rated the low‐quality evidence at high risk of detection and publication bias. We found that the use of Ex‐PRESS may lead to a slightly improved IOP reduction at one year (Analysis 1.1; Figure 3; MD ‐1.58 mm Hg, 95% CI ‐2.74 to ‐0.42; I² = 0%). A fourth study did not provide quantitative data, but reported that there was no between‐group difference in IOP reduction at one year (Netland 2014).
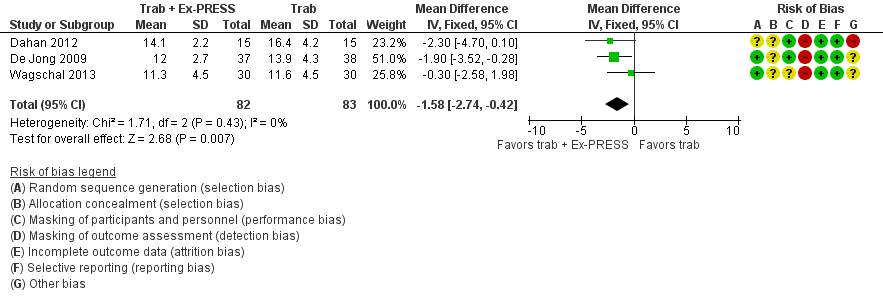
Forest plot of comparison: 2 Trabeculectomy + Ex‐PRESS versus Trabeculectomy, outcome: Postoperative IOP at one year.
At six months, three studies comprising 205 eyes reported mean IOP (Dahan 2012; Netland 2014; Wagschal 2013). It is unclear whether the use of Ex‐PRESS leads to IOP reduction at six months because the quality of the evidence is very low (Analysis 1.2; MD 0.18, 95% CI ‐0.90 to 1.26). The I² was 75%, indicating inconsistency in the effect of treatments among studies.
At two years, three studies comprising 212 eyes reported IOP outcomes (Dahan 2012; De Jong 2009; Netland 2014). The low‐quality evidence shows Ex‐PRESS may slightly improve IOP reduction at two years (Analysis 1.3; MD ‐1.45 mm Hg, 95% CI ‐2.52 to ‐0.37).
Best‐corrected visual acuity (BCVA) at one year postintervention
We combined Wagschal 2013 and Dahan 2012 in a meta‐analysis for logMAR BCVA at one year. We judged the very low‐quality evidence to be at high risk of detection and publication bias. It is unclear whether Ex‐PRESS prevents loss in BCVA because the quality of the evidence is very low (Analysis 1.4; MD ‐0.15, 95% CI ‐0.40 to 0.10; 90 eyes).
Wagschal 2013 reported logMAR BCVA at one year, but Dahan 2012 did not publish quantitative data for this outcome. The authors of Dahan 2012 provided us with original data from which we calculated the postoperative mean logMAR BCVA to be 0.41 ± 0.11 (mean ± SE) for the Ex‐PRESS group and 0.43 ± 1.33 (mean ± SE) for the trabeculectomy group at one year.
Although De Jong 2009 also assessed visual acuity preoperatively and at each follow‐up visit, quantitative data were not reported. They reported that visual acuity remained equivalent in the majority of participants, with no significant difference between the groups at one year. Netland 2014 did not report on this outcome.
IOP fluctuation, visual field, and quality of life
No study reported these outcomes.
Complications
All four full‐text studies reported complications in a total of 294 eyes during their respective follow‐up visits. The four studies had different lengths of follow‐up periods, ranging from one to two years. We considered the reported postoperative complications as occurring within the first year after surgery. These results should be interpreted with caution, due to possible differences in length of follow‐up. We conducted a meta‐analysis using the proportion of participants with each complication in each group (Analysis 1.5). De Jong 2005 did not report any complications.
Loss of vision of more than two lines
Wagschal 2013 reported loss of vision more than two lines of BCVA within and after the first six months follow‐up. Within the first six months follow‐up period, there were seven of 30 eyes in the trabeculectomy group and 11 of 31 eyes in the Ex‐PRESS group with loss of vision more than two lines of BCVA (RR 0.66, 95% CI 0.29 to 1.47).
IOP < 5 mm Hg (hypotony)
Two studies comprising 94 eyes reported this complication (Dahan 2012; Wagschal 2013). We judged the very low‐quality evidence to be at high risk of detection and publication bias. It is unclear whether Ex‐PRESS prevents hypotony because the quality of the evidence is very low (Analysis 1.5.1; RR 0.92, 95% CI 0.63 to 1.33).
None of the included studies reported these complications: Surgical revision within three months and one year after surgery, endophthalmitis or blebitis, retinal detachment, corneal transplant, cataract extraction (among phakic eyes), choroidal hemorrhage.
Others as reported from the included studies
Other complications not included in the protocol were: shallow/flat anterior chamber, hyphema, and needling.
Shallow/flat anterior chamber
Four studies comprising 294 eyes reported this complication (Dahan 2012; De Jong 2009; Netland 2014; Wagschal 2013). We rated the very low‐quality evidence at high risk of detection and publication bias. It is unclear whether Ex‐PRESS prevents shallow/flat anterior chamber because the quality of the evidence is very low (Analysis 1.5.2; RR 0.72, 95% CI 0.40 to 1.32).
Bleb leakage
Four studies comprising 294 eyes reported this complication (Dahan 2012; De Jong 2009; Netland 2014; Wagschal 2013). It is unclear whether Ex‐PRESS prevents bleb leakage because the quality of the evidence is very low (Analysis 1.5.3; RR 1.26, 95% CI 0.50 to 3.20).
Hyphema
Four studies comprising 294 eyes reported this complication (Dahan 2012; De Jong 2009; Netland 2014; Wagschal 2013). The low‐quality evidence shows that Ex‐PRESS may prevent hyphema (Analysis 1.5.4; RR 0.33, 95% CI 0.12 to 0.94).
Cataract surgery
Three studies comprising 264 eyes reported this complication (De Jong 2009; Netland 2014; Wagschal 2013). The low‐quality evidence shows that Ex‐PRESS may prevent cataract surgery (Analysis 1.5.5; RR 0.32, 95% CI 0.14 to 0.74).
Needling
Only one study covering 80 eyes reported this complication (De Jong 2009). There were nine of 40 eyes in the trabeculectomy group and three of 40 eyes in the Ex‐PRESS group that required needling. The low‐quality evidence shows that the use of Ex‐PRESS may prevent needling (RR 0.33, 95% CI 0.10 to 1.14).
Trabeculectomy + Ologen versus trabeculectomy
Eight studies assessed the use of Ologen during trabeculectomy (Cillino 2011; Maheshwari 2012; Marey 2013; Mitra 2012; Papaconstantinou 2010; Rosentreter 2010; Rosentreter 2014; Senthil 2013). Only three studies reported sample size calculations. Cillino 2011 reported a power of 90% to detect a 3 mm Hg IOP difference between groups; Rosentreter 2014 reported a power of 50% to detect a 2.73 mm Hg IOP difference between groups and a power of 95% to detect a difference of 5.03 mm Hg in IOP. The sample size calculation originally performed for Rosentreter 2010 targeted 40 participants, but the desired power was not reported. Only 20 participants enrolled. We judged the very low‐quality evidence on IOP and BCVA outcomes at all follow‐up time points to be at high risk of detection and publication bias.
Intraocular pressure (IOP)
Overall, the effect of Ologen on IOP compared to trabeculectomy alone is uncertain (Analysis 2.1). None of the eight studies reported mean change in IOP from baseline. However, two of eight studies reported individual participant data, so we were able to calculate the mean change in IOP from baseline to all follow‐up time points between the trabeculectomy‐alone group and the Ologen group (Rosentreter 2010; Rosentreter 2014). It is uncertain whether Ologen led to IOP reduction because the quality of the evidence is very low at every follow‐up time point (Figure 4; Analysis 2.1.1; MD ‐0.32 mm Hg, 95% CI ‐5.88 to 5.24). Six of eight studies reported postoperative IOP at certain time points instead, and these six studies had comparable baseline IOP values between groups, except for Maheshwari 2012. For the six studies without reporting of change of IOPs, we analyzed the postoperative IOP at certain time points between groups as a surrogate for mean difference in change of IOP from baseline between groups.

Forest plot of comparison: 2 Trabeculectomy (Trab) + Ologen versus Trabeculectomy (Trab), outcome: 2.1 IOP at one year.
At one year, six studies comprising 217 eyes reported IOP outcomes (Cillino 2011; Maheshwari 2012; Marey 2013; Rosentreter 2010; Rosentreter 2014; Senthil 2013). We excluded Maheshwari 2012 from the pooled analysis as the baseline IOP in Maheshwari 2012 differed between the two groups. At one year, they reported a mean IOP of 15.6 mm Hg, and a 43% reduction in IOP from baseline in the Ologen group, and a mean IOP of 10.5 mm Hg, and a 50% reduction in IOP in the trabeculectomy‐alone group. However, the two groups were not comparable as the baseline IOP in the Ologen group was about 30% greater than in the trabeculectomy‐alone group. It is unclear whether Ologen improves IOP reduction at one year because the quality of the evidence is very low (Analysis 2.1; MD 1.40 mm Hg, 95% CI ‐0.57 to 3.38; 5 studies). The I² was not substantial (I² = 0%) and no study showed a clinical difference between groups, so we combined the data.
At the first day after surgery, five studies comprising 162 eyes reported IOP outcomes (Cillino 2011; Papaconstantinou 2010; Rosentreter 2010; Rosentreter 2014; Senthil 2013). It is unclear whether Ologen improves IOP reduction because the quality of the evidence is very low (Analysis 2.2; MD 0.51, 95% CI ‐1.95 to 2.97). Although there was substantial statistical heterogeneity (I² = 55%), mostly due to Cillino 2011, we combined the data as there was a high degree of overlap among the confidence intervals of studies.
At six months, seven studies comprising 282 eyes reported on IOP outcomes (Cillino 2011; Marey 2013; Mitra 2012; Papaconstantinou 2010; Rosentreter 2010; Rosentreter 2014; Senthil 2013). It is unclear whether Ologen improves IOP reduction because the quality of the evidence is very low (Analysis 2.3.1; MD ‐1.24 mm Hg, 95% CI ‐6.23 to 3.76; I² = 0%; Rosentreter 2010; Rosentreter 2014). Similarly, at six months follow‐up, we found that it is unclear whether Ologen improves IOP reduction because the quality of the evidence is very low (Analysis 2.3.2; MD 0.43, 95% CI ‐0.97 to 1.84). Although there was substantial heterogeneity (I² = 53%), no study showed a clinical difference between groups, so we combined the data.
At two years, the longest length of follow‐up in two studies comprising 55 eyes (Cillino 2011; Senthil 2013), it is unclear whether Ologen improves IOP reduction because the quality of the evidence is very low (Analysis 2.4; MD 0.20 mm Hg, 95% CI ‐1.29 to 1.69).
Best‐corrected visual acuity (BCVA)
Two studies comprising 51 eyes reported BCVA data at different time points. None of the studies reported BCVA at one year after surgery.
Senthil 2013 reported BCVA for 32 eyes at six weeks post‐surgery. We judged the very low‐quality evidence to be at high risk of detection and attrition bias. The BCVA for the Ologen group was 0.44 ± 0.66 (mean ± SD) and for the trabeculectomy‐alone group was 0.20 ± 0.24 (mean ± SD), and showed it is uncertain whether use of Ologen may prevent loss in BCVA (MD ‐0.24 logMAR, 95% CI ‐0.58 to 0.10). The estimated mean difference is equivalent to more than two lines on a logMAR chart; however, the small number of participants yielded a wide confidence interval.
Rosentreter 2010 reported that in all 19 eyes observed, the visual acuity remained stable over the one‐year follow‐up (no data provided).
Visual field
Only one study reported on this outcome (Rosentreter 2010). It reported that the visual field remained stable over one‐year follow‐up among all 19 participants but did not provide any data.
IOP fluctuation and quality of life
No study reported these outcomes.
Complications
All eight studies reported complications in 333 eyes of 327 participants during their respective follow‐up visits, with the exception of Maheshwari 2012, who reported no complications. Although these studies had different lengths of follow‐up, ranging from six months to two years, we assumed that most postoperative complications occurred within the first six months after the surgery, so we combined the data in the meta‐analyses. These results should be interpreted with caution, due to our assumption that the complications all occurred within the six‐month window. Other complications not included in the protocol were: bleb leakage, hyphema, choroidal detachment, shallow anterior chamber, Tenon's cysts, anterior chamber reaction, positive Seidel test, needling, and flat anterior chamber. We judged the very low‐quality evidence to be at high risk of detection and publication bias, and are therefore uncertain if there is a difference between the two groups for each complication (Analysis 2.5).
Loss of vision of more than two lines
None of the included studies reported this complication.
IOP < 5 mm Hg (hypotony)
Six studies including 233 eyes reported this complication (Cillino 2011; Mitra 2012; Papaconstantinou 2010; Rosentreter 2010; Rosentreter 2014; Senthil 2013). It is unclear whether use of Ologen prevents hypotony because the quality of the evidence is very low (Analysis 2.5.1; RR 0.75, 95% CI 0.47 to 1.19).
Surgical revision within three months and one year after surgery
Four studies including 150 eyes reported this complication (Marey 2013; Papaconstantinou 2010; Rosentreter 2010; Rosentreter 2014). It is unclear whether use of Ologen prevents surgical revision within three months and one year after surgery, because the quality of the evidence is very low (Analysis 2.5.2; RR 1.70, 95% CI 0.38 to 7.63).
Endophthalmitis or blebitis
Three studies including 164 eyes reported this complication (Marey 2013; Mitra 2012; Papaconstantinou 2010). It is unclear whether use of Ologen prevents endophthalmitis or blebitis because the quality of the evidence is very low (Analysis 2.5.3; RR 1.57, 95% CI 0.25 to 9.70).
None of the included studies reported these complications: retinal detachment, corneal transplant, cataract extraction (among phakic eyes), and choroidal hemorrhage.
Others as reported from the included studies
Bleb leakage
Four studies including 129 eyes reported this complication (Cillino 2011; Rosentreter 2010; Rosentreter 2014; Senthil 2013). It is unclear whether use of Ologen prevents bleb leakage because the quality of the evidence is very low (Analysis 2.5.4; RR 0.85, 95% CI 0.33 to 2.20).
Hyphema
Six studies including 229 eyes reported this complication (Cillino 2011; Marey 2013; Papaconstantinou 2010; Rosentreter 2010; Rosentreter 2014; Senthil 2013). It is unclear whether use of Ologen prevents hyphema because the quality of the evidence is very low (Analysis 2.5.5; RR 1.46, 95% CI 0.51 to 4.19).
Choroidal detachment
Four studies including 129 eyes reported this complication (Cillino 2011; Rosentreter 2010; Rosentreter 2014; Senthil 2013). It is unclear whether use of Ologen prevents choroidal detachment because the quality of the evidence is very low (Analysis 2.5.6; RR 0.83, 95% CI 0.33 to 2.09).
Shallow anterior chamber
Five studies including 213 eyes reported this complication (Marey 2013; Mitra 2012; Rosentreter 2010; Rosentreter 2014; Senthil 2013). It is unclear whether use of Ologen prevents shallow anterior chamber because the quality of the evidence is very low (Analysis 2.5.7; RR 0.79, 95% CI 0.32 to 1.93).
Anterior chamber reaction
Two studies including 99 eyes reported this complication (Marey 2013; Senthil 2013). It is unclear whether use of Ologen prevents anterior chamber reaction because the quality of the evidence is very low (Analysis 2.5.8; RR 1.21, 95% CI 0.56 to 2.60)
Positive Seidel test
Three studies including 164 eyes reported this complication (Marey 2013; Mitra 2012; Papaconstantinou 2010). It is unclear whether use of Ologen prevents a positive Seidel test because the quality of the evidence is very low (Analysis 2.5.9; RR 1.93, 95% CI 0.32 to 11.54)
Tenon's cysts
Three studies including 124 eyes reported this complication (Mitra 2012; Papaconstantinou 2010; Rosentreter 2010). It is unclear whether use of Ologen prevents Tenon's cysts because the quality of the evidence is very low (Analysis 2.5.10; RR 0.88, 95% CI 0.21 to 3.66)
Flat anterior chamber
Only one study covering 40 eyes reported this complication (Papaconstantinou 2010). There was one of 20 eyes in the trabeculectomy‐alone group and two of 20 eyes in the Ex‐PRESS group with flat anterior chamber, and it is unclear whether use of Ologen prevents flat anterior chamber because the quality of the evidence is very low (RR 2.00, 95% CI 0.20 to 20.33)
Trabeculectomy + AMT (amniotic membrane) versus trabeculectomy
We identified 18 studies that compared the use of amniotic membrane (AMT) during trabeculectomy versus standard trabeculectomy (Bruno 2008; Cai 2012; Cho 2013; Eliezer 2006; Huang 2007; Ji 2013; Khairy 2015; Li 2010; Liu 2009; Ren 2009; Sheha 2008; Stavrakas 2012; Wang 2008; Wang 2009; Yan 2004; Yang 2004; Zhang 2009; Zheng 2005). Only one study reported a sample size calculation, where a power of 80% was achieved with a sample size of 15 participants (Sheha 2008). However, the minimum detectable difference was not specified. In consideration of potential losses to follow‐up, the study recruited 37 participants.
Intraocular pressure (IOP)
None of the 18 included studies reported change in IOP from baseline; instead, they all reported postoperative IOP at follow‐up time points. Caution must be used in interpreting the evidence from each time point, as a lower mean IOP favoring the amniotic membrane group could be attributable to eyes in the amniotic membrane group having a lower baseline IOP. Futhermore, we judged most studies to be at high risk of detection and reporting bias.
Among the 18 studies, only seven accounted for participants lost to follow‐up, whereby 316 of 346 eyes were assessed at their respective last follow‐up visits. For the remaining 11 studies we used the eyes randomized in data analyses (see Table 1 for losses to follow‐up). Numbers of eyes below refers to those randomized, when numbers of eyes analyzed were not reported. Wang 2009 had three groups, including trabeculectomy, trabeculectomy + MMC, and trabeculectomy + amniotic membrane + MMC. We only analyzed the latter two groups, as they both included MMC.
Of the 18 studies, one was a conference abstract that did not give any IOP data in the results (Bruno 2008). However, it concluded that smaller IOP changes were associated with larger avascular blebs. Another study reported median IOP values and the inter‐quartile range from 52 eyes (Stavrakas 2012). The median IOP at 24 months was 15.5 mm Hg for the amniotic membrane group and 16 mm Hg for the trabeculectomy‐alone group. It did not report a median difference, but reported that there was no difference between the two groups. The remaining 16 studies provided postoperative IOP findings at various time points; we summarize data from those 16 studies below.
At one year, nine studies comprising 356 eyes provided postoperative IOP data (Cai 2012; Eliezer 2006; Ji 2013; Khairy 2015; Li 2010; Liu 2009; Ren 2009; Sheha 2008; Wang 2009). The low‐quality evidence showed that the use of amniotic membrane may slightly improves IOP reduction (Analysis 3.1; Figure 5; MD ‐3.92 mm Hg, 95% CI ‐5.41 to ‐2.42; I² = 84%). We stratified these studies on whether MMC was applied to both groups or to neither group or to the trabeculectomy‐alone group, and found no differences from the overall results. Because Khairy 2015 is the only study that does not have comparable groups (MMC was added to one group only), we excluded that study in a sensitivity analysis, and found the pooled mean IOP in the amniotic membrane group to be about 4 mm Hg lower than in the trabeculectomy‐alone group (MD ‐4.38, 95% CI ‐5.77 to ‐2.98).

Forest plot of comparison: 4 Trabeculectomy + AMT (amniotic membrane) versus Trabeculectomy, outcome: 4.1 Postoperative IOP at one year.
At one day, eight studies comprising 405 eyes provided postoperative IOP data (Huang 2007; Khairy 2015; Liu 2009; Sheha 2008; Wang 2008; Yan 2004; Yang 2004; Zheng 2005). We did not report the pooled data as the results of different studies were inconsistent in the direction of effect and there was substantial heterogeneity (I² = 91%). There was also substantial statistical heterogeneity for two subgroups: 'with MMC in both groups' (I² = 75%) and 'without MMC in both groups' (I² = 95%). The subgroup 'with MMC in the trabeculectomy group' had no substantial heterogeneity (I² = 0%) and each study showed that It remains uncertain if there is a difference in mean IOP comparing the AMT and trabeculectomy‐alone groups (Analysis 3.2).
At one week, 13 studies comprising 625 eyes provided postoperative IOP data (Cai 2012; Cho 2013; Huang 2007; Ji 2013; Khairy 2015; Li 2010; Liu 2009; Sheha 2008; Wang 2008; Wang 2009; Yan 2004; Yang 2004; Zheng 2005). We did not combine the data as results of different studies were inconsistent in the direction of effect and there was substantial heterogeneous (I² = 89%). There was also substantial statistical heterogeneity for two subgroups: 'with MMC in both groups' (I² = 96%) and 'without MMC in both groups' (I² = 87%) . The subgroup 'with MMC in the trabeculectomy‐only group' had no substantial statistical heterogeneity (I² = 48%) and each study showed that there was no difference in mean IOP comparing the AMT and trabeculectomy‐alone groups (Analysis 3.3).
At one month, 13 studies comprising 646 eyes provided postoperative IOP data (Cai 2012;Cho 2013; Huang 2007; Ji 2013; Khairy 2015; Li 2010; Liu 2009; Sheha 2008; Wang 2008; Yan 2004; Yang 2004; Zhang 2009; Zheng 2005), and suggests that the use of amniotic membrane may lead to little or no difference in IOP‐lowering effect (Analysis 3.4; MD ‐1.05 mm Hg, 95% CI ‐1.96 to ‐0.13). We stratified these studies on whether MMC was applied to both or neither or to the trabeculectomy‐alone group and found the results to be the same as the overall results. Although there was overall substantial statistical heterogeneity (I² = 83%), we combined the data as the direction of effect was consistent in favoring the amniotic membrane group.
At three months, 11 studies comprising 551 eyes provided postoperative IOP data (Cho 2013; Huang 2007; Ji 2013; Khairy 2015; Li 2010; Liu 2009; Sheha 2008; Yan 2004; Yang 2004; Zhang 2009; Zheng 2005), and showed the use of amniotic membrane may slightly improve IOP reduction compared to the trabeculectomy‐alone group (Analysis 3.5; MD ‐2.23 mm Hg, 95% CI ‐2.93 to ‐1.53) . We stratified these studies on whether MMC was applied to both or neither or to the trabeculectomy‐alone group and found no differences from the overall results. As with one‐year outcomes, Khairy 2015 and Zheng 2005 were the only studies that included MMC in the trabeculectomy‐only group. We excluded these two studies in a sensitivity analysis, which showed that IOP in the amniotic membrane group was 2.54 mm Hg lower than in the trabeculectomy‐only group at three months (MD ‐2.54, 95% CI ‐3.27 to ‐1.81). Although there was substantial statistical heterogeneity (I² = 62%), we combined the data as the direction of effect was consistent in favoring the amniotic membrane group. It also is important to note that there was a lot of missing data for these studies due to underreporting of numbers of eyes analyzed at different time points, and the results were likely to be biased.
At six months, 13 studies comprising 613 eyes provided postoperative mean IOP data (Huang 2007; Ji 2013; Khairy 2015; Li 2010; Liu 2009; Ren 2009; Sheha 2008; Wang 2008; Wang 2009; Yan 2004; Yang 2004; Zhang 2009; Zheng 2005), and showed the use of amniotic membrane may slightly improve IOP reduction compared to the trabeculectomy‐alone group (Analysis 3.6; MD ‐2.50 mm Hg, 95% CI ‐3.34 to ‐1.67). We stratified these studies on whether MMC was applied to both or neither or to the trabeculectomy‐alone group and the results still show an IOP‐lowering effect favoring the amniotic membrane group. Although there was overall substantial statistical heterogeneity (I² = 74%), we combined the data as the direction of effect was consistent in favoring the amniotic membrane group.
At two years, two studies comprising 86 eyes provided postoperative mean IOP data (Analysis 3.7; Ji 2013; Khairy 2015). Although Khairy 2015 showed no difference between the two groups, the study only applied MMC in the trabeculectomy‐alone group and the groups were not comparable to Ji 2013 (which did not apply MMC to both groups). Ji 2013 reported that IOP in the amniotic membrane group was 2.96 mm Hg lower than the trabeculectomy‐alone group (MD ‐2.96, 95% CI ‐5.52 to ‐0.40). Due to the substantial statistical heterogeneity (I² = 64%), methodological heterogeneity, and high risk of bias, we did not combine these two studies.
Best‐corrected visual acuity (BCVA)
Only one study comprising 48 eyes reported BCVA at one year and reported that the amniotic membrane group had better BCVA than the trabeculectomy‐alone group, but no additional data were provided (Cai 2012).
IOP fluctuation, visual field and quality of life
No study reported on these outcomes.
Complications
All 17 studies reported in full‐length articles provided data on complications in 840 eyes during postoperative follow‐up. We compared proportions of participants with each complication between groups in meta‐analyses. Complications reported included loss of vision, hypotony, shallow anterior chamber, hyphema, bleb leakage, encapsulated blebs, choroidal detachment, anterior chamber reaction, and flat anterior chamber. Complications were less frequent in the amniotic membrane group than in the trabeculectomy‐alone group (Analysis 3.8), except for anterior chamber reaction (Li 2010).
Loss of vision of more than two lines
None of the included studies reported this complication.
IOP < 5 mm Hg (hypotony)
Five studies including 205 eyes reported this complication (Khairy 2015; Liu 2009; Ren 2009; Sheha 2008; Zheng 2005). The low‐quality evidence showed use of amniotic membrane may prevent hypotony (Analysis 3.8.1; RR 0.40, 95% CI 0.17 to 0.94).
None of the included studies reported these complications: surgical revision within three months and one year after surgery, endophthalmitis or blebitis, retinal detachment, corneal transplant, cataract extraction (among phakic eyes), and choroidal hemorrhage.
Others as reported from the included studies
Shallow anterior chamber
Thirteen studies including 632 eyes reported this complication (Cho 2013; Eliezer 2006; Huang 2007; Ji 2013; Khairy 2015; Li 2010; Ren 2009; Wang 2008; Wang 2009; Yan 2004; Yang 2004; Zhang 2009; Zheng 2005). The low‐quality evidence showed that use of amniotic membrane may prevent shallow anterior chamber (Analysis 3.8.2; RR 0.47, 95% CI 0.30 to 0.73).
Hyphema
Five studies including 235 eyes reported this complication (Cai 2012; Cho 2013; Sheha 2008; Wang 2009; Yang 2004). It is unclear whether use of amniotic membrane prevents hyphema because the quality of the evidence is very low (Analysis 3.8.3; RR 0.43, 95% CI 0.14 to 1.34).
Bleb leakage
Two studies including 98 eyes reported this complication (Cho 2013; Zheng 2005). The low‐quality evidence showed use of amniotic membrane may prevent bleb leakage (Analysis 3.8.4; RR 0.28, 95% CI 0.10 to 0.79).
Encapsulated blebs
Five studies including 175 eyes reported this complication (Eliezer 2006; Ji 2013; Liu 2009; Sheha 2008; Wang 2008). The low‐quality evidence showed use of amniotic membrane may prevent encapsulated blebs (Analysis 3.8.5; RR 0.23, 95% CI 0.08 to 0.69).
Choroidal detachment
Four studies including 187 eyes reported this complication (Eliezer 2006; Ji 2013; Li 2010; Stavrakas 2012). The low‐quality evidence showed use of amniotic membrane may prevent choroidal detachment (Analysis 3.8.6; RR 0.47, 95% CI 0.13 to 1.71).
Anterior chamber reaction
Only one study comprising 62 eyes reported this complication (Li 2010). There were 21 of 30 eyes in the trabeculectomy‐alone group and 25 of 32 eyes in the AMT group with flat anterior chamber, but there was uncertainty if the relative risk of flat anterior chamber favored the AMT or the trabeculectomy‐alone group, as the result was statistically non‐significant (RR 1.12, 95% CI 0.83 to 1.50).
Flat anterior chamber
Only one study comprising 37 eyes reported this complication (Sheha 2008). There were two of 18 eyes in the trabeculectomy‐alone group and none of 19 eyes in the AMT group with flat anterior chamber, but there was uncertainty if the relative risk of flat anterior chamber favored the AMT or the trabeculectomy‐alone group, as the result was statistically non‐significant (RR 0.19, 95% CI 0.01 to 3.71).
Trabeculectomy + expanded polytetrafluoroethylene (E‐PTFE) versus trabeculectomy
One study assessed the use of E‐PTFE (Cillino 2008). Because all participants completed 24 months of follow‐up, all 60 eyes of 60 participants contributed to all of the following outcomes measured. The study performed sample size calculations, based on a power of 90% or greater to detect at least a 3 mm Hg IOP difference among groups. Cillino 2008 did not report on IOP fluctuation, BCVA, visual field, or quality of life.
Intraocular pressure (IOP)
The study did not report change in IOP from baseline; instead, it reported postoperative IOP measured at one day, one week, and 1, 3, 6, 9, 12, 18, and 24 months. It also reported that baseline IOPs among the four intervention groups did not show any statistically significant differences. We therefore compared the postoperative IOP among groups as a surrogate for change of IOP from baseline between groups. At all follow‐up time points, it remains uncertain if there is a difference between the intervention groups. Specifically, at one year, the low‐quality evidence showed that use of E‐PTFE may lead to little or no difference in lower mean IOP compared to use of trabeculectomy alone (MD ‐0.44 mm Hg, 95% CI ‐1.76 to 0.88), and it remains uncertain if there is a between‐group difference with or without the use of MMC (Analysis 4.1; Figure 6; with MMC: MD 0.10, 95% CI ‐1.58 to 1.78; without MMC: MD ‐1.30, 95% CI ‐3.42 to 0.82).
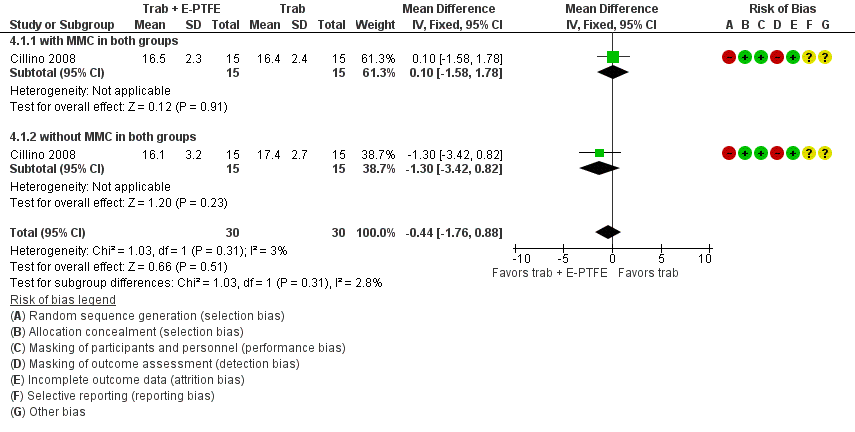
Forest plot of comparison: 1 Trabeculectomy + E‐PTFE versus Trabeculectomy, outcome: 1.1 Postoperative IOP at one year.
IOP fluctuation, BCVA, visual field, and quality of life
Cillino 2008 did not report on IOP fluctuation, BCVA, visual field, or quality of life.
Complications
The study assessed complications at 24 months, including other complications: hyphema, inflammation, shallow anterior chamber, flat anterior chamber, choroidal detachment, and cystic/avascular bleb.
Loss of vision of more than two lines
The included study did not report this complication.
IOP < 5 mm Hg (hypotony)
There were 14 of 30 eyes in the trabeculectomy‐alone group and four of 30 eyes in the E‐PTFE group with hypotony. We judged the very low‐quality evidence to be at high risk of selection and detection bias. It is unclear whether use of E‐PTFE prevents hypotony because the quality of the evidence is very low (Analysis 4.2; RR 0.29, 95% CI 0.11 to 0.77). Futhermore, after stratifying by the presence or absence of MMC, the 95% CIs went from being narrow to being wide, and the results changed from possibly different to little or no difference. In the E‐PTFE group with MMC, three of 15 eyes had hypotony, compared to the trabeculectomy‐alone group (seven of 15 eyes), leaving it unclear whether the use of E‐PTFE prevents hypotony, because the quality of the evidence is very low (Analysis 4.2.1; RR 0.43, 95% CI 0.14 to 1.35). In the E‐PTFE group without MMC, one of 15 eyes had hypotony, compared to the trabeculectomy‐alone group (seven of 15 eyes), leaving it unclear whether the use of E‐PTFE prevents hypotony because the quality of the evidence is very low (Analysis 4.2.2; RR 0.14, 95% CI 0.02 to 1.02).
The included study did not report these complications: surgical revision within three months and one year after surgery, endophthalmitis or blebitis, retinal detachment, corneal transplant, cataract extraction (among phakic eyes), and choroidal hemorrhage.
Others as reported from the included studies
Hyphema
There were eight of 30 eyes in the E‐PTFE group with hyphema and 10 of 30 eyes in the trabeculectomy‐alone group, but it was uncertain whether the E‐PTFE group was favored over the trabeculectomy‐alone group (Analysis 4.3; RR 0.80, 95% CI 0.37 to 1.74). There was uncertainty after stratifying by the presence or absence of MMC. In the E‐PTFE group with MMC, four of 15 participants had hyphema compared to the trabeculectomy‐alone group (five of 15 eyes), but there was uncertainty and the result was not statistically significant (Analysis 4.3.1; RR 0.80, 95% CI 0.27 to 2.41). In the E‐PTFE group without MMC, four of 15 eyes had hyphema, compared to the trabeculectomy‐alone group (five of 15 eyes), but there was uncertainty and the result was not statistically significant (Analysis 4.3.2; RR 0.80, 95% CI 0.27 to 2.41).
Inflammation
There were seven of 30 eyes in the E‐PTFE group with inflammation and five of 30 eyes in the trabeculectomy‐alone group, but it was uncertain whether the E‐PTFE group was favored over the trabeculectomy‐alone group (Analysis 4.4; RR 1.40, 95% CI 0.50 to 3.91). There was uncertainty after stratifying by the presence or absence of MMC. In the E‐PTFE group with MMC, three of 15 eyes had inflammation compared to the trabeculectomy‐alone group (three of 15 eyes), but there was uncertainty and the result was not statistically significant (Analysis 4.4.1; RR 1.33, 95% CI 0.36 to 4.97). In the E‐PTFE group without MMC, four of 15 eyes had inflammation compared to the trabeculectomy‐alone group (two of 15 eyes), but there was uncertainty and the result was not statistically significant (Analysis 4.4.2; RR 1.50, 95% CI 0.29 to 7.73).
Shallow anterior chamber
There were four of 30 eyes in the E‐PTFE group with shallow anterior chamber and nine of 30 eyes in the trabeculectomy‐alone group, but there was uncertainty whether the E‐PTFE group was favored over the trabeculectomy‐alone group (Analysis 4.5; RR 0.44, 95% CI 0.15 to 1.29). There was uncertainty after stratifying by the presence or absence of MMC. In the E‐PTFE group with MMC, two of 15 eyes had shallow anterior chamber, compared to the trabeculectomy‐alone group (four of 15 eyes) but there was uncertainty and the result was not statistically significant (Analysis 4.5.1; RR 0.50, 95% CI 0.11 to 2.33). In the E‐PTFE group without MMC, two of 15 eyes had shallow anterior chamber compared to the trabeculectomy‐alone group (five of 15 eyes), but there was uncertainty and the result was not statistically significant (Analysis 4.5.2; RR 0.40, 95% CI 0.09 to 1.75).
Flat anterior chamber
There were one of 30 eyes in the E‐PTFE group with flat anterior chamber and two of 30 eyes in the trabeculectomy‐alone group, but there was uncertainty whether the E‐PTFE group was favored over the trabeculectomy‐alone group (Analysis 4.6; RR 0.60, 95% CI 0.08 to 4.28). There was uncertainty after stratifying by the presence or absence of MMC. In the E‐PTFE group with MMC, one of 15 eyes had flat anterior chamber, compared to the trabeculectomy‐alone group (one of 15 eyes) but there was uncertainty and the result was not statistically significant (RR 1.00, 95% CI 0.07 to 14.55). In the E‐PTFE group without MMC, zero of 15 eyes had flat anterior chamber compared to the trabeculectomy‐alone group (one of 15 eyes), but there was uncertainty and the result was not statistically significant (RR 0.33, 95% CI 0.01 to 7.58).
Choroidal detachment
There were three of 30 eyes in the E‐PTFE group with choroidal detachment and seven of 30 eyes in the trabeculectomy‐alone group, but there was uncertainty whether the E‐PTFE group was favored over the trabeculectomy‐alone group (Analysis 4.7; RR 0.43, 95% CI 0.12 to 1.51). There was uncertainty after stratifying by the presence or absence of MMC. In the E‐PTFE group with MMC, one of 15 eyes had choroidal detachment compared to the trabeculectomy‐alone group (four of 15 eyes), but there was uncertainty and the result was not statistically significant (Analysis 4.7.1; RR 0.25, 95% CI 0.03 to 1.98). In the E‐PTFE group without MMC, two of 15 eyes had choroidal detachment compared to the trabeculectomy‐alone group (three of 15 eyes), but there was uncertainty and the result was not statistically significant (Analysis 4.7.2; RR 0.67, 95% CI 0.13 to 3.44).
Cystic/avascular bleb
We could not compare findings with and without MMC as there were no eyes with cystic/avascular bleb in the without‐MMC group. In the E‐PTFE group with MMC, three of 15 eyes had cystic/avascular bleb compared to the trabeculectomy‐alone group (three of 15 eyes), but there was uncertainty and the result was not statistically significant (RR 1.00, 95% CI 0.24 to 4.18).
Trabeculectomy + Gelfilm versus trabeculectomy
No quantitative data were reported from the only study of Gelfilm (43 eyes) (Birt 1998). The study investigators concluded that at one month, six months, and one year after surgery there was uncertainty about the differences among the four intervention groups for postoperative IOP or complication rates. This study was reported only in a conference abstract and we were unable to find other information.
Discussion
Summary of main results
Ex‐PRESS
Ex‐PRESS may slightly lower IOP based on data from three trials (Dahan 2012; De Jong 2009; Wagschal 2013), which were funded by the device manufacturer and assessed at high risk of detection bias. It is uncertain if Ex‐PRESS prevents loss of visual acuity or if the complication rates are similar between the two groups. For best‐corrected visual acuity (BCVA), all four studies reported wide 95% confidence intervals alluding to uncertainty in the treatment effect difference between the two groups at one year (Dahan 2012; De Jong 2009; Netland 2014; Wagschal 2013). We conducted meta‐analyses for complications for four studies in 294 eyes. They appeared to be similar between the two groups, except that the Ex‐PRESS group may prevent postoperative interventions compared with trabeculectomy alone (for example, needling, cataract surgery, repeat trabeculectomy, etc.).
Ologen
It is uncertain whether the use of Ologen lowers IOP, prevents loss of visual acuity, or prevents complications. Very low‐quality evidence from two studies in 44 eyes contributed to the primary outcome of this review, and showed that it is uncertain whether the use of Ologen decreases the postoperative mean IOP from baseline to one year, at one day, six months, and two years compared with trabeculectomy alone (Analysis 2.1; Analysis 2.2; Analysis 2.3; Analysis 2.4). The evidence was supported by varying number of studies and eyes at each follow‐up time point: five studies in 177 eyes at one year; five studies in 162 eyes at one day; seven studies in 236 eyes at six months; two studies in 55 eyes at two years (Analysis 2.2; Analysis 2.3; Analysis 2.4).
Evidence from two studies in 51 eyes contributed data to show no statistically significant difference in change in BCVA at one year and six weeks of follow‐up, respectively (Rosentreter 2010; Senthil 2013). One study reported on visual field changes, but did not find any changes over time (Rosentreter 2010). We did not find any overall statistical difference between the two treatment groups for any complications, although hypotony appeared to be more frequent in the trabeculectomy‐alone group.
Amniotic membrane
None of the included studies reported the primary outcome of this review of change in IOP from baseline to one year; instead, they all reported postoperative IOP at certain time points. Caution should be used in interpreting the evidence from nine studies in 356 eyes, showing that the use of amniotic membrane may slightly lower the mean IOP at one year follow‐up, as eyes in the amniotic membrane group could have had lower baseline mean IOP than in the trabeculectomy‐alone group (Analysis 3.1). Similar results were shown at one month, three months and six months (Analysis 3.4; Analysis 3.5; Analysis 3.6). Six studies reported BCVA (no meta‐analysis) at one year or six months, but the findings were inconsistent. The amniotic membrane group appeared to have a lower frequency of complications than the trabeculectomy‐alone group, although the time points assessed were inconsistent or unclear across studies.
Expanded polytetrafluoroethylene (E‐PTFE)
One study (Cillino 2008) reported the use of E‐PTFE during trabeculectomy, and found no statistically significant difference between the groups with E‐PTFE with or without MMC and standard trabeculectomy in IOP control at all follow‐up time points up to two years. In the E‐PTFE group, the complication (hypotony) rates were no different in the subgroups with and without MMC at 24 months, although the pooled result favored the E‐PTFE group (Analysis 4.2).
Overall completeness and applicability of evidence
Of the 33 included studies, 16 reported numbers of antiglaucoma medications used during the postoperative follow‐up periods; within these, 11 reported IOP by 'complete success' (defined as IOP reached < 21 mm Hg without use of medication), 'qualified success' (defined as IOP reached < 21 mm Hg with use of medication), or 'failure' (defined at IOP > 22 mm Hg at follow‐up).
Ex‐PRESS
Four studies were powered to detect a between‐group difference between Ex‐PRESS and controls (Dahan 2012; De Jong 2009; Netland 2014; Wagschal 2013). The studies were conducted in South Africa, the Netherlands, USA, and Canada respectively. They included a mix of white, African‐American, Asian, and Indian participants, and all with a mean age of around 65 years. Three studies could be meta‐analyzed for efficacy of Ex‐PRESS. One study reported that the Ex‐PRESS device was associated with a one‐year overall cost of USD 956 greater than trabeculectomy (Wagschal 2013). Patients' choices could be affected by the effectiveness, safety, and cost of the intervention.
Since all five studies included participants with open‐angle glaucoma, the Ex‐PRESS results are most applicable to people with open‐angle glaucoma. The effectiveness and safety in people with other types of glaucoma remain uncertain.
Ologen
Only one study was adequately powered to detect a between‐group difference (Cillino 2011). The other seven studies were either inconclusive or did not find any statistically significant difference for postoperative IOP reduction. The findings from the meta‐analysis remain inconclusive and should be interpreted with caution.
Ologen implant is an alternative method for controlling the wound‐healing process similar to antifibrotic agents. Among the eight Ologen trials, only one (Papaconstantinou 2010) did not use MMC in the standard trabeculectomy group.
All or some of the participants in all eight studies had open‐angle glaucoma; two studies included some participants with angle‐closure glaucoma (Marey 2013; Senthil 2013), and one study did not specify the glaucoma type (Papaconstantinou 2010). None of the studies stratified participants by type of glaucoma.
Amniotic membrane
Only one study reported power and sample size calculations (Sheha 2008). In addition, a majority of the studies did not report losses to follow‐up and did not report details of study design (i.e. randomization, allocation concealment, and masking). Due to the poor quality of most of the studies, concerns still remain as to whether IOP is reduced when amniotic membrane is used compared with standard trabeculectomy, and how safe it is.
Three studies used MMC in the trabeculectomy group only and not in the amniotic membrane group (Cho 2013; Khairy 2015; Zheng 2005).
Of the 18 studies, three included only participants with open‐angle glaucoma (Eliezer 2006; Khairy 2015; Stavrakas 2012), four studies included only participants with angle‐closure glaucoma (Huang 2007; Ren 2009; Yan 2004; Zhang 2009), two studies included open‐angle and angle‐closure glaucoma (Cho 2013; Zheng 2005), seven studies included participants with refractory glaucoma (Cai 2012; Ji 2013; Li 2010; Liu 2009; Sheha 2008; Wang 2009; Yang 2004), and two studies did not specify the glaucoma type (Birt 1998; Wang 2008).
Expanded polytetrafluoroethylene (E‐PTFE)
Cillino 2008 enrolled the number of participants needed to be adequately powered to detect a between‐group difference. The study reported the number of antiglaucoma medications as an outcome, so the efficacy of E‐PTFE to control IOP might be partially attributed to antiglaucoma medication and not to E‐PTFE alone.
Quality of the evidence
Overall, the agreement in IOP measurement across the included studies was high, as the width of the 95% CI for postoperative IOP at one year ranged from 2 to 7 mm Hg for each device. Similarly, the evidence showed a small and consistent effect size, with mean differences ranging from ‐4 to 2 mm Hg.
Most of the trials were at high risk of detection bias for lack of masking outcome assessors. Further, the Ex‐PRESS studies had potential conflicts of interest for receiving funding support from the device manufacturer. Overall, we graded the quality of the evidence as low or very low for most outcomes due to potential risks of bias and imprecision for many adverse events.
Potential biases in the review process
We conducted comprehensive electronic searches for studies with no imposed date or language restrictions to minimize potential biases in the study selection process. We followed standard Cochrane review methodology.
Agreements and disagreements with other studies or reviews
Trabeculectomy + Ex‐PRESS versus trabeculectomy
Our meta‐analyses of three trials found that the use of Ex‐PRESS may lead to IOP reduction compared with trabeculectomy alone at one year and two years. Our review also showed there is uncertainty whether the risk of complications differs between the Ex‐PRESS and trabeculectomy‐alone group.
A retrospective comparative series by Maris 2007 of 100 eyes, Good 2011 of 70 eyes, and Moisseiev 2015 of 200 eyes did not find a significant difference between Ex‐PRESS and trabeculectomy in lowering IOP. A retrospective review by Marzette 2011 of 153 eyes showed a lower risk of postoperative hypotony and a greater but statistically nonsignificant decrease in IOP with Ex‐PRESS.
A systematic review by Wang 2013a concluded that Ex‐PRESS has the same effectiveness in IOP reduction compared to trabeculectomy alone, with significantly fewer events of hypotony and hyphema compared to trabeculectomy alone. However, these pooled results were from a mix of RCTs, prospective non‐RCTs, and retrospective studies, which limits the reliability of their inference.
A recent meta‐analysis by Chen 2014 found no statistically significant reduction in IOP between Ex‐PRESS and trabeculectomy alone, and a significantly lower frequency of hyphema with Ex‐PRESS. The other complications were not statistically significantly different between the two groups. However, this review was flawed in that it mixed the different follow‐up periods from different studies for IOP control (e.g. six months and one year) in one meta‐analysis. Also, one included study was a subset of another (both were references from Wagschal 2013), and its meta‐analyses of complications included both studies, thereby double‐counting the data.
Trabeculectomy + Ologen versus trabeculectomy
Our meta‐analyses of five trials showed that there is uncertainty if there is a difference in IOP postoperatively and at one year. This is contrary to Narayanaswamy 2012, which conducted a non‐randomized prospective comparative study of 33 participants and found a greater decrease in IOP and a lower incidence of bleb needling procedures in the trabeculectomy and MMC group than in the trabeculectomy and Ologen group. However, our results are in agreement with a systematic review by He 2014 of seven RCTs (227 eyes), which found no statistically significant difference between the two groups except at one and 12 months, in which the amount of IOP reduction was less in the Ologen group. However, the review is limited because it included a non‐randomized trial (Nilforushan 2010), despite being restricted to RCTs only.
Our meta‐analysis of complications in all studies showed that there is uncertainty whether there is a difference between the two groups. Similarly, the authors of He 2014 reported comparable rates of adverse events in the Ologen and trabeculectomy‐alone groups.
Trabeculectomy + amniotic membrane versus trabeculectomy
Our meta‐analysis of nine trials found a slight decrease in IOP in the amniotic membrane group compared to the trabeculectomy‐alone group. This is similar to an animal model study, that also showed a greater decrease in IOP (Barton 2001).
Expanded polytetrafluoroethylene (E‐PTFE)
A retrospective study enrolling 43 eyes with refractory glaucoma found that an E‐PTFE membrane safely reduced IOP in 65% of the eyes (Kim 2003). The mean follow‐up period was 32.9 months. However, in the remaining 35% of the eyes, surgical revisions were needed to control IOP or treat complications.
Other devices
We did not find any randomized controlled trials (RCTs) for other devices used in a standard trabeculectomy procedure, but a few case series without comparators have shown some benefit of using them. Dahan 2011 conducted a trial on the use of T‐flux in trabeculectomy for neovascular glaucoma. The trial showed that modified trabeculectomy augmented by MMC and T‐flux adequately controlled IOP in neovascular participants after a mean follow‐up of 32 ± 12 months. However, surgical revisions may be required to maintain an IOP ≤ 21 mm Hg. Two trials reported the use of gold micro shunt (GMS). One study with 38 participants found that GMS can significantly decrease IOP, but two‐thirds of participants required medications to achieve adequate IOP control (Melamed 2009). Another study with 55 participants with uncontrolled refractory glaucoma reported that GMS can achieve adequate IOP control in about 67.3% of eyes with relatively few complications (Figus 2011). The follow‐up was two years in this study. Devices inserted into the suprachoroidal space are at high risk for fibrosis and failure of the procedure (Agnifili 2012).
Comparison between different devices
There was no RCT directly comparing the use of any two devices. However, we found one retrospective review that compared Ologen versus MMC in participants implanted with Ex‐PRESS (Johnson 2014). The study included 99 eyes of 85 participants who had undergone trabeculectomy with implantation of an Ex‐PRESS shunt, and had applied MMC in 50 eyes of 48 participants and used Ologen in 49 eyes of 37 participants. The investigators found no significant difference between the two groups in IOP reduction or rates of complications.
Risk of bias summary: review authors' judgements about each risk of bias item for each included study.
Forest plot of comparison: 2 Trabeculectomy + Ex‐PRESS versus Trabeculectomy, outcome: Postoperative IOP at one year.
Forest plot of comparison: 2 Trabeculectomy (Trab) + Ologen versus Trabeculectomy (Trab), outcome: 2.1 IOP at one year.
Forest plot of comparison: 4 Trabeculectomy + AMT (amniotic membrane) versus Trabeculectomy, outcome: 4.1 Postoperative IOP at one year.
Forest plot of comparison: 1 Trabeculectomy + E‐PTFE versus Trabeculectomy, outcome: 1.1 Postoperative IOP at one year.
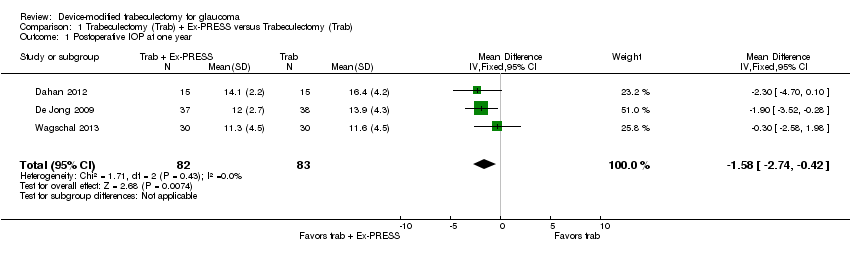
Comparison 1 Trabeculectomy (Trab) + Ex‐PRESS versus Trabeculectomy (Trab), Outcome 1 Postoperative IOP at one year.
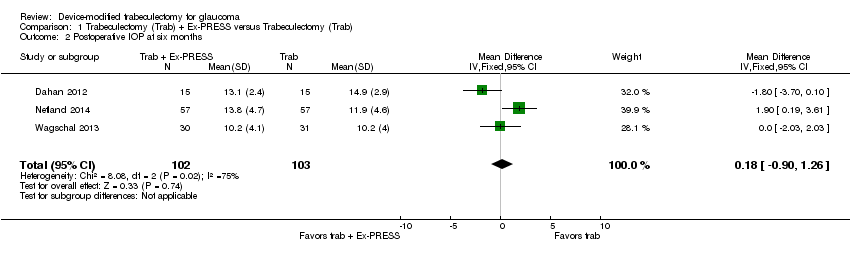
Comparison 1 Trabeculectomy (Trab) + Ex‐PRESS versus Trabeculectomy (Trab), Outcome 2 Postoperative IOP at six months.
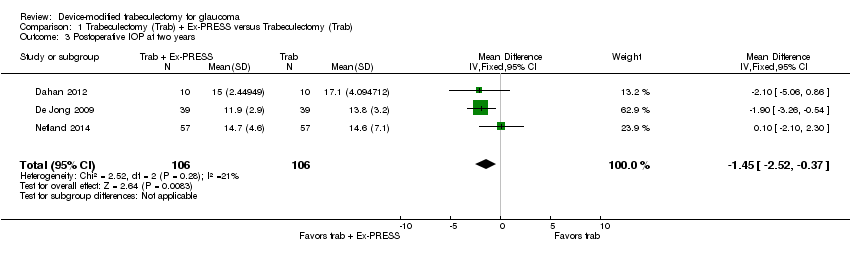
Comparison 1 Trabeculectomy (Trab) + Ex‐PRESS versus Trabeculectomy (Trab), Outcome 3 Postoperative IOP at two years.

Comparison 1 Trabeculectomy (Trab) + Ex‐PRESS versus Trabeculectomy (Trab), Outcome 4 Postoperative logMAR BCVA at one year.
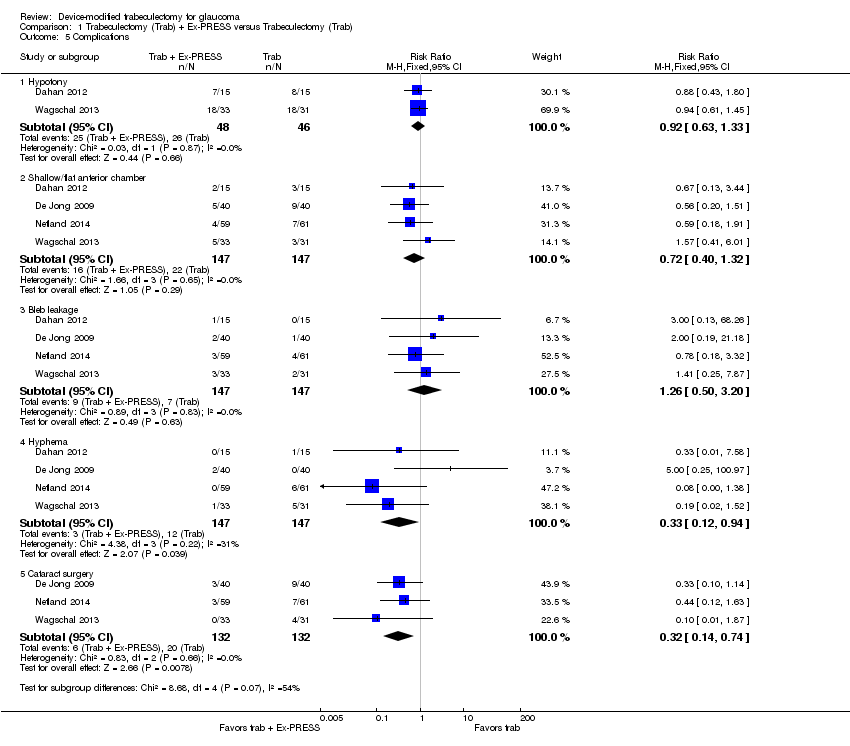
Comparison 1 Trabeculectomy (Trab) + Ex‐PRESS versus Trabeculectomy (Trab), Outcome 5 Complications.

Comparison 2 Trabeculectomy (Trab) + Ologen versus Trabeculectomy (Trab), Outcome 1 IOP at one year.
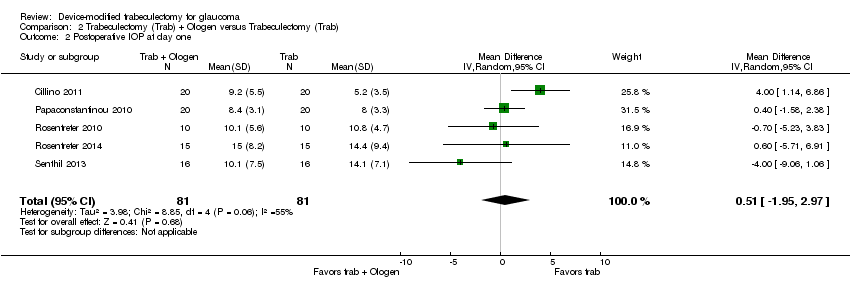
Comparison 2 Trabeculectomy (Trab) + Ologen versus Trabeculectomy (Trab), Outcome 2 Postoperative IOP at day one.

Comparison 2 Trabeculectomy (Trab) + Ologen versus Trabeculectomy (Trab), Outcome 3 Postoperative IOP at six months.
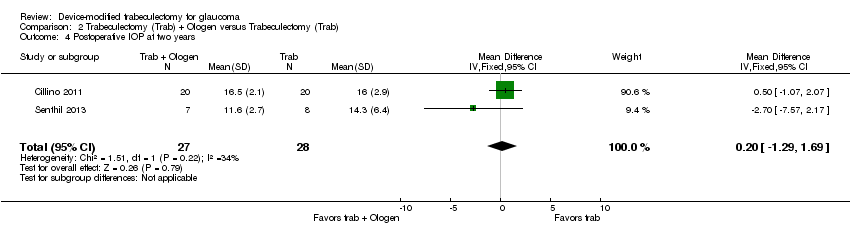
Comparison 2 Trabeculectomy (Trab) + Ologen versus Trabeculectomy (Trab), Outcome 4 Postoperative IOP at two years.

Comparison 2 Trabeculectomy (Trab) + Ologen versus Trabeculectomy (Trab), Outcome 5 Complications.

Comparison 3 Trabeculectomy (Trab) + AMT (amniotic membrane) versus Trabeculectomy (Trab), Outcome 1 Postoperative IOP at one year.
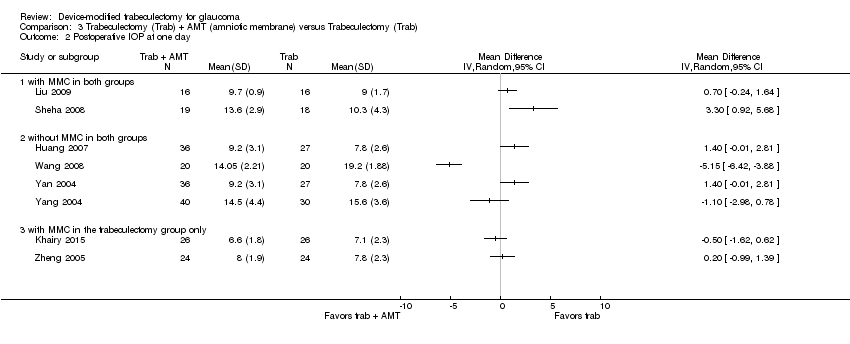
Comparison 3 Trabeculectomy (Trab) + AMT (amniotic membrane) versus Trabeculectomy (Trab), Outcome 2 Postoperative IOP at one day.

Comparison 3 Trabeculectomy (Trab) + AMT (amniotic membrane) versus Trabeculectomy (Trab), Outcome 3 Postoperative IOP at one week.

Comparison 3 Trabeculectomy (Trab) + AMT (amniotic membrane) versus Trabeculectomy (Trab), Outcome 4 Postoperative IOP at one month.

Comparison 3 Trabeculectomy (Trab) + AMT (amniotic membrane) versus Trabeculectomy (Trab), Outcome 5 Postoperative IOP at three months.

Comparison 3 Trabeculectomy (Trab) + AMT (amniotic membrane) versus Trabeculectomy (Trab), Outcome 6 Postoperative IOP at six months.
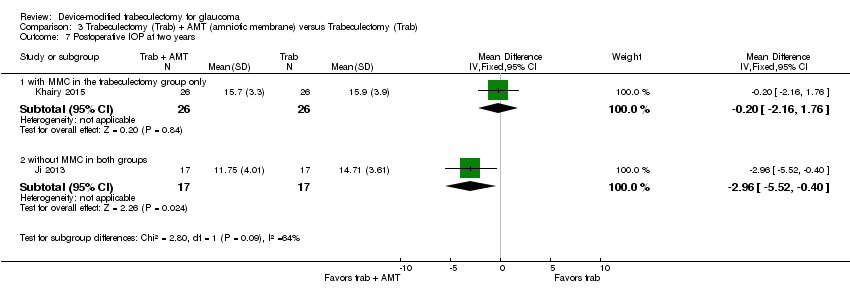
Comparison 3 Trabeculectomy (Trab) + AMT (amniotic membrane) versus Trabeculectomy (Trab), Outcome 7 Postoperative IOP at two years.
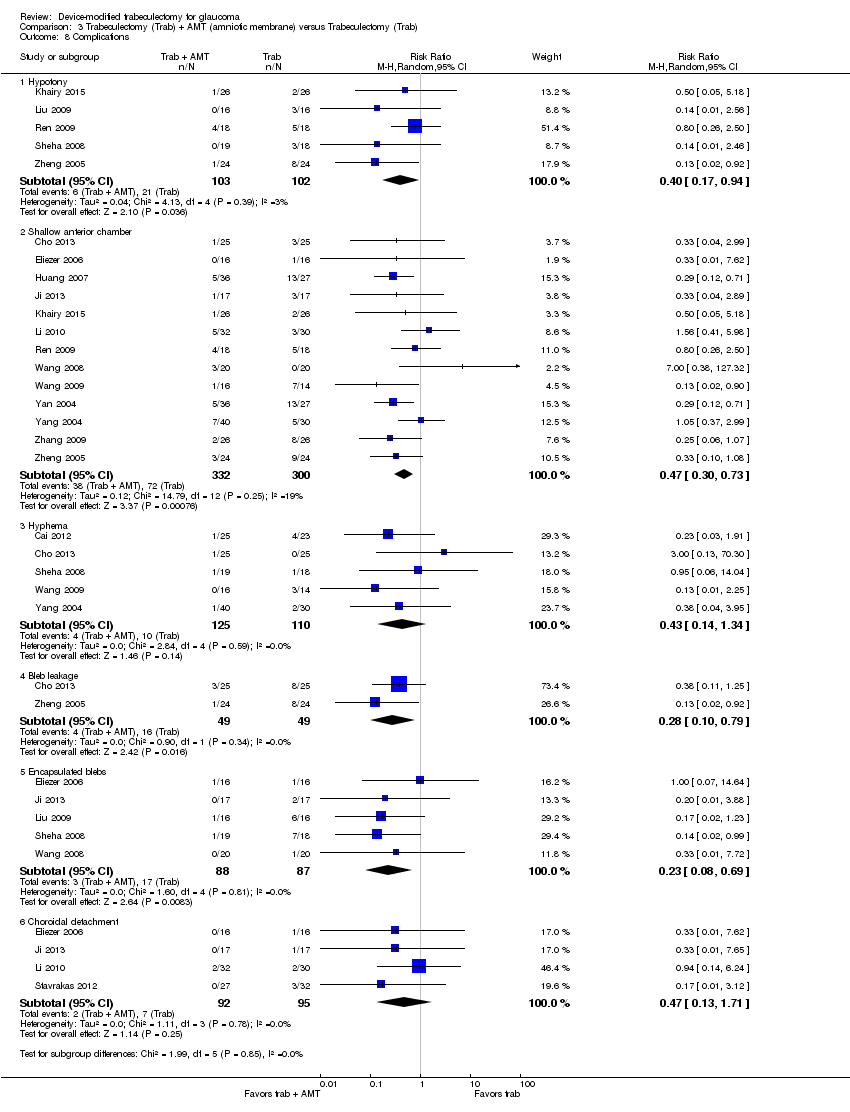
Comparison 3 Trabeculectomy (Trab) + AMT (amniotic membrane) versus Trabeculectomy (Trab), Outcome 8 Complications.
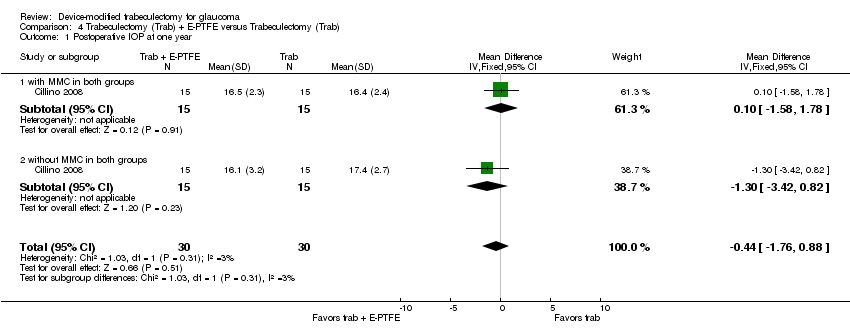
Comparison 4 Trabeculectomy (Trab) + E‐PTFE versus Trabeculectomy (Trab), Outcome 1 Postoperative IOP at one year.

Comparison 4 Trabeculectomy (Trab) + E‐PTFE versus Trabeculectomy (Trab), Outcome 2 Hypotony at 24 months.

Comparison 4 Trabeculectomy (Trab) + E‐PTFE versus Trabeculectomy (Trab), Outcome 3 Hyphaema at 24 months.
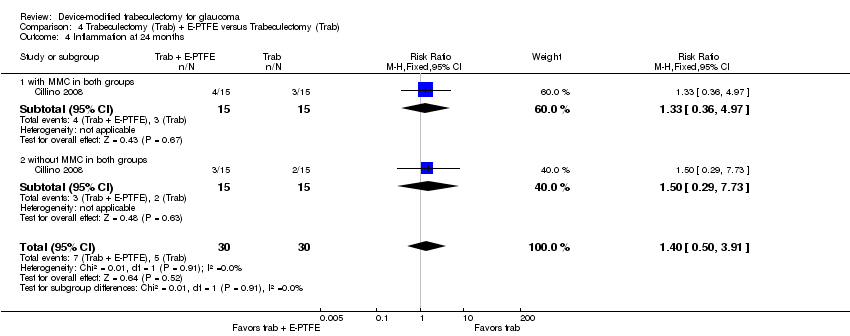
Comparison 4 Trabeculectomy (Trab) + E‐PTFE versus Trabeculectomy (Trab), Outcome 4 Inflammation at 24 months.

Comparison 4 Trabeculectomy (Trab) + E‐PTFE versus Trabeculectomy (Trab), Outcome 5 Shallow anterior chamber at 24 months.

Comparison 4 Trabeculectomy (Trab) + E‐PTFE versus Trabeculectomy (Trab), Outcome 6 Flat anterior chamber at 24 months.
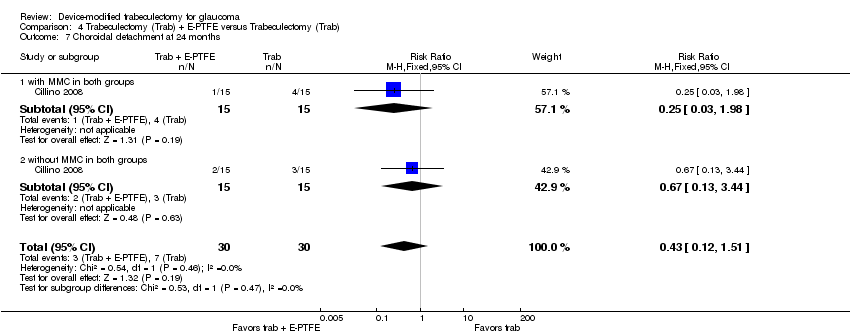
Comparison 4 Trabeculectomy (Trab) + E‐PTFE versus Trabeculectomy (Trab), Outcome 7 Choroidal detachment at 24 months.
| Ex‐PRESS implanted during trabeculectomy compared with trabeculectomy alone for people with open‐angle glaucoma | ||||||
| Patient or population: people with open‐angle glaucoma Settings: ophthalmic surgery Intervention: Ex‐PRESS implanted during trabeculectomy Comparison: trabeculectomy alone | ||||||
| Outcomes | Illustrative comparative risks* (95% CI) | Relative effect | No of Eyes | Quality of the evidence | Comments | |
| Assumed risk | Corresponding risk | |||||
| trabeculectomy alone | Ex‐PRESS | |||||
| Postoperative mean IOP at 1 year | The mean IOP in the trabeculectomy‐alone groups was 13.9 mm Hg, ranged from 11.6 to 16.4 mm Hg | The mean IOP in the Ex‐PRESS groups was | ‐ | 165 | ⊕⊕⊝⊝ | ‐ |
| Postoperative mean logMAR BCVA at 1 year | The mean logMAR BCVA in the trabeculectomy‐alone groups was 0.59, ranged from 0.43 to 0.80 | The mean logMAR BCVA in the Ex‐PRESS groups was | ‐ | 90 | ⊕⊝⊝⊝ | ‐ |
| Complication as defined in protocol‐ Hypotony Follow‐up: ranged from 1 to 5 years | 565 per 1000 | 520 per 1000 (356 to 751) | RR 0.92 (0.63 to 1.33) | 94 (2 studies) | ⊕⊝⊝⊝ | ‐ |
| Other complications reported by included studies | ||||||
| Shallow/flat anterior chamber Follow‐up: ranged from 1 to 5 years | 150 per 1000 | 108 per 1000 | RR 0.72 (0.40 to 1.32) | 294 | ⊕⊝⊝⊝ | ‐ |
| Bleb leakage Follow‐up: ranged from 1 to 5 years | 48 per 1000 | 60 per 1000 | RR 1.26 (0.50 to 3.20) | 294 | ⊕⊝⊝⊝ | ‐ |
| Hyphema Follow‐up: ranged from 1 to 5 years | 82 per 1000 | 27 per 1000 | RR 0.33 (0.12 to 0.94) | 294 | ⊕⊕⊝⊝ | ‐ |
| Cataract surgery Follow‐up: ranged from 1 to 5 years | 152 per 1000 | 49 per 1000 | RR 0.32 (0.14 to 0.74) | 264 | ⊕⊕⊝⊝ | ‐ |
| *The basis for the assumed risk (e.g. the median control group risk across studies) is provided in footnotes. The corresponding risk (and its 95% confidence interval) is based on the assumed risk in the comparison group and the relative effect of the intervention (and its 95% CI). | ||||||
| GRADE Working Group grades of evidence | ||||||
| 1Downgraded for limitations in the design and implementation of available studies suggesting high likelihood of bias (‐1); high likelihood that studies did not mask outcome assessors. | ||||||
| Ologen implanted during trabeculectomy compared with trabeculectomy alone for people with glaucoma | ||||||
| Patient or population: people with glaucoma, including open‐angle, angle‐closure, and uncontrolled IOP Settings: ophthalmic surgery Intervention: Ologen implanted during trabeculectomy Comparison: trabeculectomy alone | ||||||
| Outcomes | Illustrative comparative risks* (95% CI) | Relative effect | No of Eyes | Quality of the evidence | Comments | |
| Assumed risk | Corresponding risk | |||||
| trabeculectomy alone | Ologen | |||||
| Postoperative mean IOP at 1 year | The mean IOP in the trabeculectomy‐alone groups was 15.2 mm Hg, ranged from 11 to 19.3 mm Hg. | The mean IOP in the Ologen groups was | ‐ | 177 | ⊕⊝⊝⊝ | Analyzed using the generic inverse method |
| Postoperative mean logMAR BCVA at 1 year | See comment. | See comment. | ‐ | ‐ | ‐ | Senthil 2013 reported BCVA for 32 eyes at 6 weeks post‐surgery: MD ‐0.24 logMAR, 95% CI ‐0.58 to 0.10 |
| Complication as defined in protocol‐ Hypotony Follow‐up: ranged from 6 to 24 months | 223 per 1000 | 167 per 1000 | RR 0.75 (0.47 to 1.19) | 233 | ⊕⊝⊝⊝ | ‐ |
| Other complications reported by included studies | ||||||
| Shallow anterior chamber Follow‐up: ranged from 6 to 24 months | 90 per 1000 | 71 per 1000 | RR 0.79 (0.32 to 1.93) | 213 | ⊕⊝⊝⊝ | ‐ |
| Bleb leakage Follow‐up: ranged from 6 to 24 months | 138 per 1000 | 117 per 1000 | RR 0.85 (0.33 to 2.20) | 129 | ⊕⊝⊝⊝ | ‐ |
| Hyphema Follow‐up: ranged from 6 to 24 months | 78 per 1000 | 114 per 1000 | RR 1.46 (0.51 to 4.19) | 229 | ⊕⊝⊝⊝ | ‐ |
| Surgical revision Follow‐up: ranged from 6 to 24 months | 40 per 1000 | 68 per 1000 (15 to 305) | RR 1.70 (0.38 to 7.63) | 150 (4 studies) | ⊕⊝⊝⊝ | ‐ |
| *The basis for the assumed risk (e.g. the median control group risk across studies) is provided in footnotes. The corresponding risk (and its 95% confidence interval) is based on the assumed risk in the comparison group and the relative effect of the intervention (and its 95% CI). | ||||||
| GRADE Working Group grades of evidence | ||||||
| 1Downgraded for limitations in the design and implementation of available studies suggesting high likelihood of bias (‐1); high likelihood that studies did not mask outcome assessors. | ||||||
| Amniotic membrane implanted during trabeculectomy compared with trabeculectomy alone for people with glaucoma | ||||||
| Patient or population: people with glaucoma, including open‐angle, angle‐closure, uncontrolled IOP, and refractive glaucoma Settings: ophthalmic surgery Intervention: Amniotic membrane implanted during trabeculectomy Comparison: trabeculectomy alone | ||||||
| Outcomes | Illustrative comparative risks* (95% CI) | Relative effect | No of Eyes | Quality of the evidence | Comments | |
| Assumed risk | Corresponding risk | |||||
| trabeculectomy alone | amniotic membrane | |||||
| Postoperative mean IOP at 1 year | The mean IOP in the trabeculectomy alone groups was 17.6 mm Hg, ranged from 15.1 to 19.8 mm Hg. | The mean IOP in the Ologen groups was | ‐ | 356 | ⊕⊕⊝⊝ | |
| Postoperative mean logMAR BCVA at 1 year | See comment. | See comment. | Only 1 study reported this outcome; the amniotic membrane group had statistically significantly better BCVA than the trabeculectomy group, but no data for between‐group difference were provided | |||
| Complications ‐ Hypotony Follow‐up: ranged from 3 to 24 months | 206 per 1000 | 82 per 1000 | RR 0.40 (0.17 to 0.94) | 205 | ⊕⊕⊝⊝ | ‐ |
| Other complications reported by included studies | ||||||
| Complications ‐ Shallow anterior chamber Follow‐up: ranged from 3 to 24 months | 240 per 1000 | 113 per 1000 | RR 0.47 (0.30 to 0.73) | 632 | ⊕⊕⊝⊝ | ‐ |
| Complications ‐ Bleb leakage Follow‐up: ranged from 3 to 24 months | 327 per 1000 | 91 per 1000 | RR 0.28 (0.10 to 0.79) | 98 | ⊕⊕⊝⊝ | ‐ |
| Complications ‐ Hyphema Follow‐up: ranged from 3 to 24 months | 91 per 1000 | 39 per 1000 | RR 0.43 (0.14 to 1.34) | 235 | ⊕⊝⊝⊝ | ‐ |
| Complications ‐ Surgical revision Follow‐up: ranged from 3 to 24 months | See comment. | See comment. | ‐ | ‐ | None of the studies reported this outcome. | |
| *The basis for the assumed risk (e.g. the median control group risk across studies) is provided in footnotes. The corresponding risk (and its 95% confidence interval) is based on the assumed risk in the comparison group and the relative effect of the intervention (and its 95% CI). | ||||||
| GRADE Working Group grades of evidence | ||||||
| 1Downgraded for limitations in the design and implementation of available studies suggesting high likelihood of bias (‐1); high likelihood that studies did not mask outcome assessors. | ||||||
| Device | Study ID | Study design | Country | Participant diagnosis | Interventions | Total number of participants randomized | Total number of eyes randomized | Total number of eyes analyzed | Longest follow‐up period (months) |
| Ex‐PRESS | RCT, paired‐eye design | South Africa | POAG | Trab + MMC Trab + MMC + Ex‐PRESS | 15 | 30 | 30 | 12 | |
| De Jong 2005 (abstract) | RCT, parallel‐group design | The Netherlands | OAG | Trab + Ex‐PRESS under a scleral flap Trab Trab + Ex‐PRESS under conjunctiva | 109 | 120 | N/A | 6 | |
| RCT, parallel‐group design | The Netherlands | OAG | Trab Trab + Ex‐PRESS | 78 | 78 | 78 | 60 | ||
| RCT, parallel‐group design | USA | OAG | Trab + MMC Trab + MMC + Ex‐PRESS | 120 | 120 | 114 | 24 | ||
| RCT, parallel‐group design | Canada | OAG, uncontrolled IOP | Trab + MMC Trab + MMC + Ex‐PRESS | 64 | 64 | 60 | 12 | ||
| Subtotal for Ex‐PRESS | 386 | 412 | N/A | Range 6 to 60 months | |||||
| Ologen | RCT, parallel‐group design | Italy | POAG, PEXG, uncontrolled IOP | Trab + MMC Trab + Ologen | 40 | 40 | 40 | 24 | |
| RCT, parallel‐group design | India | OAG | Trab + MMC Trab + Ologen | 40 | 40 | 40 | 12 | ||
| RCT, parallel‐group design | Egypt | POAG, ACG, PEXG, uveitic glaucoma, uncontrolled pseudophakic glaucoma | Trab + MMC Trab + Ologen | 60 | 60 | 60 | 12 | ||
| RCT, parallel‐group design | India | Uncontrolled OAG | Trab + MMC Trab + Ologen | 64 | 64 | N/A | 6 | ||
| RCT, parallel‐group design | Greece | glaucoma | Trab Trab + Ologen | 40 | 40 | 40 | 6 | ||
| RCT, parallel‐group design | Germany | OAG, uncontrolled IOP | Trab + MMC Trab + Ologen | 20 | 20 | 20 | 12 | ||
| RCT, parallel‐group design | Germany | OAG, uncontrolled IOP | Trab + MMC Trab + Ologen | 30 | 30 | 30 | 12 | ||
| RCT, parallel‐group design | India | Uncontrolled POAG or PACG | Trab + MMC Trab + Ologen | 33 | 39 | 32 | 24 | ||
| Subtotal for Ologen | 327 | 333 | N/A | Range 6 to 24 month | |||||
| Amniotic membrane | Bruno 2008 (abstract) | RCT, parallel‐group design | N/A | OAG and failed surgery | Trab + MMC Trab + MMC + AMT | 19 | N/A | N/A | 6 |
| RCT, parallel‐group design | China | Refractory glaucoma | Trab Trab + AMT | 40 | 48 | 48 | 12 | ||
| RCT, parallel‐group design | China | POAG, ACG, uncontrolled IOP | Trab + MMC Trab + AMT | 47 | 52 | 39 | 3 | ||
| RCT, parallel‐group design | Brazil | POAG | Trab Trab + AMT | 32 | 32 | N/A | 12 | ||
| RCT, parallel‐group design | China | PACG | Trab Trab + AMT | 50 | 63 | N/A | 6 | ||
| RCT, paired‐eye design | China | Uncontrolled glaucoma | Trab Trab + AMT | 17 | 34 | N/A | 24 | ||
| RCT, parallel‐group design | Egypt | OAG | Trab + MMC Trab + AMT | 52 | 52 | 52 | 24 | ||
| RCT, parallel‐group design | China | Refractory glaucoma | Trab + MMC Trab + MMC + AMT | 50 | 62 | N/A | 12 | ||
| RCT, parallel‐group design | China | Refractory glaucoma | Trab + MMC Trab + MMC + AMT | 35 | 35 | 32 | 12 | ||
| RCT | China | ACG | Trab Trab + AMT | 30 | 36 | N/A | 12 | ||
| RCT, parallel‐group design | Saudi Arabia | Refractory glaucoma | Trab + MMC Trab + MMC + AMT | 37 | 37 | 30 | 12 | ||
| RCT | Greece | POAG, uncontrolled IOP | Trab Trab + AMT | 50 | 59 | 52 | 24 | ||
| RCT, parallel‐group design | China | glaucoma | Trab Trab + AMT | 40 | 40 | N/A | 12 | ||
| RCT | China | Refractory glaucoma | Trab Trab + MMC Trab + MMC + AMT | 38 | 44 | N/A | 12 | ||
| RCT | China | PACG | Trab Trab + AMT | 52 | 63 | 63 | 6 | ||
| RCT, parallel‐group design | China | glaucoma | Trab Trab + AMT | 70 | 70 | N/A | 6 | ||
| RCT | China | ACG | Trab Trab + AMT | 39 | 52 | N/A | 6 | ||
| RCT | China | POAG, PACG | Trab + MMC Trab + AMT | 28 | 48 | N/A | 12 | ||
| Subtotal for amniotic membrane | 726 | N/A | N/A | Range 3 to 24 months | |||||
| E‐PTFE | RCT, parallel‐group design | Italy | POAG, PEXG, uncontrolled IOP | Trab Trab + MMC Trab + E‐PTFE Trab + MMC + E‐PTFE | 60 | 60 | 60 | 24 | |
| Subtotal for E‐PTFE | 60 | 60 | 60 | 24 | |||||
| Gelfilm | Birt 1998 (abstract) | RCT, parallel‐group design | Not reported | Not reported | Trab Trab + Gelfilm Trab + MMC Trab + MMC + Gelfilm | 43 | N/A | N/A | 12 |
| Subtotal for Gelfilm | 43 | N/A | N/A | 12 | |||||
| Total for all included studies | 1542 | N/A | N/A | Range 3 months to 5 years | |||||
| ACG: angle‐closure glaucoma | |||||||||
| Outcome or subgroup title | No. of studies | No. of participants | Statistical method | Effect size |
| 1 Postoperative IOP at one year Show forest plot | 3 | 165 | Mean Difference (IV, Fixed, 95% CI) | ‐1.58 [‐2.74, ‐0.42] |
| 2 Postoperative IOP at six months Show forest plot | 3 | 205 | Mean Difference (IV, Fixed, 95% CI) | 0.18 [‐0.90, 1.26] |
| 3 Postoperative IOP at two years Show forest plot | 3 | 212 | Mean Difference (IV, Fixed, 95% CI) | ‐1.45 [‐2.52, ‐0.37] |
| 4 Postoperative logMAR BCVA at one year Show forest plot | 2 | 90 | Mean Difference (IV, Fixed, 95% CI) | ‐0.15 [‐0.40, 0.10] |
| 5 Complications Show forest plot | 4 | Risk Ratio (M‐H, Fixed, 95% CI) | Subtotals only | |
| 5.1 Hypotony | 2 | 94 | Risk Ratio (M‐H, Fixed, 95% CI) | 0.92 [0.63, 1.33] |
| 5.2 Shallow/flat anterior chamber | 4 | 294 | Risk Ratio (M‐H, Fixed, 95% CI) | 0.72 [0.40, 1.32] |
| 5.3 Bleb leakage | 4 | 294 | Risk Ratio (M‐H, Fixed, 95% CI) | 1.26 [0.50, 3.20] |
| 5.4 Hyphema | 4 | 294 | Risk Ratio (M‐H, Fixed, 95% CI) | 0.33 [0.12, 0.94] |
| 5.5 Cataract surgery | 3 | 264 | Risk Ratio (M‐H, Fixed, 95% CI) | 0.32 [0.14, 0.74] |
| Outcome or subgroup title | No. of studies | No. of participants | Statistical method | Effect size |
| 1 IOP at one year Show forest plot | 5 | Mean Difference (Random, 95% CI) | Subtotals only | |
| 1.1 Mean change of IOP from baseline to one year | 2 | 44 | Mean Difference (Random, 95% CI) | ‐0.32 [‐5.88, 5.24] |
| 1.2 Postoperative IOP at one year | 5 | 177 | Mean Difference (Random, 95% CI) | 1.40 [‐0.57, 3.38] |
| 2 Postoperative IOP at day one Show forest plot | 5 | 162 | Mean Difference (IV, Random, 95% CI) | 0.51 [‐1.95, 2.97] |
| 3 Postoperative IOP at six months Show forest plot | 7 | Mean Difference (IV, Random, 95% CI) | Subtotals only | |
| 3.1 Change of IOP from baseline to six months | 2 | 46 | Mean Difference (IV, Random, 95% CI) | ‐1.24 [‐6.23, 3.76] |
| 3.2 Postoperative IOP at six months | 5 | 236 | Mean Difference (IV, Random, 95% CI) | 0.43 [‐0.97, 1.84] |
| 4 Postoperative IOP at two years Show forest plot | 2 | 55 | Mean Difference (IV, Fixed, 95% CI) | 0.20 [‐1.29, 1.69] |
| 5 Complications Show forest plot | 7 | Risk Ratio (M‐H, Random, 95% CI) | Subtotals only | |
| 5.1 Hypotony | 6 | 233 | Risk Ratio (M‐H, Random, 95% CI) | 0.75 [0.47, 1.19] |
| 5.2 Surgical revision within 3 months | 4 | 150 | Risk Ratio (M‐H, Random, 95% CI) | 1.70 [0.38, 7.63] |
| 5.3 Blebitis or endophthalmitis | 3 | 164 | Risk Ratio (M‐H, Random, 95% CI) | 1.57 [0.25, 9.70] |
| 5.4 Bleb leakage | 4 | 129 | Risk Ratio (M‐H, Random, 95% CI) | 0.85 [0.33, 2.20] |
| 5.5 Hyphema | 6 | 229 | Risk Ratio (M‐H, Random, 95% CI) | 1.46 [0.51, 4.19] |
| 5.6 Choroidal detachment | 4 | 129 | Risk Ratio (M‐H, Random, 95% CI) | 0.83 [0.33, 2.09] |
| 5.7 Shallow anterior chamber | 5 | 213 | Risk Ratio (M‐H, Random, 95% CI) | 0.79 [0.32, 1.93] |
| 5.8 Anterior chamber reaction | 2 | 99 | Risk Ratio (M‐H, Random, 95% CI) | 1.21 [0.56, 2.60] |
| 5.9 Positive Seidel test | 3 | 164 | Risk Ratio (M‐H, Random, 95% CI) | 1.93 [0.32, 11.54] |
| 5.10 Tenon's cysts | 3 | 124 | Risk Ratio (M‐H, Random, 95% CI) | 0.88 [0.21, 3.66] |
| Outcome or subgroup title | No. of studies | No. of participants | Statistical method | Effect size |
| 1 Postoperative IOP at one year Show forest plot | 9 | 356 | Mean Difference (IV, Random, 95% CI) | ‐3.92 [‐5.41, ‐2.42] |
| 1.1 with MMC in both groups | 4 | 154 | Mean Difference (IV, Random, 95% CI) | ‐3.93 [‐4.91, ‐2.95] |
| 1.2 without MMC in both groups | 4 | 150 | Mean Difference (IV, Random, 95% CI) | ‐4.65 [‐7.79, ‐1.51] |
| 1.3 with MMC in the trabeculectomy group only | 1 | 52 | Mean Difference (IV, Random, 95% CI) | ‐0.30 [‐2.21, 1.61] |
| 2 Postoperative IOP at one day Show forest plot | 8 | Mean Difference (IV, Random, 95% CI) | Totals not selected | |
| 2.1 with MMC in both groups | 2 | Mean Difference (IV, Random, 95% CI) | 0.0 [0.0, 0.0] | |
| 2.2 without MMC in both groups | 4 | Mean Difference (IV, Random, 95% CI) | 0.0 [0.0, 0.0] | |
| 2.3 with MMC in the trabeculectomy group only | 2 | Mean Difference (IV, Random, 95% CI) | 0.0 [0.0, 0.0] | |
| 3 Postoperative IOP at one week Show forest plot | 13 | Mean Difference (IV, Random, 95% CI) | Totals not selected | |
| 3.1 with MMC in both groups | 4 | Mean Difference (IV, Random, 95% CI) | 0.0 [0.0, 0.0] | |
| 3.2 without MMC in both groups | 6 | Mean Difference (IV, Random, 95% CI) | 0.0 [0.0, 0.0] | |
| 3.3 with MMC in the trabeculectomy group only | 3 | Mean Difference (IV, Random, 95% CI) | 0.0 [0.0, 0.0] | |
| 4 Postoperative IOP at one month Show forest plot | 13 | 646 | Mean Difference (IV, Random, 95% CI) | ‐1.05 [‐1.96, ‐0.13] |
| 4.1 with MMC in both groups | 3 | 131 | Mean Difference (IV, Random, 95% CI) | ‐1.06 [‐1.84, ‐0.28] |
| 4.2 without MMC in both groups | 7 | 370 | Mean Difference (IV, Random, 95% CI) | ‐1.78 [‐3.65, 0.10] |
| 4.3 with MMC in the trabeculectomy group only | 3 | 145 | Mean Difference (IV, Random, 95% CI) | 0.44 [‐1.21, 2.09] |
| 5 Postoperative IOP at three months Show forest plot | 11 | 551 | Mean Difference (IV, Random, 95% CI) | ‐2.23 [‐2.93, ‐1.53] |
| 5.1 with MMC in both groups | 3 | 131 | Mean Difference (IV, Random, 95% CI) | ‐2.64 [‐3.50, ‐1.77] |
| 5.2 without MMC in both groups | 6 | 320 | Mean Difference (IV, Random, 95% CI) | ‐2.48 [‐3.89, ‐1.07] |
| 5.3 with MMC in the trabeculectomy group only | 2 | 100 | Mean Difference (IV, Random, 95% CI) | ‐0.76 [‐2.65, 1.14] |
| 6 Postoperative IOP at six months Show forest plot | 13 | 613 | Mean Difference (IV, Random, 95% CI) | ‐2.50 [‐3.34, ‐1.67] |
| 6.1 with MMC in both groups | 4 | 155 | Mean Difference (IV, Random, 95% CI) | ‐2.91 [‐3.87, ‐1.95] |
| 6.2 without MMC in both groups | 7 | 358 | Mean Difference (IV, Random, 95% CI) | ‐3.00 [‐4.52, ‐1.48] |
| 6.3 with MMC in the trabeculectomy group only | 2 | 100 | Mean Difference (IV, Random, 95% CI) | 0.14 [‐1.27, 1.55] |
| 7 Postoperative IOP at two years Show forest plot | 2 | Mean Difference (IV, Fixed, 95% CI) | Subtotals only | |
| 7.1 with MMC in the trabeculectomy group only | 1 | 52 | Mean Difference (IV, Fixed, 95% CI) | ‐0.20 [‐2.16, 1.76] |
| 7.2 without MMC in both groups | 1 | 34 | Mean Difference (IV, Fixed, 95% CI) | ‐2.96 [‐5.52, ‐0.40] |
| 8 Complications Show forest plot | 17 | Risk Ratio (M‐H, Random, 95% CI) | Subtotals only | |
| 8.1 Hypotony | 5 | 205 | Risk Ratio (M‐H, Random, 95% CI) | 0.40 [0.17, 0.94] |
| 8.2 Shallow anterior chamber | 13 | 632 | Risk Ratio (M‐H, Random, 95% CI) | 0.47 [0.30, 0.73] |
| 8.3 Hyphema | 5 | 235 | Risk Ratio (M‐H, Random, 95% CI) | 0.43 [0.14, 1.34] |
| 8.4 Bleb leakage | 2 | 98 | Risk Ratio (M‐H, Random, 95% CI) | 0.28 [0.10, 0.79] |
| 8.5 Encapsulated blebs | 5 | 175 | Risk Ratio (M‐H, Random, 95% CI) | 0.23 [0.08, 0.69] |
| 8.6 Choroidal detachment | 4 | 187 | Risk Ratio (M‐H, Random, 95% CI) | 0.47 [0.13, 1.71] |
| Outcome or subgroup title | No. of studies | No. of participants | Statistical method | Effect size |
| 1 Postoperative IOP at one year Show forest plot | 1 | 60 | Mean Difference (IV, Fixed, 95% CI) | ‐0.44 [‐1.76, 0.88] |
| 1.1 with MMC in both groups | 1 | 30 | Mean Difference (IV, Fixed, 95% CI) | 0.10 [‐1.58, 1.78] |
| 1.2 without MMC in both groups | 1 | 30 | Mean Difference (IV, Fixed, 95% CI) | ‐1.30 [‐3.42, 0.82] |
| 2 Hypotony at 24 months Show forest plot | 1 | 60 | Risk Ratio (M‐H, Fixed, 95% CI) | 0.29 [0.11, 0.77] |
| 2.1 with MMC in both groups | 1 | 30 | Risk Ratio (M‐H, Fixed, 95% CI) | 0.43 [0.14, 1.35] |
| 2.2 without MMC in both groups | 1 | 30 | Risk Ratio (M‐H, Fixed, 95% CI) | 0.14 [0.02, 1.02] |
| 3 Hyphaema at 24 months Show forest plot | 1 | 60 | Risk Ratio (M‐H, Fixed, 95% CI) | 0.8 [0.37, 1.74] |
| 3.1 with MMC in both groups | 1 | 30 | Risk Ratio (M‐H, Fixed, 95% CI) | 0.8 [0.27, 2.41] |
| 3.2 without MMC in both groups | 1 | 30 | Risk Ratio (M‐H, Fixed, 95% CI) | 0.8 [0.27, 2.41] |
| 4 Inflammation at 24 months Show forest plot | 1 | 60 | Risk Ratio (M‐H, Fixed, 95% CI) | 1.4 [0.50, 3.91] |
| 4.1 with MMC in both groups | 1 | 30 | Risk Ratio (M‐H, Fixed, 95% CI) | 1.33 [0.36, 4.97] |
| 4.2 without MMC in both groups | 1 | 30 | Risk Ratio (M‐H, Fixed, 95% CI) | 1.5 [0.29, 7.73] |
| 5 Shallow anterior chamber at 24 months Show forest plot | 1 | 60 | Risk Ratio (M‐H, Fixed, 95% CI) | 0.44 [0.15, 1.29] |
| 5.1 with MMC in both groups | 1 | 30 | Risk Ratio (M‐H, Fixed, 95% CI) | 0.5 [0.11, 2.33] |
| 5.2 without MMC in both groups | 1 | 30 | Risk Ratio (M‐H, Fixed, 95% CI) | 0.4 [0.09, 1.75] |
| 6 Flat anterior chamber at 24 months Show forest plot | 1 | 60 | Risk Ratio (M‐H, Fixed, 95% CI) | 0.6 [0.08, 4.28] |
| 6.1 with MMC in both groups | 1 | 30 | Risk Ratio (M‐H, Fixed, 95% CI) | 1.0 [0.07, 14.55] |
| 6.2 without MMC in both groups | 1 | 30 | Risk Ratio (M‐H, Fixed, 95% CI) | 0.33 [0.01, 7.58] |
| 7 Choroidal detachment at 24 months Show forest plot | 1 | 60 | Risk Ratio (M‐H, Fixed, 95% CI) | 0.43 [0.12, 1.51] |
| 7.1 with MMC in both groups | 1 | 30 | Risk Ratio (M‐H, Fixed, 95% CI) | 0.25 [0.03, 1.98] |
| 7.2 without MMC in both groups | 1 | 30 | Risk Ratio (M‐H, Fixed, 95% CI) | 0.67 [0.13, 3.44] |