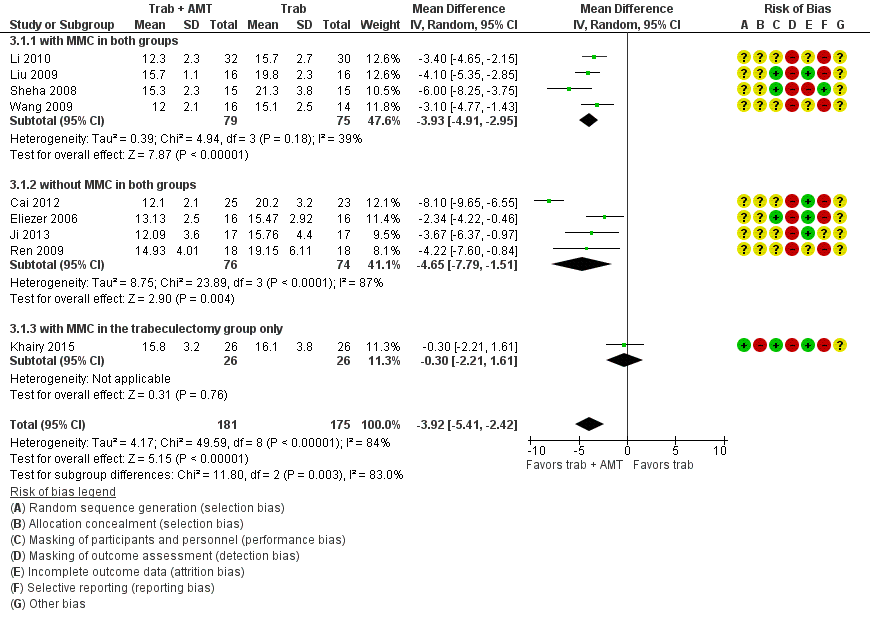
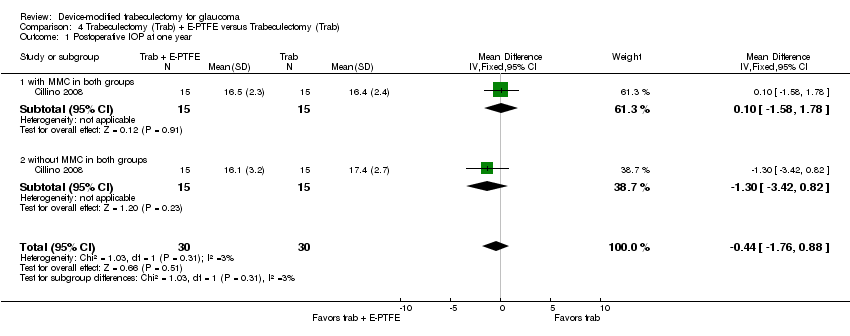
| 1 Postoperative IOP at one year Show forest plot | 9 | 356 | Mean Difference (IV, Random, 95% CI) | ‐3.92 [‐5.41, ‐2.42] |
|
| 1.1 with MMC in both groups | 4 | 154 | Mean Difference (IV, Random, 95% CI) | ‐3.93 [‐4.91, ‐2.95] |
| 1.2 without MMC in both groups | 4 | 150 | Mean Difference (IV, Random, 95% CI) | ‐4.65 [‐7.79, ‐1.51] |
| 1.3 with MMC in the trabeculectomy group only | 1 | 52 | Mean Difference (IV, Random, 95% CI) | ‐0.30 [‐2.21, 1.61] |
| 2 Postoperative IOP at one day Show forest plot | 8 | | Mean Difference (IV, Random, 95% CI) | Totals not selected |
|
| 2.1 with MMC in both groups | 2 | | Mean Difference (IV, Random, 95% CI) | 0.0 [0.0, 0.0] |
| 2.2 without MMC in both groups | 4 | | Mean Difference (IV, Random, 95% CI) | 0.0 [0.0, 0.0] |
| 2.3 with MMC in the trabeculectomy group only | 2 | | Mean Difference (IV, Random, 95% CI) | 0.0 [0.0, 0.0] |
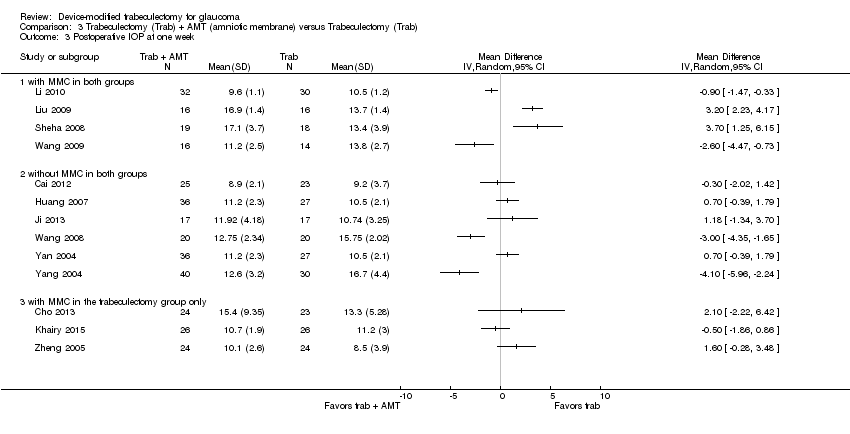
| 3 Postoperative IOP at one week Show forest plot | 13 | | Mean Difference (IV, Random, 95% CI) | Totals not selected |
|
| 3.1 with MMC in both groups | 4 | | Mean Difference (IV, Random, 95% CI) | 0.0 [0.0, 0.0] |
| 3.2 without MMC in both groups | 6 | | Mean Difference (IV, Random, 95% CI) | 0.0 [0.0, 0.0] |
| 3.3 with MMC in the trabeculectomy group only | 3 | | Mean Difference (IV, Random, 95% CI) | 0.0 [0.0, 0.0] |
| 4 Postoperative IOP at one month Show forest plot | 13 | 646 | Mean Difference (IV, Random, 95% CI) | ‐1.05 [‐1.96, ‐0.13] |
|
| 4.1 with MMC in both groups | 3 | 131 | Mean Difference (IV, Random, 95% CI) | ‐1.06 [‐1.84, ‐0.28] |
| 4.2 without MMC in both groups | 7 | 370 | Mean Difference (IV, Random, 95% CI) | ‐1.78 [‐3.65, 0.10] |
| 4.3 with MMC in the trabeculectomy group only | 3 | 145 | Mean Difference (IV, Random, 95% CI) | 0.44 [‐1.21, 2.09] |
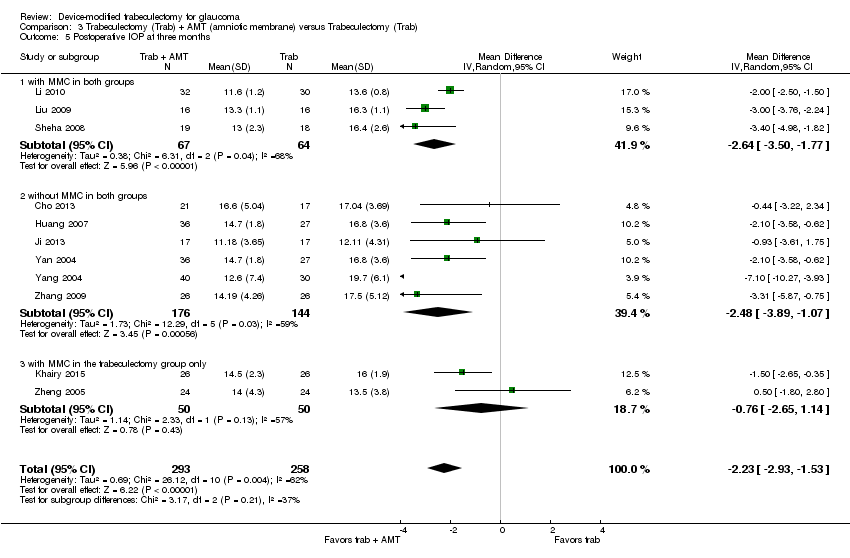
| 5 Postoperative IOP at three months Show forest plot | 11 | 551 | Mean Difference (IV, Random, 95% CI) | ‐2.23 [‐2.93, ‐1.53] |
|
| 5.1 with MMC in both groups | 3 | 131 | Mean Difference (IV, Random, 95% CI) | ‐2.64 [‐3.50, ‐1.77] |
| 5.2 without MMC in both groups | 6 | 320 | Mean Difference (IV, Random, 95% CI) | ‐2.48 [‐3.89, ‐1.07] |
| 5.3 with MMC in the trabeculectomy group only | 2 | 100 | Mean Difference (IV, Random, 95% CI) | ‐0.76 [‐2.65, 1.14] |
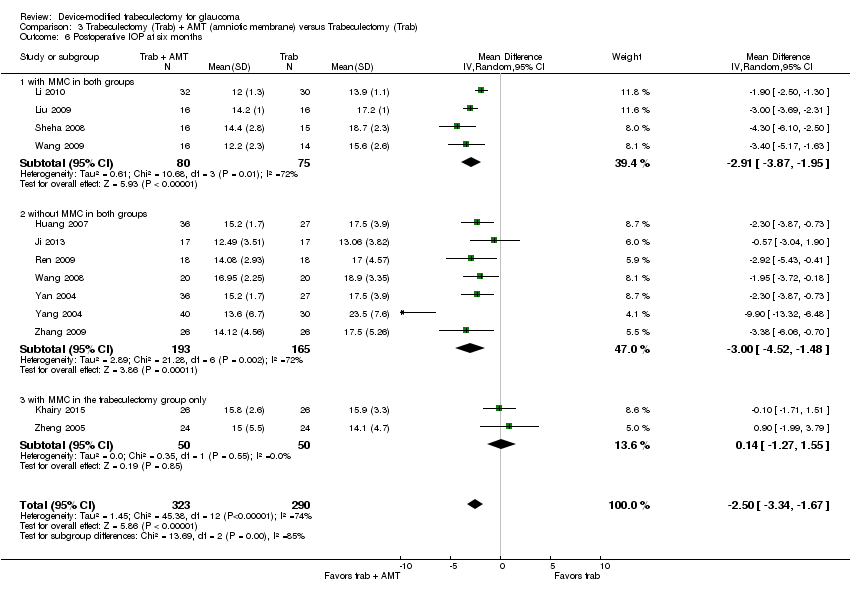
| 6 Postoperative IOP at six months Show forest plot | 13 | 613 | Mean Difference (IV, Random, 95% CI) | ‐2.50 [‐3.34, ‐1.67] |
|
| 6.1 with MMC in both groups | 4 | 155 | Mean Difference (IV, Random, 95% CI) | ‐2.91 [‐3.87, ‐1.95] |
| 6.2 without MMC in both groups | 7 | 358 | Mean Difference (IV, Random, 95% CI) | ‐3.00 [‐4.52, ‐1.48] |
| 6.3 with MMC in the trabeculectomy group only | 2 | 100 | Mean Difference (IV, Random, 95% CI) | 0.14 [‐1.27, 1.55] |
| 7 Postoperative IOP at two years Show forest plot | 2 | | Mean Difference (IV, Fixed, 95% CI) | Subtotals only |
|
| 7.1 with MMC in the trabeculectomy group only | 1 | 52 | Mean Difference (IV, Fixed, 95% CI) | ‐0.20 [‐2.16, 1.76] |
| 7.2 without MMC in both groups | 1 | 34 | Mean Difference (IV, Fixed, 95% CI) | ‐2.96 [‐5.52, ‐0.40] |
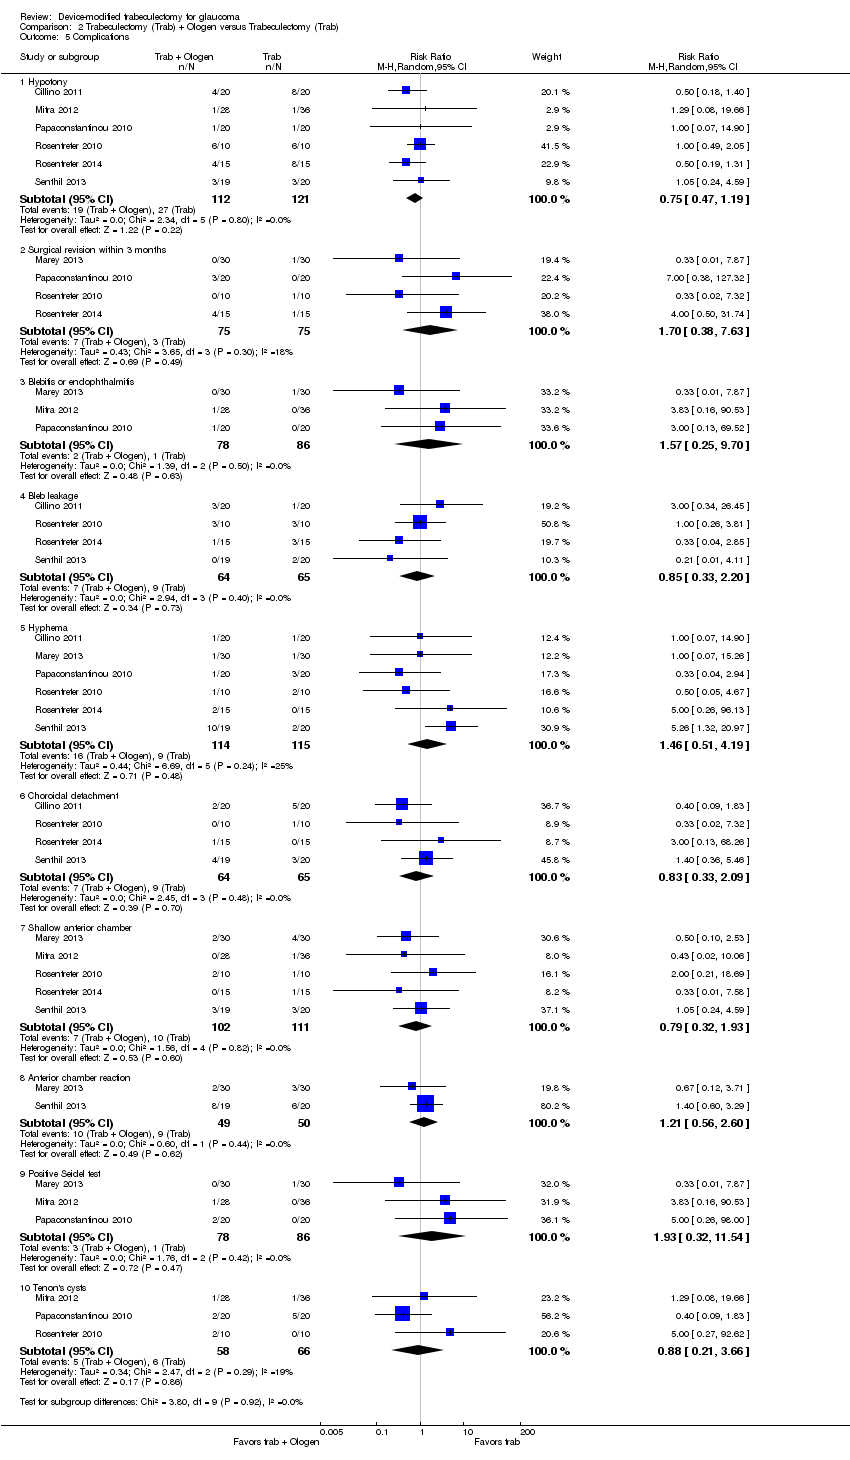
| 8 Complications Show forest plot | 17 | | Risk Ratio (M‐H, Random, 95% CI) | Subtotals only |
|
| 8.1 Hypotony | 5 | 205 | Risk Ratio (M‐H, Random, 95% CI) | 0.40 [0.17, 0.94] |
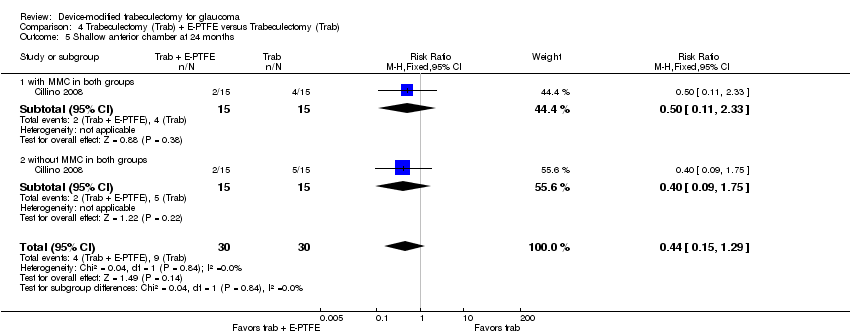
| 8.2 Shallow anterior chamber | 13 | 632 | Risk Ratio (M‐H, Random, 95% CI) | 0.47 [0.30, 0.73] |
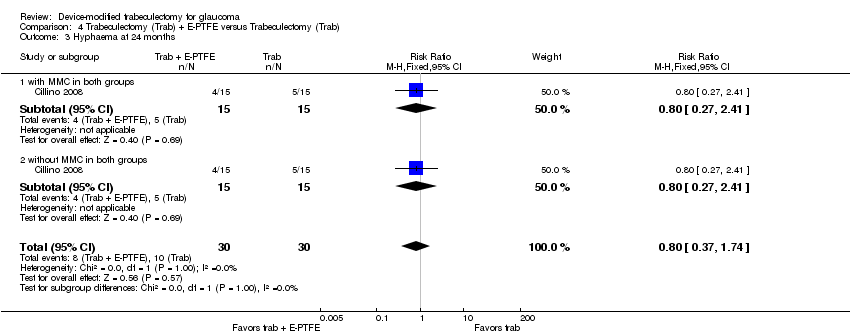
| 8.3 Hyphema | 5 | 235 | Risk Ratio (M‐H, Random, 95% CI) | 0.43 [0.14, 1.34] |
| 8.4 Bleb leakage | 2 | 98 | Risk Ratio (M‐H, Random, 95% CI) | 0.28 [0.10, 0.79] |
| 8.5 Encapsulated blebs | 5 | 175 | Risk Ratio (M‐H, Random, 95% CI) | 0.23 [0.08, 0.69] |
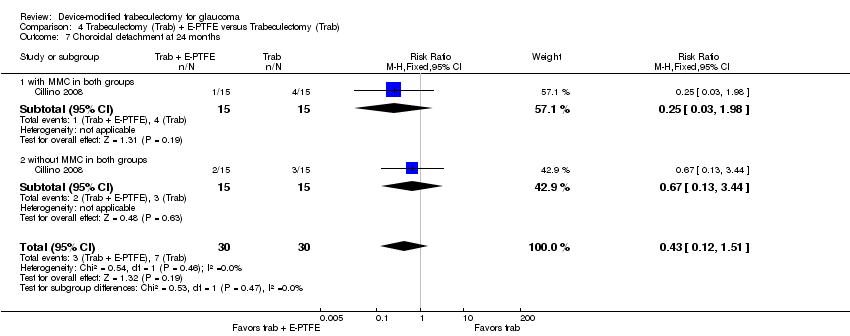
| 8.6 Choroidal detachment | 4 | 187 | Risk Ratio (M‐H, Random, 95% CI) | 0.47 [0.13, 1.71] |