Intervenciones para el tratamiento de los trastornos gustativos
Información
- DOI:
- https://doi.org/10.1002/14651858.CD010470.pub2Copiar DOI

- Base de datos:
-
- Cochrane Database of Systematic Reviews
- Versión publicada:
-
- 26 noviembre 2014see what's new
- Tipo:
-
- Intervention
- Etapa:
-
- Review
- Grupo Editorial Cochrane:
-
Grupo Cochrane de Salud oral
- Copyright:
-
- Copyright © 2014 The Cochrane Collaboration. Published by John Wiley & Sons, Ltd.
Cifras del artículo
Altmetric:
Citado por:
Autores
Contributions of authors
-
Sumanth Kumbargere Nagraj: Protocol, select trials, analysis, final review, and update review.
-
Naresh Yedthare Shetty: Obtain copies of trials, select trials, and extract data.
-
Srinivas Kandula: Develop search strategy, search for trials, extract data from trials, and enter data into Review Manager 5.
-
Ashish Shreshta: Carry‐out analysis and interpret analysis.
-
Renjith George: Search for trials, extract data from trials, enter data into Review Manager 5, and draft the final review.
-
David Levenson: Protocol, draft the final review, and update review.
-
Debra M Ferraiolo: Protocol, draft the final review, and update review
Sources of support
Internal sources
-
Faculty of Dentistry, Melaka Manipal Medical College, Manipal University, Melaka Campus, Malaysia.
-
Faculty of Dentistry, International Medical University, Kuala Lumpur, Malaysia.
External sources
-
National Institute for Health Research (NIHR), UK.
CRG funding acknowledgement:
The NIHR is the largest single funder of the Cochrane Oral Health GroupDisclaimer:
The views and opinions expressed therein are those of the authors and do not necessarily reflect those of the NIHR, NHS or the Department of Health. -
Cochrane Oral Health Group Global Alliance, UK.
All reviews in the Cochrane Oral Health Group are supported by Global Alliance member organisations (British Orthodontic Society, UK; British Society of Paediatric Dentistry, UK; Canadian Dental Hygienists Association, Canada; National Center for Dental Hygiene Research & Practice, USA; and New York University College of Dentistry, USA) providing funding for the editorial process (http://ohg.cochrane.org)
-
Prof. BV Moses & ICMR Centre for Advanced Research in Evidence‐Informed Healthcare; South Asian Cochrane Network & Centre, Christian Medical College, Vellore, India.
For training in review completion
Declarations of interest
None known.
Acknowledgements
We are extremely thankful to Anne Littlewood, Trials Search Co‐ordinator; Luisa M Fernandez Mauleffinch, Managing Editor; Philip Riley, Systematic Reviewer; Helen Wakeford, Deputy Managing Editor; Jo Weldon, Research Co‐ordinator; and Helen Worthington, Co‐ordinating Editor, Cochrane Oral Health Group. We thank Prof. Datuk Dr. Abdul Razzak, Pro VC, Manipal University, Melaka campus, for his constant encouragement to undertake Cochrane reviews; Prof. Adinegara Lutfi Abbas, Deputy Dean, MMMC; and Prof. Abdul Rashid Hj Ismail, Dean, Faculty of Dentistry, MMMC for all suggestions and help during the review preparation. We would also like to thank all study authors who responded to our emails (Dr. Robert Henkin, Dr. Masfumi Sakagami, Dr. Anand Prasad, Mr.Tadahiro Ooshiro, and Dr. Eggert JV). The authors wish to thank Prof. Dr Pratap Tharyan and Mr. Richard K in the review preparation.
We are indebted to Ms. Shazana MS, Chief Librarian, Melaka Manipal Medical college; Ms. Janet Lear, School of Dentistry, University of Manchester; Ms. Vasumathi Sriganesh; and Ms. Parvati Iyer, QMed Knowledge Foundation, Mumbai; Prof. Dr. Siar Chong Huat, University of Malaya, Kuala Lumpur, Malaysia; Dr. Satbir Singh, University of Minnesota, USA; and Dr. Ajit Auluck, British Coloumbia University, Canada for helping us in procuring full text articles. We are extremely thankful to Ms. Lisa Schell, German Cochrane Centre, Freiburg, Germany; Ms. Erica Ota, Chief, Division of Epidemiology, National Centre for Child Health and Development, Okura, Japan; and Prof. Naito Toru, Fukuoka Dental College, Japan for helping us in translations of foreign language articles.
We are grateful to Prof. Noorliza Mastura Ismail; Prof. Krithika C; and Dr. Prashanti Eachempati for their help in proof‐reading and editing.
Version history
| Published | Title | Stage | Authors | Version |
| 2017 Dec 20 | Interventions for managing taste disturbances | Review | Sumanth Kumbargere Nagraj, Renjith P George, Naresh Shetty, David Levenson, Debra M Ferraiolo, Ashish Shrestha | |
| 2014 Nov 26 | Interventions for the management of taste disturbances | Review | Sumanth Kumbargere Nagraj, Shetty Naresh, Kandula Srinivas, P Renjith George, Ashish Shrestha, David Levenson, Debra M Ferraiolo | |
| 2013 Apr 30 | Interventions for the management of taste disturbances | Protocol | Nagraj Sumanth Kumbargere, Yedthare Shetty Naresh, Kandula Srinivas, P Renjith George, Ashish Shrestha, David Levenson, Debra M Ferraiolo | |
Differences between protocol and review
We did not mention any method for data described in ordinal scales in our protocol in the section 'Measures of treatment effect'. In our review, we converted the ordinal scale (degree of improvement in 3 Likert scale) as dichotomous data and analysed this for the Sakai 2002 trial.
We included two cross‐over trials in our review. We could not use the data for meta‐analysis of the primary outcome, as stated in our protocol ('Unit of analysis issues and 'Data synthesis' sections) because the Watson 1983 trial reported the results in median values. In the Eggert 1982 trial, we derived the data from graphs and used only the data before cross‐over due to the insufficient washout period. We did not use the generic variance method to incorporate the data in our meta‐analysis, as stated in our protocol.
We did not convert continuous data to dichotomous data, as stated in our protocol, and we analysed them separately.
In our protocol we did not mention any methodology for extracting data from graphs; in our review, we obtained data from graphs in two trials (Eggert 1982; Mahajan 1980).
We had not mentioned any method for combining data for analysis in our protocol; in our review, we combined data for one trial (Sakagami 2009) as this trial had tested different dosages of polaprezinc.
We could not contact authors for two trials (Sakai 2002; Watson 1983) as stated in our protocol due to non‐availability of contact details.
We did not assess reporting bias, as mentioned in the protocol, because we only included nine trials in our meta‐analysis.
In our protocol, we did not exclude taste disorders secondary to xerostomia. Xerostomia can hamper taste perception and due to this, we excluded the Velargo 2012 trial.
Keywords
MeSH
Medical Subject Headings (MeSH) Keywords
Medical Subject Headings Check Words
Adolescent; Adult; Child; Humans;
PICO
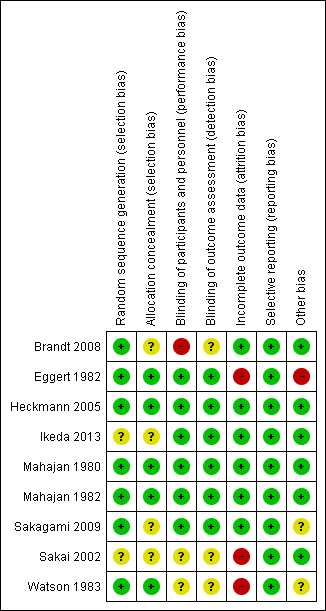
Risk of bias summary: review authors' judgements about each risk of bias item for each included study.

Study flow diagram.
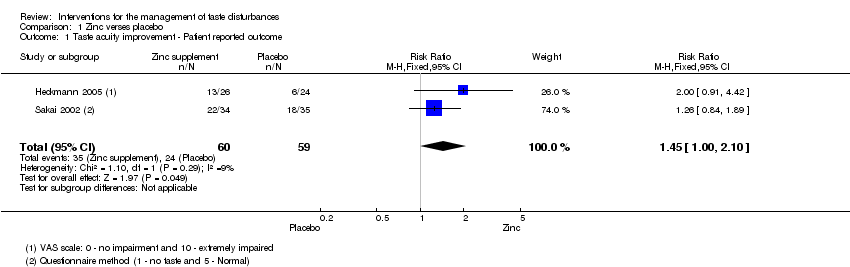
Comparison 1 Zinc verses placebo, Outcome 1 Taste acuity improvement ‐ Patient reported outcome.
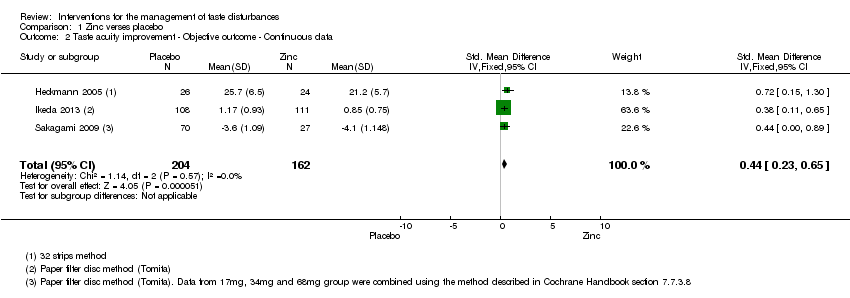
Comparison 1 Zinc verses placebo, Outcome 2 Taste acuity improvement ‐ Objective outcome ‐ Continuous data.
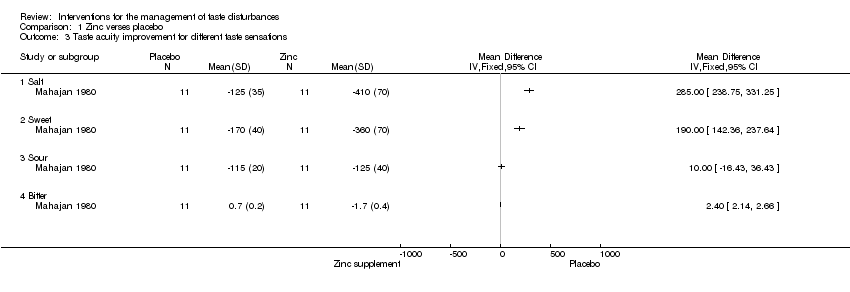
Comparison 1 Zinc verses placebo, Outcome 3 Taste acuity improvement for different taste sensations.

Comparison 1 Zinc verses placebo, Outcome 4 Cross‐over study.

Comparison 1 Zinc verses placebo, Outcome 5 Taste acuity improvement ‐ Objective outcome ‐ Dichotomous.
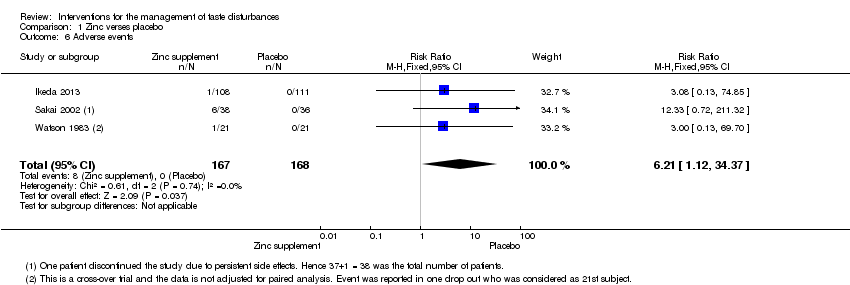
Comparison 1 Zinc verses placebo, Outcome 6 Adverse events.
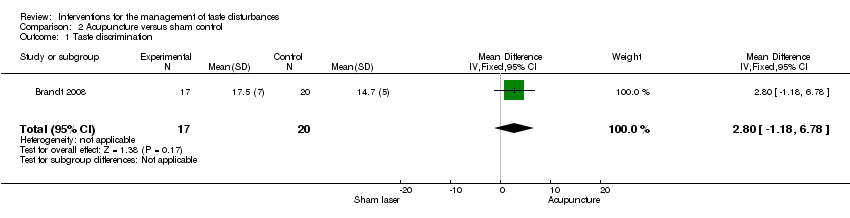
Comparison 2 Acupuncture versus sham control, Outcome 1 Taste discrimination.
| Zinc compared to placebo for the management of taste disturbances | ||||||
| Patient or population: patients with taste disturbances | ||||||
| Outcomes | Illustrative comparative risks* (95% CI) | Relative effect | No of Participants | Quality of the evidence | Comments | |
| Assumed risk | Corresponding risk | |||||
| Placebo | Zinc | |||||
| Taste acuity improvement ‐ Patient reported outcome | Study population | RR 1.45 | 119 | ⊕⊝⊝⊝ | ─ | |
| ˗407 per 1000 | 590 per 1000 | |||||
| Moderate | ||||||
| 382 per 1000 | 554 per 1000 | |||||
| Taste acuity improvement ‐ Objective outcome ‐ Continuous ‐ Overall taste improvement | ─ | The mean taste acuity improvement ‐ objective outcome ‐ continuous ‐ overall taste improvement in the intervention groups was | ─ | 366 | ⊕⊕⊕⊝ | SMD 0.44 (0.23 to 0.65) |
| Taste acuity improvement ‐ Objective outcome ‐ Continuous ‐ Taste recognition | — | The mean taste acuity improvement ‐ objective outcome ‐ continuous ‐ taste recognition in the intervention groups was | ─ | 14 | ⊕⊝⊝⊝ | Standardised mean difference (SMD) 1.26 (0.07 to 2.44) |
| Taste acuity improvement ‐ Objective outcome ‐ Dichotomous ‐ Idiopathic and zinc deficient taste disorders | Study population | RR 1.7 | 73 | ⊕⊕⊝⊝ | ─ | |
| ─444 per 1000 | 756 per 1000 | |||||
| Moderate | ||||||
| 444 per 1000 | 755 per 1000 | |||||
| Adverse events | Study population7 | RR 6.21 | 335 | ─ | ─ | |
| 1 per 1000 | 6 per 1000 | |||||
| Moderate | ||||||
| *The basis for the assumed risk (e.g. the median control group risk across studies) is provided in footnotes. The corresponding risk (and its 95% confidence interval) is based on the assumed risk in the comparison group and the relative effect of the intervention (and its 95% CI). | ||||||
| GRADE Working Group grades of evidence | ||||||
| 1 Risk of bias: unclear randomisation and blinding and high risk of bias due to attrition in Sakai 2002. Downgraded by 1 level. 7Risk of one per 1000 assumed in placebo group (as it was zero). 8Sakagami 2009 was not included in the grading of evidence as the number of patients reporting adverse events was not reported. | ||||||
| Acupuncture compared to sham control for patients with taste disturbances | ||||||
| Patient or population: patients with taste disturbances | ||||||
| Outcomes | Illustrative comparative risks* (95% CI) | Relative effect | No of Participants | Quality of the evidence | Comments | |
| Assumed risk | Corresponding risk | |||||
| Sham control | Acupuncture | |||||
| Taste discrimination | ─ | The mean taste discrimination in the intervention groups was | ─ | 37 | ⊕⊕⊝⊝ | ─ |
| *The basis for the assumed risk (e.g. the median control group risk across studies) is provided in footnotes. The corresponding risk (and its 95% confidence interval) is based on the assumed risk in the comparison group and the relative effect of the intervention (and its 95% CI). | ||||||
| GRADE Working Group grades of evidence | ||||||
| 1 Single‐blinded study. | ||||||
| Outcome | Gp A | Gp B | Time when measured | ||||
| Mean* | S.D. | n= | Mean* | S.D. | n= | ||
| Change of the mean 4 basic taste sensitivity scores from baseline | ‐0.52 | 0.68 | 108 | ‐0.47 | 0.61 | 111 | 4 weeks |
| ‐0.90 | 0.85 | 108 | ‐0.67 | 0.73 | 111 | 8 weeks | |
| ‐1.17 | 0.93 | 108 | ‐0.85 | 0.75 | 111 | 12 weeks | |
| ‐1.28 | 0.94 | 108 | ‐0.97 | 0.76 | 111 | 4 weeks after treatment | |
| *Minus change score means better by filter paper disc method by Tomita | |||||||
| Outcome | Gp A events (Improved) | Gp A total | Gp B events | Gp B total | Time when measured |
| Improved/not improved | 60 | 108 | 48 | 111 | 12 weeks |
| Outcome | Gp A (Placebo) N = 27 | Gp B (17 mg zinc) N = 27 | Gp C (34 mg zinc) N = 25 | Gp D (68 mg zinc) N = 28 | Time when measured | ||||
| Secondary outcome | Mean | Std Dev | Mean | Std Dev | Mean | Std Dev | Mean | Std Dev | 12 weeks |
| Mean filter paper disk test scores (filter paper disk) | 4.095 | 1.148 | 4.350 | 1.030 | 3.448 | 0.928 | 3.454 | 1.138 | ─ |
| Mean serum zinc level | 1.8 | 12.7 | 5.7 | 13.5 | 11.4 | 16.6 | 20.6 | 21.3 | ─ |
| Gp A | Gp B | Gp C | Gp D | ─ | |||||
| Increase in the average score of subjective symptoms | 0.6 | 0.9 | 1.2 | 1.0 | ─ | ||||
| Primary outcome: quantitative analysis of taste perception using filter paper disk method | Event (success) Cured + improved | No event (fail) Unchanged, neither cured nor improved nor worsened; aggravated | Total |
| Experimental intervention (17 mg Zinc) | SE= 14 | FE= 13 | NE= 27 |
| Control intervention (Placebo) | SC= 17 | FC= 10 | NC= 27 |
| RR = 0.824; OR = 0.634; RD = 0.447 | |||
| Experimental intervention (34 mg Zinc) | SE= 20 | FE= 5 | NE= 25 |
| Control intervention (Placebo) | SC= 17 | FC= 10 | NC= 27 |
| RR = 0.318; OR = 2.353; RD = 0.17 | |||
| Experimental intervention (68 mg Zinc) | SE= 25 | FE= 3 | NE= 28 |
| Control intervention (Placebo) | SC= 17 | FC= 10 | NC= 27 |
| RR = 1.418; OR = 4.902; RD = 0.263 | |||
| RR = risk ratio: risk of event in experimental group/risk of event in control group. OR = odds ratio: odds of event in experimental group/ odds of event in control group. RD = risk difference: risk of event in experimental group – risk of event in control group. | |||
| Filter paper disk method | Event (success) Improved (+cured) | No event (fail) Unchanged | Total (N = 73) |
| Experimental intervention (Zinc picolinate) | SE= 28 | FE= 9 | NE= 37 |
| Control intervention (Placebo) | SC= 16 | FC= 20 | NC= 36 |
| RR = 1.703; OR = 3.889; RD = 0.312 | |||
| Experimental intervention (Zinc picolinate) | SE= 22 | FE= 12 | NE= 34 |
| Control intervention (Placebo) | SC= 18 | FC= 17 | NC= 35 |
| RR = 1.258 ; OR = 1.732; RD = 0.133 | |||
| RR = risk ratio: risk of event in experimental group/risk of event in control group. OR = odds ratio: odds of event in experimental group/ odds of event in control group. RD = risk difference: risk of event in experimental group – risk of event in control group. | |||
| Outcome | Gp A (Zinc treatment) | Gp B (Placebo) | Time when measured | ||||
| Mean | Std Dev | N= | Mean | Std Dev | N= | At the end of 3 months | |
| Primary outcome | ─ | ||||||
| Taste test (32 filter paper strip method by Muller et al 2003) | 25.7 | 6.5 | 26 | 21.2 | 5.7 | 24 | ─ |
| Self rated impairment in % (VAS scale of 10 cm length equivalent to 100%; 0 to 10. 0 = no impairment and 10 = extremely impaired) | 45.0 | 4.4 | 26 | 43.8 | 3.6 | 24 | ─ |
| Secondary outcome | ─ | ||||||
| Beck Depression Inventory (BDI) | 7.5 | 7.0 | 26 | 11.3 | 10.9 | 24 | ─ |
| von Zersen Mood Scale (ZMS) | 10.7 | 7.5 | 26 | 18.8 | 14.6 | 24 | ─ |
| Zinc in serum (microgram/dL) | 81.53 | 19.61 | 26 | 72.01 | 10.22 | 24 | ─ |
| Type of Intervention | Event (success) Improved | No event (fail) | Total |
| Experimental intervention (Zinc) | SE= 13 | FE= 13 | NE= 26 |
| Control intervention | SC= 6 | FC= 18 | NC= 24 |
| RR = 2; OR = 3; RD = 0.25 | |||
| RR = risk ratio: risk of event in experimental group/risk of event in control group. OR = odds ratio: odds of event in experimental group/ odds of event in control group. RD = risk difference: risk of event in experimental group – risk of event in control group. | |||
| Outcome | Gp A | Gp B | Time when measured | ||||||
| Mean | Std Dev* | N=17 | Mean | Std Dev* | N=20 | ||||
| Taste discrimination | 11.7 (before)/ 17.5 (after) | 4 (before)/ | ─ | 11.9 (before)/ 14.7(after) | 5 (before)/ | ─ | Before and after treatment | ||
| Quality of life | Not estimable (changes per group only given for each of the 5 individual questions of the questionnaire, but no combined score/analysis stated) Only information given: ‘both treatments resulted in an increased quality of life, however, no statistically significant difference could be found’ | Before and after treatment | |||||||
| Depressive symptoms | 11 (before)/ 6 (after)* | 5 (before) / 4 (after)* | ─ | 10,5 (before)/ 10 (after)* | 7 (before)/ 7 (after)* | ─ | Before and after treatment | ||
| “The psychological well‐being of the intervention groups increased for 94,1% of all patients in the intervention group, but only for 60% of patients in the control group. This difference was statistically significant” | |||||||||
| Subjective well‐being | 16 (before)/ 12 (after)* | 10 (before)/ 7 (after)* | ─ | 20 (before)/ 18 (after)* | 9 (before)/ 14 (after)* | ─ | Before and after treatment | ||
| “58.8% of all patients in the intervention group felt better, whereas only 45% of all patients in the control group felt better. This difference was not statistically significant” | |||||||||
| *Only given in graph ‐> estimated from graph | |||||||||
| Outcome | Gp A – Zinc picolinate events | Gp A total | Gp B – Placebo Events | Gp B total | Time when measured |
| Adverse events | 6 | 37 | 0 | 36 | 3 months |
| Outcome | Gp A ‐ 17 mg Zinc events | Gp A total | Gp B – 34 mg zinc Events | Gp B total | Gp C – 68 mg zinc events | Gp C total | Gp D ‐ Placebo events | Gp D total | Time when measured |
| Side effects | 5 | 27 | 6 | 25 | 7 | 28 | 3 | 27 | 12 weeks |
| Outcome or subgroup title | No. of studies | No. of participants | Statistical method | Effect size |
| 1 Taste acuity improvement ‐ Patient reported outcome Show forest plot | 2 | 119 | Risk Ratio (M‐H, Fixed, 95% CI) | 1.45 [1.00, 2.10] |
| 2 Taste acuity improvement ‐ Objective outcome ‐ Continuous data Show forest plot | 3 | 366 | Std. Mean Difference (IV, Fixed, 95% CI) | 0.44 [0.23, 0.65] |
| 3 Taste acuity improvement for different taste sensations Show forest plot | 1 | Mean Difference (IV, Fixed, 95% CI) | Totals not selected | |
| 3.1 Salt | 1 | Mean Difference (IV, Fixed, 95% CI) | 0.0 [0.0, 0.0] | |
| 3.2 Sweet | 1 | Mean Difference (IV, Fixed, 95% CI) | 0.0 [0.0, 0.0] | |
| 3.3 Sour | 1 | Mean Difference (IV, Fixed, 95% CI) | 0.0 [0.0, 0.0] | |
| 3.4 Bitter | 1 | Mean Difference (IV, Fixed, 95% CI) | 0.0 [0.0, 0.0] | |
| 4 Cross‐over study Show forest plot | 1 | 14 | Mean Difference (IV, Fixed, 95% CI) | 3.00 [0.66, 5.34] |
| 5 Taste acuity improvement ‐ Objective outcome ‐ Dichotomous Show forest plot | 2 | Risk Ratio (M‐H, Fixed, 95% CI) | Subtotals only | |
| 5.1 Idiopathic and zinc deficient taste disorders | 1 | 73 | Risk Ratio (M‐H, Fixed, 95% CI) | 1.70 [1.13, 2.56] |
| 5.2 Taste disorder secondary to chronic renal failure | 1 | 24 | Risk Ratio (M‐H, Fixed, 95% CI) | 25.0 [1.65, 379.57] |
| 6 Adverse events Show forest plot | 3 | 335 | Risk Ratio (M‐H, Fixed, 95% CI) | 6.21 [1.12, 34.37] |
| Outcome or subgroup title | No. of studies | No. of participants | Statistical method | Effect size |
| 1 Taste discrimination Show forest plot | 1 | 37 | Mean Difference (IV, Fixed, 95% CI) | 2.80 [‐1.18, 6.78] |