Intervenciones microinvasivas para el tratamiento de las caries dentales proximales en dientes permanentes y primarios
Información
- DOI:
- https://doi.org/10.1002/14651858.CD010431.pub2Copiar DOI

- Base de datos:
-
- Cochrane Database of Systematic Reviews
- Versión publicada:
-
- 05 noviembre 2015see what's new
- Tipo:
-
- Intervention
- Etapa:
-
- Review
- Grupo Editorial Cochrane:
-
Grupo Cochrane de Salud oral
- Copyright:
-
- Copyright © 2015 The Cochrane Collaboration. Published by John Wiley & Sons, Ltd.
Cifras del artículo
Altmetric:
Citado por:
Autores
Contributions of authors
Mojtaba Dorri (MD): drafting of the protocol, designing a search strategy, screening search results, selecting studies, writing to authors of papers for additional information, assessing quality, extracting data, carrying out the analysis, interpreting the analysis, drafting the final review, updating the review.
Falk Schwendicke (FS) ‐ selecting studies, writing to authors of papers for additional information, assessing quality, extracting data, carrying out the analysis, interpreting the analysis, drafting the final review, updating the review.
Stephen Dunne (SD) ‐ drafting the protocol, drafting the final review, updating the review.
Tanya Walsh (TW) ‐ extracting data, carrying out the analysis, interpreting the analysis, drafting the final review, updating the review.
Sources of support
Internal sources
-
School of Dentistry, The University of Manchester, UK.
External sources
-
National Institute for Health Research (NIHR), UK.
This project was supported by the NIHR, via Cochrane Infrastructure funding to the Cochrane Oral Health Group. The views and opinions expressed therein are those of the authors and do not necessarily reflect those of the Systematic Reviews Programme, NIHR, NHS or the Department of Health.
-
Cochrane Oral Health Group Global Alliance, Other.
Through our Global Alliance (http://ohg.cochrane.org/partnerships‐alliances), the Cochrane Oral Health Group has received support from: British Association for the Study of Community Dentistry, UK; British Association of Oral Surgeons, UK; British Orthodontic Society, UK; British Society of Paediatric Dentistry, UK; British Society of Periodontology, UK; Canadian Dental Hygienists Association, Canada; Mayo Clinic, USA; National Center for Dental Hygiene Research & Practice, USA; New York University College of Dentistry, USA; and Royal College of Surgeons of Edinburgh, UK.
Declarations of interest
Mojtaba Dorri: none known
Stephen M Dunne: none known
Falk Schwendicke: FS is lecturing dentists for DMG, Hamburg, and has been counselling DMG on future projects not related to techniques evaluated by the present review.
Tanya Walsh: none known
Acknowledgements
Review authors would like to thank the Cochrane Oral Health Group and referees Professors Kim Ekstrand, Margherita Fontana, Afshid Anvarkhah and Dr Nicola Innes for their comments, support and assistance in conducting this review. We would also like to thank Professor Helen Worthington for her expertise regarding the data synthesis and Dr Wael Sabbah for his contribution in developing the protocol for this review.
Version history
| Published | Title | Stage | Authors | Version |
| 2015 Nov 05 | Micro‐invasive interventions for managing proximal dental decay in primary and permanent teeth | Review | Mojtaba Dorri, Stephen M Dunne, Tanya Walsh, Falk Schwendicke | |
| 2013 Mar 28 | Proximal sealing for managing dental decay in primary and permanent teeth | Protocol | Mojtaba Dorri, Stephen M Dunne, Wael Sabbah, Bahar Kiani | |
Differences between protocol and review
-
Title of the review ‐ changed from 'Proximal sealing for managing dental decay in primary and permanent teeth' to 'Micro‐invasive interventions for managing proximal dental decay in primary and permanent teeth'.
-
Description of interventions ‐ we renamed three groups of interventions from the protocol in the full review, from:
-
"Conventional restorative management" to "Conventional invasive treatment";
-
"Non‐operative management" to "Non‐invasive treatment";
-
"Proximal sealing ‐ a novel approach" to "Proximal sealing (micro‐invasive) treatments".
-
-
Electronic searches ‐ we intended to search Google Scholar (http://scholar.google.com/) in addition to the databases listed in Electronic searches; however, as this might have yielded a large number of results with only limited scientific relevance, we did not do so.
-
Measures of treatment effect ‐ for dichotomous outcomes we used the odds ratio for the measure of effect. This was necessary because of the inappropriate reporting of the included split‐mouth studies, and the method employed to re‐analyse the data for meta‐analysis.
-
Additional subgroup analysis ‐ post hoc we added dentition (deciduous or permanent) and caries risk (low to moderate, moderate, mostly high or high).
Keywords
MeSH
Medical Subject Headings (MeSH) Keywords
Medical Subject Headings Check Words
Adolescent; Adult; Child; Child, Preschool; Female; Humans; Male;
PICO

Study flow diagram

Risk of bias graph: review authors' judgements about each risk of bias item presented as percentages across all included studies

Risk of bias summary: review authors' judgements about each risk of bias item for each included study

Forest plot of comparison: 1 Proximal sealing versus control/placebo, outcome: 1.1 Caries progression follow‐up 12 to 36 months ‐ DSR>Pairwise>Scoring
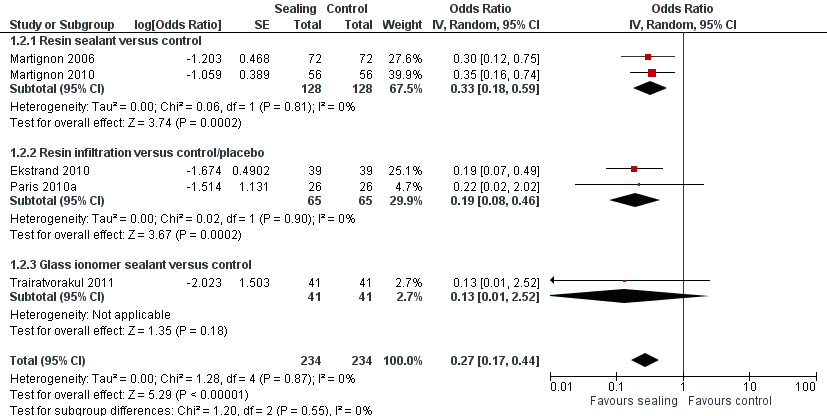
Forest plot of comparison: 1 Proximal sealing versus control/placebo, outcome: 1.2 Caries progression follow‐up 12 to 30 months ‐ Scoring
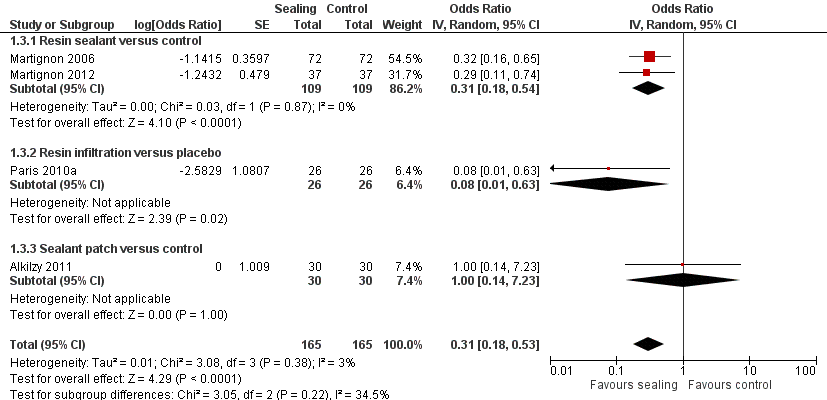
Forest plot of comparison: 1 Proximal sealing versus control/placebo, outcome: 1.2 Pairwise

Forest plot of comparison: 1 Proximal sealing versus control/placebo, outcome: 1.4 Caries progression follow‐up 12 to 18 months ‐ Digital Substraction Radiography.
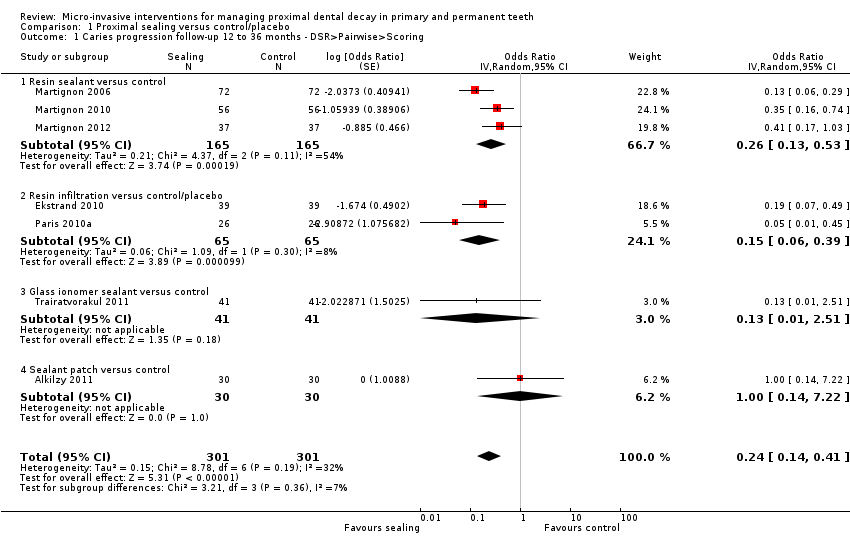
Comparison 1 Proximal sealing versus control/placebo, Outcome 1 Caries progression follow‐up 12 to 36 months ‐ DSR>Pairwise>Scoring.

Comparison 1 Proximal sealing versus control/placebo, Outcome 2 Caries progression follow‐up 12 to 30 months ‐ Scoring.

Comparison 1 Proximal sealing versus control/placebo, Outcome 3 Caries progression follow‐up 18 to 36 months ‐ Pairwise.

Comparison 1 Proximal sealing versus control/placebo, Outcome 4 Caries progression follow‐up 12 to 18 months ‐ Digital Substraction Radiography.
| Micro‐invasive versus non‐invasive treatments for managing dental decay in primary and permanent teeth | ||||||
| Patient or population: people with dental decay on proximal surfaces of primary and permanent teeth Comparison: non‐invasive treatments (e.g. fluoride varnish, advice to floss) Radiographic follow‐up period: 6 months to 3 years | ||||||
| Outcomes | Anticipated absolute effects* (95% CI) | Odds Ratio | № of participants | Quality of the evidence | Comments | |
| Risk with control | Risk with Sealing | |||||
| Caries progression measured by DSR > pairwise > visual scoring (12 months to 36 months follow‐up) | Study population | OR 0.24 | 602 (7 RCTs) | ⊕⊕⊕⊝ | The quality of evidence for caries progression measured by scoring (12 to 30 months), including 468 participants (5 RCTs), OR 0.27 (95% CI 0.17 to 0.44), was moderatea,b,c. The quality of evidence for caries progression measured by pairwise (18 to 36 months), including 330 participants (4 RCTs), OR 0.31 (95% CI 0.18 to 0.53), was moderatea,b,c. The quality of evidence for caries progression measured by digital substraction radiography (12 months to 18 months), including 270 participants (3 RCTs), OR 0.18 (95% CI 0.06 to 0.50), was moderatea,b,c. | |
| 547 per 1000 | 284 per 1000 | |||||
| Moderate | ||||||
| 649 per 1000 | 337 per 1000 | |||||
| Change in decayed, missing and filled (DMF/dmf) figures at surface, tooth and whole mouth level. | — | — | — | — | — | No studies reported on caries measured as change in decayed, missing and filled (DMF/dmf) figures at surface, tooth or whole mouth level |
| *The risk in the intervention group (and its 95% confidence interval) is based on the assumed risk in the comparison group and the relative effect of the intervention (and its 95% CI). | ||||||
| GRADE Working Group grades of evidence | ||||||
| aOne or more studies lacked sufficient blinding of participants, personnel or both. Downgraded one level. | ||||||
| Outcome or subgroup title | No. of studies | No. of participants | Statistical method | Effect size |
| 1 Caries progression follow‐up 12 to 36 months ‐ DSR>Pairwise>Scoring Show forest plot | 7 | 602 | Odds Ratio (Random, 95% CI) | 0.24 [0.14, 0.41] |
| 1.1 Resin sealant versus control | 3 | 330 | Odds Ratio (Random, 95% CI) | 0.26 [0.13, 0.53] |
| 1.2 Resin infiltration versus control/placebo | 2 | 130 | Odds Ratio (Random, 95% CI) | 0.15 [0.06, 0.39] |
| 1.3 Glass ionomer sealant versus control | 1 | 82 | Odds Ratio (Random, 95% CI) | 0.13 [0.01, 2.51] |
| 1.4 Sealant patch versus control | 1 | 60 | Odds Ratio (Random, 95% CI) | 1.0 [0.14, 7.22] |
| 2 Caries progression follow‐up 12 to 30 months ‐ Scoring Show forest plot | 5 | 468 | Odds Ratio (Random, 95% CI) | 0.27 [0.17, 0.44] |
| 2.1 Resin sealant versus control | 2 | 256 | Odds Ratio (Random, 95% CI) | 0.33 [0.18, 0.59] |
| 2.2 Resin infiltration versus control/placebo | 2 | 130 | Odds Ratio (Random, 95% CI) | 0.19 [0.08, 0.46] |
| 2.3 Glass ionomer sealant versus control | 1 | 82 | Odds Ratio (Random, 95% CI) | 0.13 [0.01, 2.52] |
| 3 Caries progression follow‐up 18 to 36 months ‐ Pairwise Show forest plot | 4 | 330 | Odds Ratio (Random, 95% CI) | 0.31 [0.18, 0.53] |
| 3.1 Resin sealant versus control | 2 | 218 | Odds Ratio (Random, 95% CI) | 0.31 [0.18, 0.54] |
| 3.2 Resin infiltration versus placebo | 1 | 52 | Odds Ratio (Random, 95% CI) | 0.08 [0.01, 0.63] |
| 3.3 Sealant patch versus control | 1 | 60 | Odds Ratio (Random, 95% CI) | 1.0 [0.14, 7.23] |
| 4 Caries progression follow‐up 12 to 18 months ‐ Digital Substraction Radiography Show forest plot | 3 | 270 | Odds Ratio (Random, 95% CI) | 0.18 [0.06, 0.50] |
| 4.1 Resin sealant versus control | 2 | 218 | Odds Ratio (Random, 95% CI) | 0.23 [0.07, 0.70] |
| 4.2 Resin infiltration versus placebo | 1 | 52 | Odds Ratio (Random, 95% CI) | 0.05 [0.01, 0.45] |