Scolaris Content Display Scolaris Content Display

Study flow diagram
Figuras y tablas -
Figure 1

Study flow diagram

Risk of bias graph: review authors' judgements about each risk of bias item presented as percentages across all included studies
Figuras y tablas -
Figure 2

Risk of bias graph: review authors' judgements about each risk of bias item presented as percentages across all included studies

Risk of bias summary: review authors' judgements about each risk of bias item for each included study
Figuras y tablas -
Figure 3

Risk of bias summary: review authors' judgements about each risk of bias item for each included study

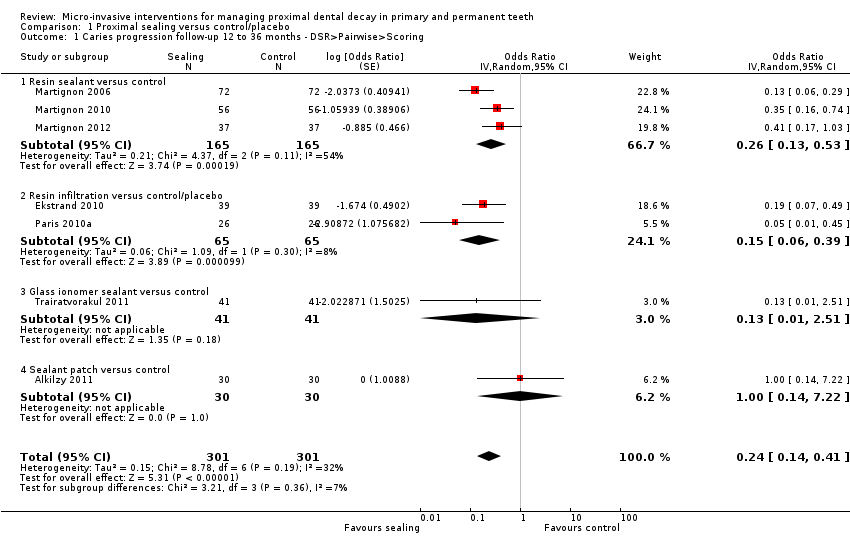
Forest plot of comparison: 1 Proximal sealing versus control/placebo, outcome: 1.1 Caries progression follow‐up 12 to 36 months ‐ DSR>Pairwise>Scoring
Figuras y tablas -
Figure 4

Forest plot of comparison: 1 Proximal sealing versus control/placebo, outcome: 1.1 Caries progression follow‐up 12 to 36 months ‐ DSR>Pairwise>Scoring

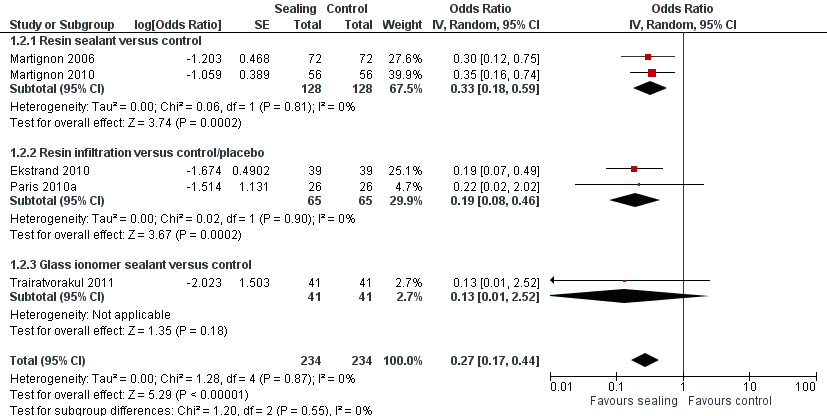
Forest plot of comparison: 1 Proximal sealing versus control/placebo, outcome: 1.2 Caries progression follow‐up 12 to 30 months ‐ Scoring
Figuras y tablas -
Figure 5

Forest plot of comparison: 1 Proximal sealing versus control/placebo, outcome: 1.2 Caries progression follow‐up 12 to 30 months ‐ Scoring

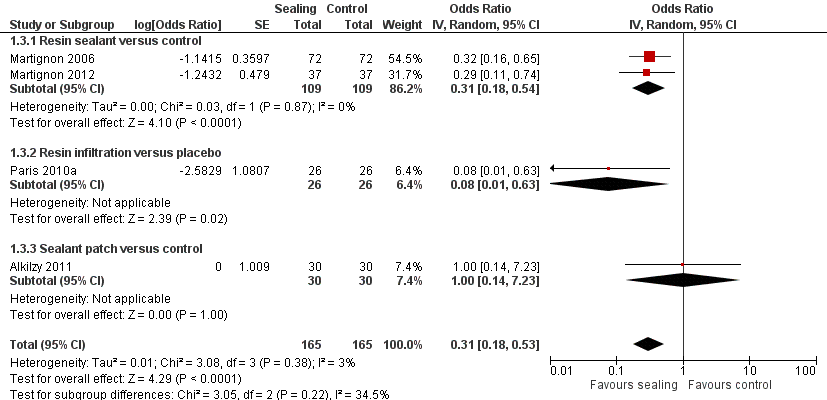
Forest plot of comparison: 1 Proximal sealing versus control/placebo, outcome: 1.2 Pairwise
Figuras y tablas -
Figure 6

Forest plot of comparison: 1 Proximal sealing versus control/placebo, outcome: 1.2 Pairwise

Forest plot of comparison: 1 Proximal sealing versus control/placebo, outcome: 1.4 Caries progression follow‐up 12 to 18 months ‐ Digital Substraction Radiography.
Figuras y tablas -
Figure 7

Forest plot of comparison: 1 Proximal sealing versus control/placebo, outcome: 1.4 Caries progression follow‐up 12 to 18 months ‐ Digital Substraction Radiography.

Comparison 1 Proximal sealing versus control/placebo, Outcome 1 Caries progression follow‐up 12 to 36 months ‐ DSR>Pairwise>Scoring.
Figuras y tablas -
Analysis 1.1

Comparison 1 Proximal sealing versus control/placebo, Outcome 1 Caries progression follow‐up 12 to 36 months ‐ DSR>Pairwise>Scoring.

Comparison 1 Proximal sealing versus control/placebo, Outcome 2 Caries progression follow‐up 12 to 30 months ‐ Scoring.
Figuras y tablas -
Analysis 1.2

Comparison 1 Proximal sealing versus control/placebo, Outcome 2 Caries progression follow‐up 12 to 30 months ‐ Scoring.

Comparison 1 Proximal sealing versus control/placebo, Outcome 3 Caries progression follow‐up 18 to 36 months ‐ Pairwise.
Figuras y tablas -
Analysis 1.3

Comparison 1 Proximal sealing versus control/placebo, Outcome 3 Caries progression follow‐up 18 to 36 months ‐ Pairwise.

Comparison 1 Proximal sealing versus control/placebo, Outcome 4 Caries progression follow‐up 12 to 18 months ‐ Digital Substraction Radiography.
Figuras y tablas -
Analysis 1.4

Comparison 1 Proximal sealing versus control/placebo, Outcome 4 Caries progression follow‐up 12 to 18 months ‐ Digital Substraction Radiography.

Summary of findings for the main comparison. Micro‐invasive versus non‐invasive treatments for managing dental decay in primary and permanent teeth

Micro‐invasive versus non‐invasive treatments for managing dental decay in primary and permanent teeth

Patient or population: people with dental decay on proximal surfaces of primary and permanent teeth
Settings: secondary care setting
Intervention: different micro‐invasive methods (e.g. resin infiltration, resin sealant, sealant patch and glass ionomer)

Comparison: non‐invasive treatments (e.g. fluoride varnish, advice to floss)

Radiographic follow‐up period: 6 months to 3 years

Outcomes

Anticipated absolute effects* (95% CI)

Odds Ratio
(95% CI)

№ of participants
(studies)

Quality of the evidence
(GRADE)

Comments

Risk with control

Risk with Sealing

Caries progression measured by DSR > pairwise > visual scoring

(12 months to 36 months follow‐up)

Study population

OR 0.24
(0.14 to 0.41)

602 (7 RCTs)

⊕⊕⊕⊝
Moderatea,b,c

The quality of evidence for caries progression measured by scoring (12 to 30 months), including 468 participants (5 RCTs), OR 0.27 (95% CI 0.17 to 0.44), was moderatea,b,c.

The quality of evidence for caries progression measured by pairwise (18 to 36 months), including 330 participants (4 RCTs), OR 0.31 (95% CI 0.18 to 0.53), was moderatea,b,c.

The quality of evidence for caries progression measured by digital substraction radiography (12 months to 18 months), including 270 participants (3 RCTs), OR 0.18 (95% CI 0.06 to 0.50), was moderatea,b,c.

547 per 1000

284 per 1000
(230 to 361)

Moderate

649 per 1000

337 per 1000
(272 to 428)

Change in decayed, missing and filled (DMF/dmf) figures at surface, tooth and whole mouth level.

No studies reported on caries measured as change in decayed, missing and filled (DMF/dmf) figures at surface, tooth or whole mouth level

*The risk in the intervention group (and its 95% confidence interval) is based on the assumed risk in the comparison group and the relative effect of the intervention (and its 95% CI).
CI: confidence interval; RR: risk ratio; OR: odds ratio.

GRADE Working Group grades of evidence
High quality: We are very confident that the true effect lies close to that of the estimate of the effect
Moderate quality: We are moderately confident in the effect estimate: the true effect is likely to be close to the estimate of the effect, but there is a possibility that it is substantially different
Low quality: Our confidence in the effect estimate is limited: the true effect may be substantially different from the estimate of the effect
Very low quality: We have very little confidence in the effect estimate: the true effect is likely to be substantially different from the estimate of effect

aOne or more studies lacked sufficient blinding of participants, personnel or both. Downgraded one level.
bLow number of events. Downgraded one level.
cOR < 0.5. Upgraded one level.

Figuras y tablas -
Summary of findings for the main comparison. Micro‐invasive versus non‐invasive treatments for managing dental decay in primary and permanent teeth
Comparison 1. Proximal sealing versus control/placebo

Outcome or subgroup title

No. of studies

No. of participants

Statistical method

Effect size

1 Caries progression follow‐up 12 to 36 months ‐ DSR>Pairwise>Scoring Show forest plot

7

602

Odds Ratio (Random, 95% CI)

0.24 [0.14, 0.41]

1.1 Resin sealant versus control

3

330

Odds Ratio (Random, 95% CI)

0.26 [0.13, 0.53]

1.2 Resin infiltration versus control/placebo

2

130

Odds Ratio (Random, 95% CI)

0.15 [0.06, 0.39]

1.3 Glass ionomer sealant versus control

1

82

Odds Ratio (Random, 95% CI)

0.13 [0.01, 2.51]

1.4 Sealant patch versus control

1

60

Odds Ratio (Random, 95% CI)

1.0 [0.14, 7.22]

2 Caries progression follow‐up 12 to 30 months ‐ Scoring Show forest plot

5

468

Odds Ratio (Random, 95% CI)

0.27 [0.17, 0.44]

2.1 Resin sealant versus control

2

256

Odds Ratio (Random, 95% CI)

0.33 [0.18, 0.59]

2.2 Resin infiltration versus control/placebo

2

130

Odds Ratio (Random, 95% CI)

0.19 [0.08, 0.46]

2.3 Glass ionomer sealant versus control

1

82

Odds Ratio (Random, 95% CI)

0.13 [0.01, 2.52]

3 Caries progression follow‐up 18 to 36 months ‐ Pairwise Show forest plot

4

330

Odds Ratio (Random, 95% CI)

0.31 [0.18, 0.53]

3.1 Resin sealant versus control

2

218

Odds Ratio (Random, 95% CI)

0.31 [0.18, 0.54]

3.2 Resin infiltration versus placebo

1

52

Odds Ratio (Random, 95% CI)

0.08 [0.01, 0.63]

3.3 Sealant patch versus control

1

60

Odds Ratio (Random, 95% CI)

1.0 [0.14, 7.23]

4 Caries progression follow‐up 12 to 18 months ‐ Digital Substraction Radiography Show forest plot

3

270

Odds Ratio (Random, 95% CI)

0.18 [0.06, 0.50]

4.1 Resin sealant versus control

2

218

Odds Ratio (Random, 95% CI)

0.23 [0.07, 0.70]

4.2 Resin infiltration versus placebo

1

52

Odds Ratio (Random, 95% CI)

0.05 [0.01, 0.45]

Figuras y tablas -
Comparison 1. Proximal sealing versus control/placebo