Quimioterapia adyuvante después de quimiorradiación concurrente para el cáncer de cuello de útero localmente avanzado
Resumen
Antecedentes
El tratamiento estándar actual para las pacientes con cáncer de cuello de útero con un estadio de la enfermedad localmente avanzado (estadio IIB a IVA de la Federación Internacional de Ginecología y Obstetricia [FIGO]) es el tratamiento con quimiorradiación concurrente (TQRC). Sin embargo, menos de dos tercios de las pacientes en este grupo sobrevive más de cinco años después del tratamiento. La quimioterapia coadyuvante (QTC) se puede administrar en un intento de mejorar la supervivencia al erradicar la enfermedad residual en la pelvis y tratar las enfermedades ocultas fuera del campo de radiación pelviana. Sin embargo, se han observado incongruencias en el diseño de los ensayos, los criterios de inclusión de las participantes, las intervenciones y el efecto beneficioso sobre la supervivencia entre los ensayos de QTC después de TQRC para el cáncer de cuello de útero localmente avanzado (CCLA).
Objetivos
Evaluar el efecto de la quimioterapia coadyuvante (QTC) después de quimiorradiación concurrente (TQRC) sobre la supervivencia de las pacientes con cáncer de cuello de útero localmente avanzado en comparación con TQRC solo.
Métodos de búsqueda
Se hicieron búsquedas en el registro de ensayos del Grupo de Revisión Cochrane de Cáncer Ginecológico (Cochrane Gynaecological Cancer Review Group), el Registro Cochrane Central de Ensayos Controlados (Cochrane Central Register of Controlled Trials) (CENTRAL), MEDLINE, EMBASE y en actas de congresos hasta marzo de 2014. Se realizaron búsquedas manuales en las listas de referencias de los estudios relevantes.
Criterios de selección
Se incluyeron los ensayos controlados aleatorios (ECA) que compararon TQRC solo versus TQRC más QTC. Las pacientes diagnosticadas con cáncer de cuello de útero en estadio FIGO IIB a IVA con una histopatología de carcinoma escamocelular, carcinoma adenoescamocelular, adenocarcinoma o carcinoma indiferenciado.
Obtención y análisis de los datos
Dos revisores (ST, KK) seleccionaron los ensayos relevantes, extrajeron los datos, evaluaron el riesgo de sesgo de forma independiente, compararon los resultados y los desacuerdos se resolvieron mediante discusión.
Resultados principales
Se identificaron dos ECA con 978 pacientes con cáncer de cuello de útero en estadio IIB a IVA. Debido a que los ensayos fueron significativamente diferentes desde el punto de vista clínico no se realizó un metanálisis. Un ensayo patrocinado por la industria que incluyó a 515 pacientes comparó TQRC (cisplatino) versus TQRC (cisplatino y gemcitabina) más QTC (dos ciclos adicionales). Este ensayo informó una mejoría significativa en la supervivencia sin progresión (SSP) y la supervivencia general (SG) en las pacientes que recibieron TQRC más QTC en comparación con las tratadas con TQRC solo: La SSP a los tres años fue del 74,4% versus el 65,0% (cociente de riesgos instantáneos [CRI] 0,68; intervalo de confianza [IC] del 95%: 0,49 a 0,95; valor de p = 0,027) y la SG a los tres años fue del 80% versus el 69% (CRI 0,68; IC del 95%: 0,49 a 0,95; valor de p = 0,022). Sin embargo, como la quimioterapia con TQRC difirió entre los dos brazos se consideró que los resultados tenían alto riesgo de sesgo.
El segundo ensayo fue un estudio de cuatro brazos del que se extrajeron los datos de 463 pacientes de dos brazos de estudio que recibieron TQRC (mitomicina C intravenosa y 5‐fluorouracilo oral [5‐FU]) o TQRC más QTC (5‐FU oral por tres ciclos). El CRI para la SG de las pacientes que recibieron QTC después del TQRC en comparación con el CRI para la SG de las que recibieron solo TQRC fue 1,309 (IC del 95%: 0,795 a 2,157) y el CRI para la supervivencia libre de enfermedad (SLE) fue 1,125 (IC del 95%: 0,799 a 1,586).
Los eventos adversos hematológicos fueron más frecuentes en los brazos de QTC de ambos ensayos. Ningún ensayo informó sobre la calidad de vida (CdV).
Conclusiones de los autores
A partir de los datos limitados de solamente dos ensayos no se encontraron pruebas suficientes para apoyar la administración de QTC después del TQRC. Se requieren ensayos futuros grandes para demostrar la eficacia, los efectos tóxicos y la CdV.
PICO
Resumen en términos sencillos
¿Puede la quimioterapia adicional proporcionada después del tratamiento inicial del cáncer de cuello de útero en estadio localmente avanzado reducir la recidiva y prolongar la vida?
El problema
El tratamiento estándar para el cáncer de cuello de útero en estadio localmente avanzado (estadio IIB a IVA) es la "quimiorradiación concurrente", donde los fármacos anticancerosos se administran durante el mismo período de tratamiento de la radioterapia pelviana (radioterapia del abdomen inferior). Sin embargo, el tumor puede permanecer (cáncer residual) o puede volver (cáncer recidivante) después de este tratamiento estándar. Esta revisión evaluó si administrar fármacos anticancerosos adicionales (QTC) después del tratamiento estándar podría ayudar a las pacientes con cáncer de cuello de útero localmente avanzado a vivir más tiempo en comparación con el tratamiento estándar solo.
Cómo se realizó la revisión
Se buscó en la bibliografía hasta marzo de 2014 y se identificaron dos ensayos controlados aleatorios que compararon tratamiento estándar versus tratamiento estándar más QTC en pacientes con cáncer de cuello de útero localmente avanzado. Dos revisores evaluaron estos estudios y recopilaron los datos de forma independiente.
Hallazgos
Los dos estudios fueron muy diferentes; por lo tanto, no se pudieron agrupar sus datos. Un ensayo realizado internacionalmente entre 2002 y 2004 que incluyó 515 pacientes encontró que el cáncer tardó más en regresar en las pacientes que recibieron QTC (cisplatino y gemcitabina) y más pacientes del grupo de QTC estaban vivas después de tres años que en el grupo de tratamiento estándar (80% versus 69%). Se consideró que los resultados tuvieron alto riesgo de sesgo en este ensayo ya que a las pacientes se les administraron diferentes fármacos durante el tratamiento estándar, por lo que el efecto general del tratamiento de estudio no podía atribuirse a la QTC sola. El otro ensayo que fue realizado en varios hospitales en Tailandia entre 1988 y 1994 incluyó a 463 pacientes. La QTC (5‐fluorouracilo) no mejoró la duración de la supervivencia ni el tiempo tomado para que el cáncer regresara en las pacientes de este ensayo. En los brazos de QTC de ambos estudios se informó una tendencia hacia el aumento de los efectos secundarios.
Conclusiones
No se encontraron pruebas suficientes para apoyar la administración de fármacos anticancerosos adicionales a las pacientes que han recibido tratamiento estándar para el cáncer de cuello de útero localmente avanzado, ya que actualmente solamente se dispone de datos limitados de dos ensayos muy diferentes.
Authors' conclusions
Background
Description of the condition
Worldwide, cervical cancer is the fourth most common cancer in women, with an estimated 528,000 new cases and 266,000 deaths in 2012 (Ferlay 2013). Most cervical cancer cases (84%, or 445,000 cases) and deaths (87%, or 230,000 cases) occurred in less developed regions (Ferlay 2013). In addition to a higher incidence of cervical cancer in less developed regions, patients in these areas have a higher proportion of locally advanced stages, including stage IIB to IVA of the International Federation of Gynecology and Obstetrics (FIGO) staging classification, or advanced stage IVB cancers (Moore 2010). This is due in part to lack of co‐ordinated screening programmes and/or lack of access to radiotherapy, leading to poorer overall survival. Thus, seeking further means of improving treatment outcomes for advanced or locally advanced cervical cancer (LACC) is required.
Description of the intervention
Concurrent chemoradiation therapy (CCRT) is a type of treatment in which chemotherapy is given at the same time as radiation therapy. Chemotherapy serves as a radiosensitiser that enhances the activity of radiation, and as a direct cytotoxin to local tumour cells and subclinical distant metastases beyond the radiation area (Rose 2002). It is currently a standard treatment for patients with LACC. This combined treatment appeared to improve survival outcomes compared with radiation therapy alone (Green 2005), with overall survival rates ranging from 60% to 65% (Cochrane Meta‐Analysis Collaboration 2008). However, local and distant failures (17% and 18%, respectively) of LACC after CCRT were still encountered (Eifel 2004). Interventions provided to improve treatment outcomes include chemotherapy administered before CCRT (neoadjuvant chemotherapy) (McCormack 2013 (a); McCormack 2013 (b); Singh 2013) and additional chemotherapy given after the standard treatment, which is referred to as 'consolidation chemotherapy' or 'adjuvant chemotherapy' (ACT) (Choi 2007; Dueñas‐González 2011; Lorvidhaya 2003; Tang 2012; Vrdoljak 2005; Vrdoljak 2006; Zhang 2010).
How the intervention might work
The objective of adjuvant chemotherapy after completion of radiation therapy, or CCRT, is to eradicate tumour cells outside of the radiation field. The role of ACT has been explored in several studies or trials involving LACC (Choi 2007; Choi 2010; Domingo 2009; Dueñas‐González 2011; Lorvidhaya 2003; Tang 2012; Vrdoljak 2006; Wong 1999; Zhang 2010). All single‐arm phase II studies (Choi 2007; Domingo 2009; Vrdoljak 2006; Zhang 2010) that evaluated the role of ACT in LACC reported a higher response rate than those that evaluated the role of CCRT alone. Overall survival rates greater than 80% to 90% achieved with CCRT followed by ACT were higher than the 60% to 65% rates obtained with CCRT alone (Cochrane Meta‐Analysis Collaboration 2008).
Why it is important to do this review
Concurrent chemoradiation therapy (CCRT) is the current standard treatment for locally advanced cervical cancer (LACC); however, it can yield only a 60% to 65% survival rate (Cochrane Meta‐Analysis Collaboration 2008). Adjuvant chemotherapy after CCRT is therefore one possible way to extend the survival of patients with LACC because it may further reduce or eradicate any residual disease, including occult disease outside the pelvic radiation field. Although the survival benefit derived from ACT after CCRT has been demonstrated in some studies, evidence is limited. Furthermore, each study has specific characteristics vis‐à‐vis the population included and the different types of chemotherapy regimen given, especially between two study arms in the same trial. Without clear benefit of ACT after CCRT, no definitive recommendation or clinical practice guideline can be provided for its use. As chemotherapy can cause toxicities, potential survival advantages must outweigh these disadvantages, hence a systematic review to evaluate the efficacy and toxicity of this treatment option is warranted.
Objectives
To evaluate the effect of adjuvant chemotherapy (ACT) after concurrent chemoradiation (CCRT) on survival of women with locally advanced cervical cancer compared with CCRT alone.
Methods
Criteria for considering studies for this review
Types of studies
Randomised controlled trials (RCTs).
Types of participants
Women ≥ 18 years of age with a diagnosis of cervical cancer, FIGO stage IIB to IVA, and a histopathology of squamous cell carcinoma, adenosquamous cell carcinoma, adenocarcinoma or undifferentiated carcinoma. All patients had concurrent chemoradiation (CCRT) before receiving adjuvant chemotherapy (ACT).
Types of interventions
-
Intervention: adjuvant or additional chemotherapy (ACT) given after standard treatment of chemotherapy and radiation during the same period (CCRT).
-
Comparator: standard treatment with CCRT, then no further treatment.
Types of outcome measures
Primary outcomes
-
Overall survival, analysed from date of randomisation until death or the participant's last visit.
-
Progression‐free survival analysed from date of randomisation until appearance of a new lesion during treatment, or a greater than 20% or 25% increase in local tumour size by RECIST (Response Evaluation Criteria In Solid Tumors) (Eisenhauer 2009) or WHO (World Health Organization) (Miller 1981) criteria, respectively.
Secondary outcomes
-
Response rates after completion of CCRT, and after ACT.
-
Recurrence rate after treatment with CCRT, and after ACT.
-
Quality of life, measured using a scale that has been validated through reporting of norms in a peer‐reviewed publication.
-
Severe toxicities and adverse events in study arm versus control arm, classified according to CTCAE 2006.
Grades of toxicity were grouped as:
-
haematological (leucopenia, anaemia, thrombocytopenia, neutropenia, haemorrhage);
-
gastrointestinal (nausea, vomiting, anorexia, diarrhoea, liver, proctitis);
-
genitourinary;
-
skin (stomatitis, mucositis, alopecia, allergy);
-
neurological (peripheral and central); or
-
pulmonary.
Search methods for identification of studies
We searched for papers without restriction of languages and arranged translation as necessary.
Electronic searches
We searched the following electronic databases.
-
Cochrane Central Register of Controlled Trials (CENTRAL) (2014, Issue 1) (Appendix 1).
-
MEDLINE to March 2014 (Appendix 2).
-
EMBASE to March 2014 (Appendix 3).
We identified all relevant articles on PubMed using the 'related articles' feature and performed further searches for other published articles.
Searching other resources
Unpublished and grey literature
We searched the following for ongoing trials.
-
metaRegister of Controlled Trials (mRCT) (http://www.controlled‐trials.com/mrct/).
-
Physicians Data Query (http://www.cancer.gov/cancertopics/pdq/cancerdatabase).
-
ClinicalTrials.gov (http://clinicaltrials.gov/).
-
National Cancer Institute (http://www.cancer.gov/clinicaltrials).
-
World Health Organization (WHO) International Clinical Trials Registry Platform (ICTRP) search portal (http://apps.who.int/trialsearch/).
We identified ongoing trials with published information on study design and inclusion and exclusion criteria (Mileshkin 2010; Tangjitgamol 2014). We found that recruitment for both trials is ongoing.
We searched electronic databases such as Zetoc (http://zetoc.mimas.ac.uk/) and Ohio College Library Center (OCLC) WorldCat Dissertations and Theses (WorldCatDissertations) (http://www.oclc.org/support/documentation/firstsearch/databases/dbdetails/details/worldcatdissertations.htm) for conference proceedings and abstracts.
Handsearching
We handsearched the citation lists of included studies and key textbooks and contacted experts in the field to identify further reports of trials. We also handsearched the following sources for previous systematic reviews and reports of conferences.
-
Gynecologic Oncology (Annual Meeting of the American Society of Gynecologic Oncologists).
-
International Journal of Gynecological Cancer (Biannual Meeting of the International Gynecologic Cancer Society and Biannual Meeting of the European Society of Gynaecologic Oncology).
-
British Journal of Cancer.
-
British Cancer Research Meeting.
-
Annual Meeting of European Society of Medical Oncology.
-
Annual Meeting of the American Society of Clinical Oncology.
Data collection and analysis
Selection of studies
Two review authors (ST, KK) independently examined search results and obtained and excluded records that clearly did not meet our inclusion criteria. We obtained copies of the full text of potentially relevant references. The two review authors (ST, KK) independently assessed eligibility of the retrieved full‐text articles. Disagreements were resolved by discussion between the two review authors and by consultation with a third review author (PL). Reasons for exclusion were documented.
Data extraction and management
Two review authors (ST, KK) extracted data independently using a data abstraction form specially designed for the review. The two review authors resolved differences by discussion or by appeal to a third review author (PL) when necessary. For included studies, the following data were extracted.
-
Author, year of publication and journal citation (including language).
-
Country.
-
Setting.
-
Inclusion and exclusion criteria.
-
Study design, methodology.
-
Study population (total number enrolled; participant characteristics; participant age; co‐morbidities; other baseline characteristics).
-
Intervention details (CCRT—regimen, dosage, cycles of treatment; radiation therapy—radiation therapy technique (external pelvic radiation therapy, extended field radiation therapy, brachytherapy), radiation machine or instrument (cobalt, linear accelerator), type of brachytherapy (low‐dose or high‐dose rate), doses; ACT—regimen, dosage, cycles of treatment).
-
Comparison (primary and secondary outcomes between the two arms).
-
Risk of bias in the study (Assessment of risk of bias in included studies).
-
Duration of follow‐up.
-
Outcomes (outcome definition and unit of measurement (if relevant); for adjusted estimates, we recorded variables adjusted for during analyses).
-
Results (number of participants allocated to each intervention group, total number analysed for each outcome, missing participants).
Data on all participants in the groups to which they were originally randomly assigned (intention‐to‐treat) were extracted. We noted the time points at which outcomes were collected and reported. Results were extracted as follows.
-
Time‐to‐event data (survival and disease progression): We estimated the log of hazard ratio using the methods of Parmar 1998.
-
Dichotomous outcomes (e.g. adverse events or deaths): We extracted the number of participants in each treatment arm who experienced the outcome of interest and the number of participants assessed at endpoint, to estimate the risk ratio.
-
Continuous outcomes (e.g. quality of life measures): No data were available.
Assessment of risk of bias in included studies
Risk of bias in included trials was assessed using the tool of The Cochrane Collaboration for assessing risk of bias (Higgins 2011; Appendix 4).
-
Selection bias (random sequence generation and allocation concealment).
-
Performance bias (not applicable because clinicians were aware of interventions).
-
Detection bias (blinding of outcome assessment).
-
Attrition bias (high rates of incomplete outcome data and trials with ≥ 20% missing data were assessed as having high risk of bias).
-
Reporting bias (selective reporting of outcomes).
Two review authors (ST, KK) applied the risk of bias tool independently; differences were resolved by discussion or by appeal to the third and fifth review authors (PL, ML). We summarised results in both a risk of bias graph and a risk of bias summary. Results of meta‐analyses were interpreted in light of the findings with respect to risk of bias.
Measures of treatment effect
We planned to pool the results of included studies in meta‐analyses if adequate numbers of clinically similar studies were available. We would use the following measures of the effects of treatment.
-
Dichotomous outcomes: Risk ratio (RR) and 95% confidence interval (CI) were calculated for each trial.
-
Time‐to‐event data: Hazard ratio (HR) and 95% CI were calculated for each study.
Dealing with missing data
We did not impute missing outcome data.
Assessment of heterogeneity
We planned to assess heterogeneity between studies by visual inspection of forest plots, by estimation of the percentage of inconsistency between trials that could not be ascribed to sampling variation (Higgins 2003) and by a formal statistical test of the significance of the heterogeneity (Deeks 2001).
Assessment of reporting biases
We intended to examine funnel plots corresponding to meta‐analyses of the primary outcome to assess the potential for small‐study effects such as publication bias if a sufficient number of studies (i.e. more than 10) were identified.
Data synthesis
We intended that if sufficient clinically similar studies were available, we would conduct meta‐analyses using the Cochrane Collaboration's statistical software (Review Manager 2012) using a fixed‐effect model. If data were statistically or clinically heterogeneous, we planned to use the random‐effects model with inverse variance weighting (DerSimonian 1986).
Subgroup analysis and investigation of heterogeneity
To investigate heterogeneity of the primary outcomes, we planned to perform subgroup analyses with trials grouped by:
-
type of chemotherapeutic regimen (platinum versus non–platinum‐based);
-
stage of disease (stage IIB versus stage III to IVA);
-
radiation therapy technique (external pelvic radiation therapy, radiation machine (cobalt or linear accelerator), brachytherapy, extended field radiation therapy); and
-
histopathology (squamous cell carcinoma versus others).
Factors such as age, stage, type of intervention, length of follow‐up and risk of bias status in interpretation of any heterogeneity would be considered.
Sensitivity analysis
We would perform sensitivity analyses by excluding studies at high risk of bias.
Results
Description of studies
See Characteristics of included studies and Characteristics of excluded studies.
Results of the search
A MEDLINE search identified 598 studies. A similar search of EMBASE, the Cochrane Central Register of Controlled Trials (CENTRAL) and the Specialised Register revealed 941 studies, 263 studies and 253 studies, respectively. Reference lists were checked, and handsearching of journals and congress abstracts yielded five additional studies.
A total of 74 articles were selected from the first sift. After 18 duplicates and 39 other abstracts were removed, 17 possibly eligible studies were retrieved for more detailed analysis. We found eight RCTs (Chiara 1994; Dueñas‐González 2011; Kantardzic 2004; Lorvidhaya 2003; Tang 2012; Vishnevskaia 1999; Wang 2010; Wong 1999). Two RCTs met the inclusion criteria and were included in this review (Dueñas‐González 2011; Lorvidhaya 2003). One study (Dueñas‐González 2011) subsequently reported a subgroup analysis to determine prognostic factors for participants (Dueñas‐González 2012). Six trials were excluded for one or more of the following reasons: Neoadjuvant chemotherapy was given as well as adjuvant chemotherapy (Chiara 1994; Tang 2012; Vishnevskaia 1999); only radiation was used in either of the control arms (Kantardzic 2004; Vishnevskaia 1999; Wang 2010; Wong 1999) or in both arms (Chiara 1994).
The eight remaining non‐randomised studies were excluded for the following reasons: only radiation provided or phase II studies without a comparative arm (Choi 2007; Domingo 2009; Kim 2012; Mahasittiwat 2011; McCaffrey 2011; Vrdoljak 2006); prospective matched case comparison without randomisation (Choi 2010); or a preliminary report of one study (Vrdoljak 2005). See QUOROM (Quality of Reporting of Meta‐analyses) statement flow diagram (Figure 1).

Study flow diagram.
Included studies
We found three reports from two RCTs (Dueñas‐González 2011; Lorvidhaya 2003). Dueñas‐González 2011 described the results of their subgroup analysis in a subsequent report (Dueñas‐González 2012), details of which are provided in the Characteristics of included studies.
Design and setting
Two RCTs were included. One (Lorvidhaya 2003) was undertaken in Thailand as a multi‐centre trial between January 1988 and November 1994. The other (Dueñas‐González 2011) was conducted in Argentina, Bosnia and Herzegovina, India, Mexico, Pakistan, Panama, Peru and Thailand between May 2002 and March 2004.
Participants
Two trials included a total of 978 participants with stage IIB to IVA cervical cancer.
Lorvidhaya 2003 included in the study 926 women with a performance status 2 or less, according to the Eastern Cooperative Oncology Group. The histopathology had to be squamous cell carcinoma, adenocarcinoma or adenosquamous cell carcinoma. For women with stage IIB disease, the central tumour had to be larger than 3 cm and/or had to involve more than half of the parametrium.
Dueñas‐González 2011 included 515 women with cervical cancer who had Karnofsky performance score ≥ 70. Tumours of squamous cell carcinoma, adenocarcinoma, adeno/squamous carcinoma and poorly differentiated carcinoma were included. Women with enlarged para‐aortic lymph node > 1 cm, proven by fine‐needle aspiration to have metastatic cancer, were excluded.
Intervention
The Lordvithaya trial (Lorvidhaya 2003), which aimed mainly to study the efficacy of CCRT and the role of ACT, randomly assigned participants with LACC to four treatment arms. The standard arm received only radiation therapy (RT) (arm 1, n = 242), while the three study arms received RT with ACT (arm 2, n = 221) and CCRT without (arm 3, n = 233) or with ACT (arm 4, n = 230). Radiation was given with Co‐60 or a linear accelerator machine. The external beam pelvic radiation (EBRT) dose was 40 to 50 Gy given to whole pelvis and pelvic lymph node. Intracavitary radiation was given according to the practice in each participating centre as four applications of high dose rate or one to two applications of medium dose rate. Chemotherapy given during radiation therapy consisted of intravenous mitomycin C plus oral 5‐FU. The drug used in an adjuvant setting was oral 5‐FU given for three cycles: drug taken for four weeks with a two‐week rest between cycles. Only two arms (CCRT plus ACT versus CCRT alone) were relevant to our review question, therefore only data on the 233 participants given CCRT (arm 3) and the 230 participants receiving CCRT plus ACT (arm 4) were extracted for the review.
The Dueñas‐González trial (Dueñas‐González 2011) randomly assigned participants to two treatment arms. The study arm received CCRT followed by ACT (arm A, n = 259), while the control arm was given only CCRT (arm B, n = 256). Radiation equipment consisted of cobalt‐60 (Co‐60) or a linear accelerator. The EBRT dose was 50.4 Gy, and a low or intermediate dose rate of brachytherapy was given immediately after chemoradiation. Chemotherapy used concurrently with RT included six cycles of intravenous weekly cisplatin plus gemcitabine in the study arm and only cisplatin in the control arm. Two weeks after completion of brachytherapy, participants in the study arm received two additional cycles of tri‐weekly cisplatin plus gemcitabine.
Compliance and follow‐up
In Lorvidhaya 2003, 13 participants with small cell carcinoma (six in the CCRT group and seven in the CCRT plus ACT group; approximately 3% both) were excluded from the analysis. After a median follow‐up of 89 months, 12 (5%) and 19 (8%) of the participants in both arms were lost to follow‐up and received incomplete treatment. Reasons were not specified. These participants were censored as having failure of treatment. No information was provided on the compliance of participants taking oral chemotherapy.
In Dueñas‐González 2011, the median follow‐up was 46.9 months. The numbers of participants who discontinued treatment were 42 in arm A (CCRT plus ACT) and 11 in arm B (CCRT alone) (P value < 0.001), most commonly as the result of adverse effects. In the CCRT phase, the median number of gemcitabine and cisplatin cycles received in arm A was five (range one to six cycles), and the median number of cycles of cisplatin administered in arm B was six (range one to six cycles). In the ACT phase of arm A, 86.2% of participants received at least one cycle, and 76.5% received both cycles of ACT. Although median radiation doses were similar in the two treatment arms, the period of RT was longer in arm A: 49 days versus 45 days (P value < 0.001).
Outcomes
Lorvidhaya 2003 reported overall survival and progression‐free survival (PFS). Dueñas‐González 2011 reported overall survival, disease‐free survival (DFS) and adverse events.
Excluded studies
Of 17 possibly eligible studies, 14 were excluded: six were RCTs, and eight were phase II prospective trials.
Six RCTS were excluded for one or more of the following reasons: neoadjuvant chemotherapy was also given aside from ACT (Chiara 1994; Tang 2012; Vishnevskaia 1999); only radiation was used in either the control arm (Kantardzic 2004; Vishnevskaia 1999; Wang 2010; Wong 1999) or both arms (Chiara 1994).
Of the eight remaining non‐randomised studies, all were excluded for the following reasons: providing radiation only, phase II studies without a comparative arm (Choi 2007; Domingo 2009; Kim 2012; Mahasittiwat 2011; McCaffrey 2011; Vrdoljak 2006), prospective matched case comparison without randomisation (Choi 2010) or a preliminary report of one study (Vrdoljak 2005).
Risk of bias in included studies
Allocation
In Lorvidhaya 2003, randomisation was stratified according to each individual centre among the six centres joining in the trial. No information was provided regarding the method and the centre or site responsible for randomisation as well as allocation concealment. We assessed this as unclear risk.
In Dueñas‐González 2011, participants were randomly assigned to CCRT plus ACT or CCRT alone at week 0 according to the Pocock and Simon algorithm by disease stage (IIB versus III to IVA), tumour diameter (< versus ≥ 5 cm), investigational centre, radiation equipment (cobalt‐60 versus linear accelerator) and age (< versus ≥ 55 years). The random allocation sequence was generated by central telephone of the pharmaceutical company providing the research funding (Eli Lilly, Indianapolis, IN, USA). Allocation was concealed until interventions were assigned. This has been deemed to show low risk of bias.
Blinding
No blinding during treatment was reported in either trial (Dueñas‐González 2011; Lorvidhaya 2003). This is believed to show high risk of bias.
Incomplete outcome data
After randomisation, Lorvidhaya 2003 identified six participants in the CCRT group and seven in the CCRT plus ACT group (approximately 3% both) who had small cell carcinoma and were excluded from the analysis. After a median follow‐up of 89 months, 31 participants in both arms (12% or 5% in the CCRT group and 19% or 8% in the CCRT plus ACT group) were lost to follow‐up and received incomplete treatment. Reasons were not specified. Participants were censored as having failure of treatment.
Among the 515 participants who were randomly assigned in Dueñas‐González 2011, one who was allocated to CCRT was given both CCRT and adjuvant chemotherapy. A total of 53 participants (approximately 10%) discontinued treatment. After a median follow‐up period of 46.9 months, a total of 56 participants (approximately 11%) were lost to follow‐up by the end of the study. Numbers and reasons for loss to follow‐up were similar in the two treatment arms.
We determined both trials as having low risk of bias.
Selective reporting
All outcomes in Lorvidhaya 2003 were reported according to the protocol. Nevertheless, no information was provided on the timing of adverse events.
Alhough the primary endpoint in Dueñas‐González 2011 was changed from OS to PFS after completion of enrolment, all outcomes specified in the protocol were reported. Survival analyses were performed by an intention‐to‐treat approach (including the one participant who had a treatment cross‐over), and toxicities were analysed for safety according to the actual treatment received.
We determined that both trials had low risk of bias.
Other potential sources of bias
No imbalance in baseline characteristics between the two arms was reported in either of the two studies (Dueñas‐González 2011; Lorvidhaya 2003). However, an important difference in CCRT treatment between groups was found in one study (Dueñas‐González 2011). The control arm received only single‐agent chemotherapy (cisplatin), and the study arm was given two drugs (cisplatin and gemcitabine) during CCRT. We determined this to show high risk of bias, as it is likely to have had a significant effect on the outcomes.
Effects of interventions
We were unable to pool data because one of the included trials (Dueñas‐González 2011) used different interventions during CCRT between the two arms (study arm received a combination of gemcitabine and cisplatin; control arm received cisplatin alone). In addition, different types of ACT were used in the two included studies; one trial used 5‐fluorouracil (5‐FU) (Lorvidhaya 2003), and the other (Dueñas‐González 2011) used a combination of gemcitabine and cisplatin.
Survival
Lorvidhaya 2003 found no benefit for ACT over CCRT alone. Using the Parmar method to estimate hazard ratio, we found that the HR for OS was 1.309 (95% confidence interval (CI) 0.795 to 2.157) and for DFS was 1.125 (95% CI 0.799 to 1.586) among participants who received adjuvant chemotherapy (ACT).
Dueñas‐González 2011 showed significant improvement in PFS and OS among those who received CCRT plus ACT compared with those given CCRT alone (HR 0.68, 95% CI 0.49 to 0.95 for PFS, P value 0.027; HR 0.68, 95% CI 0.49 to 0.95 for OS, P value 0.022). The benefit of ACT was demonstrated in all subgroups. Subsequent analyses (Dueñas‐González 2012) showed that benefit from ACT, PFS in particular, was greater in women with more advanced disease, larger tumour size and age younger than 55 years. The hazard ratio of PFS among participants with stage III to IVA disease who were given CCRT and ACT compared with those who received only CCRT was 0.59 (95% CI 0.37 to 0.97, P value 0.036).
Data on survival from both studies are summarised in Additional tables: Table 1.
| Study | Lordvithaya | Dueñas‐Gonzalez |
| N (CCRT versus CCRT/ACT) | 233 versus 230 | 256 versus 259 |
| FU | 89 months | 46.9 months |
| Outcomes (CCRT versus CCRT/ACT) |
|
|
| 1. OS |
|
|
| · 3‐year OS | 85% versus 79% (estimated from graph), P value NS HR 1.309, 95% CI 0.795 to 2.157 (by Parmar method) | 69% versus 78% (estimated from graph) HR 0.68, 95% CI 0.49 to 0.95, P value 0.0224 |
| · 5‐year OS | 82.7% (79.0 to 86.4) versus 73.6 (67.1 to 80.1), P value NS | ‐ |
| 2. PFS |
|
|
| · 3‐year PFS | 68% versus 63% (estimated from graph), P value NS HR 1.125, 95% CI 0.799 to 1.586 (by Parmar method) | 65.0% (58.5 to 70.7) versus 74.4 % (68 to 79.8) HR 0.68, 95% CI 0.49 to 0.95), P value 0.0227 |
| · 5‐year PFS | 64.5% (60.6 to 68.0) versus 59.7% (53.6 to 65.8), P value NS | ‐ |
No meta‐analysis was performed. Data on progression‐free survival for each individual trial are shown in Figure 2 and on overall survival in Figure 3.

Forest plot of comparison: 1 Survival, outcome: 1.1 Progression‐free survival.

Forest plot of comparison: 1 Survival, outcome: 1.2 Overall survival.
Failure after treatment
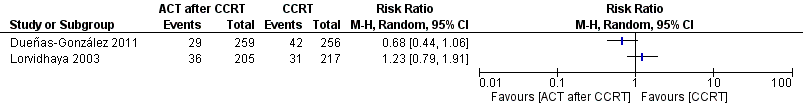
Lorvidhaya 2003 did not demonstrate that the addition of chemotherapy could decrease total failure rate or loco‐regional or distant failure after CCRT. Total failure rates were 29.0% among participants who received CCRT (arm 3), and 31.2% among those given CCRT plus ACT (arm 4). No significant differences in loco‐regional or distant recurrence were noted among participants who were treated with CCRT alone or CCRT plus ACT: 14.3% versus 17.6% (P value not given) for local recurrence, and 17.7% versus 19.5% (P value not given) in arm 3 and arm 4, respectively.
Rates of local failure in Dueñas‐González 2011 were not different (11.2% versus 16.4%, P value 0.097). However, distant failure rate was lower in the ACT group: 8.1% versus 16.4% (P value 0.005). Differences in chemotherapy during CCRT should be noted; it is not possible to determine whether differences were due to ACT given alone.
Data on recurrences from both studies are summarised in Additional tables: Table 2.
| Study | Lordvithaya | Dueñas‐Gonzalez |
| N (CCRT versus CCRT/ ACT) | 233 versus 230 | 256 versus 259 |
| · Local (with or without DR) | 31 (14.3%) versus 36 (17.6%), P value NS | 16.4% versus 11.2%, P value 0.097 |
| · Distant (with or without LR) | 38 (17.7%) versus 40 (19.5%), P value NS | 16.4% versus 8.1%, P value 0.005 |
| · Local and/ or distant | 63 (29.0%) versus 64 (31.2%), P value NS | ‐ |
No meta‐analysis was performed. Data on treatment failure at all sites for each individual trial are shown in Analysis 2.1 (Figure 4), local failure in Analysis 2.2 (Figure 5) and distant failure in Analysis 2.3 (Figure 6).

Forest plot of comparison: 2 Failure after treatment, outcome: 2.1 Total failure after treatment.

Forest plot of comparison: 2 Failure after treatment, outcome: 2.2 Local failure.

Forest plot of comparison: 2 Failure after treatment, outcome: 2.3 Distant failure.
Response rate
Only Dueñas‐González 2011 reported response rates in the two treatment arms. These did not differ (95.8% in the CCRT plus ACT arm versus 93.4% in the CCRT arm, P value 0.249) (Additional tables: Table 3). No information on response rates was available for Lorvidhaya 2003.
| Study | Lordvithaya | Dueñas‐Gonzalez |
| Response rate | NA | 93.4 (89.6 to 96.1) in CCRT arm versus 95.8 (92.5 to 97.9) in CCRT + ACT arm, P value 0.249 |
Adverse events
Lorvidhaya 2003 reported that one participant in the CCRT arm died from persistent thrombocytopenia and leucopenia. Gastrointestinal symptoms were greater in the CCRT arm, but study authors stated that most women tolerated the treatment well (actual numbers not given). Haematological toxicities were not increased by ACT after CCRT. Anaemia of grade 2 was 24.2% among participants given CCRT plus ACT and 20.6% in those treated with only CCRT. Respective grade 3 and 4 leucopenia was 2.9% and 4.1%, and grade 3 and 4 thrombocytopenia was 1.5% and 2.3% (Additional tables: Table 4). No differences in late side effects were observed among studied arms (Additional tables: Table 5).
| Adverse events/Study | Lordvithaya n (%) | Dueñas‐Gonzalez n (%) | ||
| CCRT (N = 218) | CCRT + ACT (N = 211) | CCRT (N = 255) | CCRT + ACT (N = 260) | |
| Acute adverse event (grade 1 to 2) | ||||
| 1. Haematological | ||||
|
| 110 (50.4) | 139 (65.8) | NA | |
|
| 137 (62.8) | 142 (67.3) | 86 (33.8) | 128 (49.3) |
|
| NA | 62 (24.3) | 80 (30.8) | |
|
| NA | 0 | 1 (0.4) | |
|
| 56 (25.7) | 70 (33.5) | 26 (10.2) | 58 (32.4) |
|
| NA | NA | ||
| 2. Gastrointestinal | ||||
|
| NA | 148 (58.0) | 153 (58.8) | |
|
| NA | 116 (45.5) | 129 (49.6) | |
|
| NA | 37 (14.5) | 46 (17.7) | |
|
| NA | 119 (46.7) | 121 (46.5) | |
|
| NA | 6 (1.6) | 33 (12.6) | |
|
| NA | 20 (7.9) | 29 (11.2) | |
| 3. Genitourinary (increased Cr level) | NA | 2 (0.8) | 5 (1.9) | |
| 4. Skin | NA | 40 (15.7) | 45 (17.3) | |
| 5. Neurological | NA | NA | ||
| 6. Pulmonary | NA | NA | ||
| Acute adverse event (grade 3 to 4) | ||||
| 1. Haematological | ||||
|
| 9 (4.1) | 6 (2.9) | NA | |
|
| 0 | 5 (2.0) | 24 (9.2) | |
|
| NA | 15 (5.9) | 133 (51.2) | |
|
| NA | 1 (0.4) | 6 (2.3) | |
|
| 5 (2.3) | 3 (1.5) | 3 (1.2) | 16 (6.2) |
|
| NA | NA | ||
| 2. Gastrointestinal | ||||
|
| NA | 7 (2.7) | 11 (4.2) | |
|
| NA | 7 (2.8) | 20 (7.7) | |
|
| NA | 0 | 1 (0.4) | |
|
| NA | 12 (4.7) | 46 (17.7) | |
|
| NA | 0 | 4 (1.6) | |
|
| NA | 1 (0.4) | 9 (3.5) | |
| 3. Genitourinary (increased Cr level) | NA | 2 (0.8) | 4 (1.5) | |
| 4. Skin | NA | 27 (10.6) | 29 (11.2) | |
| 5. Neurological | NA | NA | ||
| 6. Pulmonary | NA | NA | ||
| Study | Lordvithaya n (%) | Dueñas‐Gonzalez n (%) |
| Late adverse event (grade 3 to 4) | ||
| 1. Bowel | 3.1% vs 5.8% | 1 (0.5) vs 5 (2.3) |
| 2. Bladder | 1 (0.5) vs 3 (1.4) | |
| 3. Mucous membrane | NA | 1 (0.5%) vs 1 (0.5) |
| 4. Subcutaneous | 0 vs 1 (0.5) | |
Dueñas‐González 2011 reported detailed toxicities in both treatment arms. It should be noted that chemotherapy during CCRT differed when added to ACT. More women who had CCRT plus ACT were hospitalised: 30 women versus 11 who had CCRT only (P value 0.003). Women who received CCRT plus ACT also had a greater number of grade 3 or 4 overall toxicities (87.0% vs 46.0%, P value < 0.001). Rates of grade 3 and 4 toxicities in women who received CCRT and ACT versus CCRT alone were 71.9% versus 23.9% for haematological and 34.6% versus 10.6% for gastrointestinal symptoms (nausea, vomiting, diarrhoea, abdominal pain/cramping, anorexia and proctitis), respectively. More women in the study arm had received one or more blood transfusions: 49.2% versus 27.5% (P value < 0.001). Overall, three deaths occurred in the CCRT plus ACT arm during or 30 days after treatment. Two deaths were attributed to the ACT. When study authors assessed toxicities from the preadjuvant and adjuvant treatments separately, they found that the CCRT plus ACT arm had greater toxicity than the CCRT alone arm during the preadjuvant phase. However, the incidence of new toxicity during ACT was generally low.
No meta‐analysis was performed. Data on anaemia and thrombocytopenia from each individual study are shown in Analysis 3.1 (Figure 7) and Figure 8, respectively.

Forest plot of comparison: 3 Adverse events, outcome: 3.1 Anaemia.

Forest plot of comparison: 3 Adverse events, outcome: 3.2 Thrombocytopenia.
Other outcomes
No information on QoL was reported in either study (Dueñas‐González 2011; Lorvidhaya 2003).
Discussion
Summary of main results
Results from the two studies were not amenable to meta‐analysis for evaluation of the effect of adjuvant chemotherapy (ACT) after concurrent chemoradiation therapy (CCRT) in terms of survival and total failure rate after treatment.
Overall completeness and applicability of evidence
Two studies met the inclusion criteria (Dueñas‐González 2011; Lorvidhaya 2003). We observed important differences between the two studies, which did not allow us to perform a meta‐analysis to address all the objectives as planned.
The studies were conducted in the 1990s and 2000s. This resulted in different trial designs as the computed tomography (CT) scanner was not used consistently as an investigative tool. Although CT scan has never been included in the International Federation of Gynecology and Obstetrics (FIGO) staging process, it is used routinely and impacts treatment decisions in clinical practice and modern research settings. Lorvidhaya 2003 conducted their study from 1988 to 1994, when CT scan of the abdomen was not routinely practiced. This may have led to heterogeneous participant characteristics or risk features. Some participants with locally advanced cervical cancer (LACC) may already have had distant disease beyond the pelvis, particularly the para‐aortic lymph nodes. This could affect the incidence and detection of systemic failure, as standard physical examination and plain film chest imaging during follow‐up may not detect subtle disease, especially in retroperitoneal nodes. This is likely to affect the progression‐free period. Dueñas‐González 2011, who conducted their study from 2002 to 2004, included CT scanning in all participants as an evaluation tool and excluded cases with para‐aortic lymph node metastasis. This is likely to have resulted in a different participant cohort than was seen in the Lorvidhaya 2003 study, with reduced risk of failure after treatment. CT scanning was also used during surveillance and is likely to have detected recurrence earlier than standard evaluation. This tended to reduce the progression‐free interval compared with clinical follow‐up.
The second difference was the chemotherapy used in each study. Lorvidhaya 2003 used non‐platinum drugs in their study, and Dueñas‐González 2011 used platinum‐based chemotherapy, which is the current standard of care.
Given these differences, it was believed inappropriate to perform a meta‐analysis of data extracted from the two studies.
Quality of the evidence
Evidence from our review neither supports nor refutes the use of adjuvant chemotherapy to improve survival outcomes or to decrease failure after treatment. Some issues, which were observed in each trial as detailed below, were considered 'flaws' that prevented a definitive conclusion.
Oral adjuvant chemotherapy was used in Lorvidhaya 2003 (oral 5‐FU) post combination with mitomycin during CCRT. This study did not report measures used to ascertain participant compliance. This might be reflected by similar rates of toxicity among participants who received or did not receive ACT after CCRT. These factors may have decreased the potential activity of ACT. Dueñas‐González 2011 described an imbalance in chemotherapy concurrent with radiation therapy between the two study arms. Single‐agent cisplatin was given to participants in the control arm, whereas cisplatin and gemcitabine were given to participants in the study arm. The combined drug was also given as ACT in the study arm. Hence, it is not possible to attribute any survival advantage in the study arm to ACT alone, as this may be due to the effects of more chemotherapy during CCRT rather than to the effects of ACT.
The other issue was the means of tumour assessment. All participants in Lorvidhaya 2003 underwent only chest x‐ray and intravenous pyelography, as allowed by the FIGO staging system. Computed tomography scan was not required. This is likely to have contributed to heterogeneous participant characteristics compared with those in Dueñas‐González 2011, because some women may already have had systemic spread of disease before treatment. All women in Dueñas‐González 2011 underwent whole abdominal CT scanning as part of the baseline evaluation and post‐treatment follow‐up. This was done to assess the para‐aortic lymph nodes, and women with confirmed nodal involvement (confirmed by fine‐needle aspiration) were excluded. This is likely to have decreased any bias due to imbalance between the two arms, as only participants without proven preexisting systemic spread were included.
Regarding the other outcomes, numbers of local and systemic failures and limited aspects of toxicity (anaemia and thrombocytopenia) were consistently reported in both studies (Dueñas‐González 2011; Lorvidhaya 2003). However, we determined that the results were inconclusive because substantial heterogeneity was observed in the analyses.
The last observation was the duration of follow‐up in both studies, which was relatively short, so outcomes from long‐term follow‐up are necessary.
Potential biases in the review process
The authors of this review, with support from the Cochrane Gynaecological Cancer Group, performed a comprehensive search. All studies were sifted and data were extracted by two review authors independently. Only RCTs were included in this review, as they provide the best available evidence. RCTs conducted when CCRT was not used as standard treatment for LACC with only radiation therapy used in the control arm (Kantardzic 2004; Vishnevskaia 1999; Wang 2010; Wong 1999) or in both arms (Chiara 1994) were excluded because radiation alone at present is considered suboptimal standard treatment for patients with LACC. Data from the study arms of these studies (Kantardzic 2004; Vishnevskaia 1999; Wang 2010; Wong 1999) or from both arms (Chiara 1994), using CCRT plus ACT, were not reported. Randomised controlled trials using other treatment (e.g. neoadjuvant chemotherapy) in addition to CCRT and ACT were also excluded because this treatment approach may obviate the effects of ACT. No other potential biases were noted in the review process.
The review authors' judgements about each risk of bias item for each included study are shown in Figure 9 and Figure 10.

Risk of bias graph: review authors' judgements about each risk of bias item presented as percentages across all included studies.

Risk of bias summary: review authors' judgements about each risk of bias item for each included study.
Agreements and disagreements with other studies or reviews
One of the authors of this review performed a narrative review (Tangjitgamol 2011) on this topic, including three prospective single‐arm studies (Choi 2007; Vrdoljak 2006; Zhang 2010), one matched‐case comparison (Choi 2010) and four RCTs (Dueñas‐González 2011; Kantardzic 2004; Lorvidhaya 2003; Wong 1999). Most of these studies were excluded from our review for reasons stated in the section on Characteristics of excluded studies.

Study flow diagram.

Forest plot of comparison: 1 Survival, outcome: 1.1 Progression‐free survival.

Forest plot of comparison: 1 Survival, outcome: 1.2 Overall survival.

Forest plot of comparison: 2 Failure after treatment, outcome: 2.1 Total failure after treatment.
Forest plot of comparison: 2 Failure after treatment, outcome: 2.2 Local failure.

Forest plot of comparison: 2 Failure after treatment, outcome: 2.3 Distant failure.

Forest plot of comparison: 3 Adverse events, outcome: 3.1 Anaemia.

Forest plot of comparison: 3 Adverse events, outcome: 3.2 Thrombocytopenia.

Risk of bias graph: review authors' judgements about each risk of bias item presented as percentages across all included studies.

Risk of bias summary: review authors' judgements about each risk of bias item for each included study.

Comparison 1 Survival, Outcome 1 Progression‐free survival.

Comparison 1 Survival, Outcome 2 Overall survival.

Comparison 2 Failure after treatment, Outcome 1 Total failure after treatment.

Comparison 2 Failure after treatment, Outcome 2 Local failure.

Comparison 2 Failure after treatment, Outcome 3 Distant failure.

Comparison 3 Adverse events, Outcome 1 Anaemia.

Comparison 3 Adverse events, Outcome 2 Thrombocytopenia.
| Study | Lordvithaya | Dueñas‐Gonzalez |
| N (CCRT versus CCRT/ACT) | 233 versus 230 | 256 versus 259 |
| FU | 89 months | 46.9 months |
| Outcomes (CCRT versus CCRT/ACT) |
|
|
| 1. OS |
|
|
| · 3‐year OS | 85% versus 79% (estimated from graph), P value NS HR 1.309, 95% CI 0.795 to 2.157 (by Parmar method) | 69% versus 78% (estimated from graph) HR 0.68, 95% CI 0.49 to 0.95, P value 0.0224 |
| · 5‐year OS | 82.7% (79.0 to 86.4) versus 73.6 (67.1 to 80.1), P value NS | ‐ |
| 2. PFS |
|
|
| · 3‐year PFS | 68% versus 63% (estimated from graph), P value NS HR 1.125, 95% CI 0.799 to 1.586 (by Parmar method) | 65.0% (58.5 to 70.7) versus 74.4 % (68 to 79.8) HR 0.68, 95% CI 0.49 to 0.95), P value 0.0227 |
| · 5‐year PFS | 64.5% (60.6 to 68.0) versus 59.7% (53.6 to 65.8), P value NS | ‐ |
| Study | Lordvithaya | Dueñas‐Gonzalez |
| N (CCRT versus CCRT/ ACT) | 233 versus 230 | 256 versus 259 |
| · Local (with or without DR) | 31 (14.3%) versus 36 (17.6%), P value NS | 16.4% versus 11.2%, P value 0.097 |
| · Distant (with or without LR) | 38 (17.7%) versus 40 (19.5%), P value NS | 16.4% versus 8.1%, P value 0.005 |
| · Local and/ or distant | 63 (29.0%) versus 64 (31.2%), P value NS | ‐ |
| Study | Lordvithaya | Dueñas‐Gonzalez |
| Response rate | NA | 93.4 (89.6 to 96.1) in CCRT arm versus 95.8 (92.5 to 97.9) in CCRT + ACT arm, P value 0.249 |
| Adverse events/Study | Lordvithaya n (%) | Dueñas‐Gonzalez n (%) | ||
| CCRT (N = 218) | CCRT + ACT (N = 211) | CCRT (N = 255) | CCRT + ACT (N = 260) | |
| Acute adverse event (grade 1 to 2) | ||||
| 1. Haematological | ||||
|
| 110 (50.4) | 139 (65.8) | NA | |
|
| 137 (62.8) | 142 (67.3) | 86 (33.8) | 128 (49.3) |
|
| NA | 62 (24.3) | 80 (30.8) | |
|
| NA | 0 | 1 (0.4) | |
|
| 56 (25.7) | 70 (33.5) | 26 (10.2) | 58 (32.4) |
|
| NA | NA | ||
| 2. Gastrointestinal | ||||
|
| NA | 148 (58.0) | 153 (58.8) | |
|
| NA | 116 (45.5) | 129 (49.6) | |
|
| NA | 37 (14.5) | 46 (17.7) | |
|
| NA | 119 (46.7) | 121 (46.5) | |
|
| NA | 6 (1.6) | 33 (12.6) | |
|
| NA | 20 (7.9) | 29 (11.2) | |
| 3. Genitourinary (increased Cr level) | NA | 2 (0.8) | 5 (1.9) | |
| 4. Skin | NA | 40 (15.7) | 45 (17.3) | |
| 5. Neurological | NA | NA | ||
| 6. Pulmonary | NA | NA | ||
| Acute adverse event (grade 3 to 4) | ||||
| 1. Haematological | ||||
|
| 9 (4.1) | 6 (2.9) | NA | |
|
| 0 | 5 (2.0) | 24 (9.2) | |
|
| NA | 15 (5.9) | 133 (51.2) | |
|
| NA | 1 (0.4) | 6 (2.3) | |
|
| 5 (2.3) | 3 (1.5) | 3 (1.2) | 16 (6.2) |
|
| NA | NA | ||
| 2. Gastrointestinal | ||||
|
| NA | 7 (2.7) | 11 (4.2) | |
|
| NA | 7 (2.8) | 20 (7.7) | |
|
| NA | 0 | 1 (0.4) | |
|
| NA | 12 (4.7) | 46 (17.7) | |
|
| NA | 0 | 4 (1.6) | |
|
| NA | 1 (0.4) | 9 (3.5) | |
| 3. Genitourinary (increased Cr level) | NA | 2 (0.8) | 4 (1.5) | |
| 4. Skin | NA | 27 (10.6) | 29 (11.2) | |
| 5. Neurological | NA | NA | ||
| 6. Pulmonary | NA | NA | ||
| Study | Lordvithaya n (%) | Dueñas‐Gonzalez n (%) |
| Late adverse event (grade 3 to 4) | ||
| 1. Bowel | 3.1% vs 5.8% | 1 (0.5) vs 5 (2.3) |
| 2. Bladder | 1 (0.5) vs 3 (1.4) | |
| 3. Mucous membrane | NA | 1 (0.5%) vs 1 (0.5) |
| 4. Subcutaneous | 0 vs 1 (0.5) | |
| Outcome or subgroup title | No. of studies | No. of participants | Statistical method | Effect size |
| 1 Progression‐free survival Show forest plot | 2 | Hazard Ratio (Fixed, 95% CI) | Totals not selected | |
| 2 Overall survival Show forest plot | 2 | Hazard Ratio (Fixed, 95% CI) | Totals not selected | |
| Outcome or subgroup title | No. of studies | No. of participants | Statistical method | Effect size |
| 1 Total failure after treatment Show forest plot | 2 | Risk Ratio (M‐H, Random, 95% CI) | Totals not selected | |
| 2 Local failure Show forest plot | 2 | Risk Ratio (M‐H, Random, 95% CI) | Totals not selected | |
| 3 Distant failure Show forest plot | 2 | Risk Ratio (M‐H, Random, 95% CI) | Totals not selected | |
| Outcome or subgroup title | No. of studies | No. of participants | Statistical method | Effect size |
| 1 Anaemia Show forest plot | 2 | Risk Ratio (M‐H, Random, 95% CI) | Totals not selected | |
| 2 Thrombocytopenia Show forest plot | 2 | Risk Ratio (M‐H, Random, 95% CI) | Totals not selected | |