Quimioterapia adyuvante después de quimiorradiación concurrente para el cáncer de cuello de útero localmente avanzado
Appendices
Appendix 1. CENTRAL
#1 MeSH descriptor: [Uterine Cervical Neoplasms] this term only
#2 (cervi* near/5 (cancer* or neoplas* or carcinoma* or tumor* or tumour* or malignan*))
#3 #1 or #2
#4 Any MeSH descriptor with qualifier(s): [Radiotherapy ‐ RT]
#5 MeSH descriptor: [Radiotherapy] explode all trees
#6 MeSH descriptor: [Chemoradiotherapy] explode all trees
#7 (radiotherap* or radiat* or irradiat* or chemoradi* or radiochemo*)
#8 #4 or #5 or #6 or 7
#9 Any MeSH descriptor with qualifier(s): [Drug therapy ‐ DT]
#10 MeSH descriptor: [Antineoplastic Agents] explode all trees
#11 MeSH descriptor: [Antineoplastic Combined Chemotherapy Protocols] this term only
#12 MeSH descriptor: [Chemotherapy, Adjuvant] explode all trees
#13 chemo*
#14 #9 or #10 or #11 or #12 or #13
#15 #3 and #8 and #14
Appendix 2. MEDLINE search strategy
1. Uterine Cervical Neoplasms/
2. (cervi* adj5 (cancer* or neoplas* or carcinoma* or tumor* or tumour* or malignan*)).mp.
3. 1 or 2
4. radiotherapy.fs.
5. exp Radiotherapy/
6. exp Chemoradiotherapy/
7. (radiotherap* or radiat* or irradiat* or chemoradi* or radiochemo*).mp.
8. 4 or 5 or 6 or 7
9. drug therapy.fs.
10. exp Antineoplastic Agents/
11. Antineoplastic Combined Chemotherapy Protocols/
12. Chemotherapy, Adjuvant/
13. chemo*.mp.
14. 9 or 10 or 11 or 12 or 13
15. 3 and 8 and 14
16. randomized controlled trial.pt.
17. controlled clinical trial.pt.
18. randomized.ab.
19. placebo.ab.
20. clinical trials as topic.sh.
21. randomly.ab.
22. trial.ti.
23. 16 or 17 or 18 or 19 or 20 or 21 or 22
24. 15 and 23
25. exp animals/ not humans.sh.
26. 24 not 25
key: mp=title, abstract, original title, name of substance word, subject heading word, protocol supplementary concept, rare disease supplementary concept, unique identifier, pt=publication type, ab=abstract, ti=title, sh=subject heading, fs=floating subheading, exp=exploded term
Appendix 3. EMBASE
1. exp uterine cervix tumor/
2. (cervi* adj5 (cancer* or neoplas* or carcinoma* or tumor* or tumour* or malignan*)).mp.
3. 1 or 2
4. rt.fs.
5. exp radiotherapy/
6. exp chemoradiotherapy/
7. (radiotherap* or radiat* or irradiat* or chemoradi* or radiochemo*).mp.
8. 4 or 5 or 6 or 7
9. dt.fs.
10. exp antineoplastic agent/
11. exp chemotherapy/
12. chemo*.mp.
13. 9 or 10 or 11 or 12
14. 3 and 8 and 13
15. crossover procedure/
16. double‐blind procedure/
17. randomized controlled trial/
18. single‐blind procedure/
19. random*.mp.
20. factorial*.mp.
21. (crossover* or cross over* or cross‐over*).mp.
22. placebo*.mp.
23. (double* adj blind*).mp.
24. (singl* adj blind*).mp.
25. assign*.mp.
26. allocat*.mp.
27. volunteer*.mp.
28. 15 or 16 or 17 or 18 or 19 or 20 or 21 or 22 or 23 or 24 or 25 or 26 or 27
29. 14 and 28
30. (exp animal/ or nonhuman/ or exp animal experiment/) not human/
31. 29 not 30
key: [mp=title, abstract, subject headings, heading word, drug trade name, original title, device manufacturer, drug manufacturer, device trade name, keyword]
Appendix 4. The Cochrane Collaboration tool for assessing risk of bias in included studies
Random sequence generation
-
Low risk of bias: e.g. participants assigned to treatments on basis of a computer‐generated random sequence or a table of random numbers.
-
High risk of bias: e.g. participants assigned to treatments on basis of date of birth, clinic ID number or surname or no attempt to randomly assign participants.
-
Unclear risk of bias: e.g. not reported, information not available.
Allocation concealment
-
Low risk of bias: e.g. where the allocation sequence could not be foretold.
-
High risk of bias: e.g. allocation sequence could be foretold by participants, investigators or treatment providers.
-
Unclear risk of bias: e.g. not reported.
Blinding of participants and personnel (not applicable)
Blinding of outcomes assessors
-
Low risk of bias if outcome assessors were adequately blinded.
-
High risk of bias if outcome assessors were not blinded to the intervention that the participant received.
-
Unclear risk of bias if this was not reported or was unclear.
Incomplete outcome data
We recorded the proportions of participants whose outcomes were not reported at the end of the study. We coded a satisfactory level of loss to follow‐up for each outcome as follows.
-
Low risk of bias if less than 20% of participants were lost to follow‐up and reasons for loss to follow‐up were similar in both treatment arms.
-
High risk of bias if more than 20% of participants were lost to follow‐up or reasons for loss to follow‐up differed between treatment arms.
-
Unclear risk of bias if loss to follow‐up was not reported.
Selective reporting of outcomes
-
Low risk of bias: e.g. review reports all outcomes specified in the protocol.
-
High risk of bias: e.g. it is suspected that outcomes have been selectively reported.
-
Unclear risk of bias: e.g. it is unclear whether outcomes had been selectively reported.
Other bias
-
Low risk of bias if no source of bias is suspected and the trial appears to be methodologically sound.
-
High risk of bias if the trial is suspected to have an additional bias.
-
Unclear risk of bias if it is uncertain whether an additional bias may have been present.
Adopted from Higgins 2011.

Study flow diagram.

Forest plot of comparison: 1 Survival, outcome: 1.1 Progression‐free survival.

Forest plot of comparison: 1 Survival, outcome: 1.2 Overall survival.

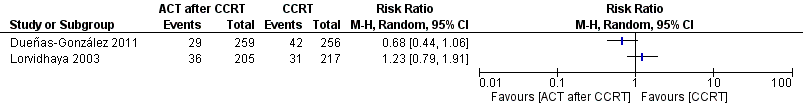
Forest plot of comparison: 2 Failure after treatment, outcome: 2.1 Total failure after treatment.
Forest plot of comparison: 2 Failure after treatment, outcome: 2.2 Local failure.

Forest plot of comparison: 2 Failure after treatment, outcome: 2.3 Distant failure.

Forest plot of comparison: 3 Adverse events, outcome: 3.1 Anaemia.

Forest plot of comparison: 3 Adverse events, outcome: 3.2 Thrombocytopenia.

Risk of bias graph: review authors' judgements about each risk of bias item presented as percentages across all included studies.

Risk of bias summary: review authors' judgements about each risk of bias item for each included study.

Comparison 1 Survival, Outcome 1 Progression‐free survival.

Comparison 1 Survival, Outcome 2 Overall survival.

Comparison 2 Failure after treatment, Outcome 1 Total failure after treatment.

Comparison 2 Failure after treatment, Outcome 2 Local failure.

Comparison 2 Failure after treatment, Outcome 3 Distant failure.

Comparison 3 Adverse events, Outcome 1 Anaemia.

Comparison 3 Adverse events, Outcome 2 Thrombocytopenia.
| Study | Lordvithaya | Dueñas‐Gonzalez |
| N (CCRT versus CCRT/ACT) | 233 versus 230 | 256 versus 259 |
| FU | 89 months | 46.9 months |
| Outcomes (CCRT versus CCRT/ACT) |
|
|
| 1. OS |
|
|
| · 3‐year OS | 85% versus 79% (estimated from graph), P value NS HR 1.309, 95% CI 0.795 to 2.157 (by Parmar method) | 69% versus 78% (estimated from graph) HR 0.68, 95% CI 0.49 to 0.95, P value 0.0224 |
| · 5‐year OS | 82.7% (79.0 to 86.4) versus 73.6 (67.1 to 80.1), P value NS | ‐ |
| 2. PFS |
|
|
| · 3‐year PFS | 68% versus 63% (estimated from graph), P value NS HR 1.125, 95% CI 0.799 to 1.586 (by Parmar method) | 65.0% (58.5 to 70.7) versus 74.4 % (68 to 79.8) HR 0.68, 95% CI 0.49 to 0.95), P value 0.0227 |
| · 5‐year PFS | 64.5% (60.6 to 68.0) versus 59.7% (53.6 to 65.8), P value NS | ‐ |
| Study | Lordvithaya | Dueñas‐Gonzalez |
| N (CCRT versus CCRT/ ACT) | 233 versus 230 | 256 versus 259 |
| · Local (with or without DR) | 31 (14.3%) versus 36 (17.6%), P value NS | 16.4% versus 11.2%, P value 0.097 |
| · Distant (with or without LR) | 38 (17.7%) versus 40 (19.5%), P value NS | 16.4% versus 8.1%, P value 0.005 |
| · Local and/ or distant | 63 (29.0%) versus 64 (31.2%), P value NS | ‐ |
| Study | Lordvithaya | Dueñas‐Gonzalez |
| Response rate | NA | 93.4 (89.6 to 96.1) in CCRT arm versus 95.8 (92.5 to 97.9) in CCRT + ACT arm, P value 0.249 |
| Adverse events/Study | Lordvithaya n (%) | Dueñas‐Gonzalez n (%) | ||
| CCRT (N = 218) | CCRT + ACT (N = 211) | CCRT (N = 255) | CCRT + ACT (N = 260) | |
| Acute adverse event (grade 1 to 2) | ||||
| 1. Haematological | ||||
|
| 110 (50.4) | 139 (65.8) | NA | |
|
| 137 (62.8) | 142 (67.3) | 86 (33.8) | 128 (49.3) |
|
| NA | 62 (24.3) | 80 (30.8) | |
|
| NA | 0 | 1 (0.4) | |
|
| 56 (25.7) | 70 (33.5) | 26 (10.2) | 58 (32.4) |
|
| NA | NA | ||
| 2. Gastrointestinal | ||||
|
| NA | 148 (58.0) | 153 (58.8) | |
|
| NA | 116 (45.5) | 129 (49.6) | |
|
| NA | 37 (14.5) | 46 (17.7) | |
|
| NA | 119 (46.7) | 121 (46.5) | |
|
| NA | 6 (1.6) | 33 (12.6) | |
|
| NA | 20 (7.9) | 29 (11.2) | |
| 3. Genitourinary (increased Cr level) | NA | 2 (0.8) | 5 (1.9) | |
| 4. Skin | NA | 40 (15.7) | 45 (17.3) | |
| 5. Neurological | NA | NA | ||
| 6. Pulmonary | NA | NA | ||
| Acute adverse event (grade 3 to 4) | ||||
| 1. Haematological | ||||
|
| 9 (4.1) | 6 (2.9) | NA | |
|
| 0 | 5 (2.0) | 24 (9.2) | |
|
| NA | 15 (5.9) | 133 (51.2) | |
|
| NA | 1 (0.4) | 6 (2.3) | |
|
| 5 (2.3) | 3 (1.5) | 3 (1.2) | 16 (6.2) |
|
| NA | NA | ||
| 2. Gastrointestinal | ||||
|
| NA | 7 (2.7) | 11 (4.2) | |
|
| NA | 7 (2.8) | 20 (7.7) | |
|
| NA | 0 | 1 (0.4) | |
|
| NA | 12 (4.7) | 46 (17.7) | |
|
| NA | 0 | 4 (1.6) | |
|
| NA | 1 (0.4) | 9 (3.5) | |
| 3. Genitourinary (increased Cr level) | NA | 2 (0.8) | 4 (1.5) | |
| 4. Skin | NA | 27 (10.6) | 29 (11.2) | |
| 5. Neurological | NA | NA | ||
| 6. Pulmonary | NA | NA | ||
| Study | Lordvithaya n (%) | Dueñas‐Gonzalez n (%) |
| Late adverse event (grade 3 to 4) | ||
| 1. Bowel | 3.1% vs 5.8% | 1 (0.5) vs 5 (2.3) |
| 2. Bladder | 1 (0.5) vs 3 (1.4) | |
| 3. Mucous membrane | NA | 1 (0.5%) vs 1 (0.5) |
| 4. Subcutaneous | 0 vs 1 (0.5) | |
| Outcome or subgroup title | No. of studies | No. of participants | Statistical method | Effect size |
| 1 Progression‐free survival Show forest plot | 2 | Hazard Ratio (Fixed, 95% CI) | Totals not selected | |
| 2 Overall survival Show forest plot | 2 | Hazard Ratio (Fixed, 95% CI) | Totals not selected | |
| Outcome or subgroup title | No. of studies | No. of participants | Statistical method | Effect size |
| 1 Total failure after treatment Show forest plot | 2 | Risk Ratio (M‐H, Random, 95% CI) | Totals not selected | |
| 2 Local failure Show forest plot | 2 | Risk Ratio (M‐H, Random, 95% CI) | Totals not selected | |
| 3 Distant failure Show forest plot | 2 | Risk Ratio (M‐H, Random, 95% CI) | Totals not selected | |
| Outcome or subgroup title | No. of studies | No. of participants | Statistical method | Effect size |
| 1 Anaemia Show forest plot | 2 | Risk Ratio (M‐H, Random, 95% CI) | Totals not selected | |
| 2 Thrombocytopenia Show forest plot | 2 | Risk Ratio (M‐H, Random, 95% CI) | Totals not selected | |