Quimioterapia adyuvante después de quimiorradiación concurrente para el cáncer de cuello de útero localmente avanzado
Información
- DOI:
- https://doi.org/10.1002/14651858.CD010401.pub2Copiar DOI

- Base de datos:
-
- Cochrane Database of Systematic Reviews
- Versión publicada:
-
- 03 diciembre 2014see what's new
- Tipo:
-
- Intervention
- Etapa:
-
- Review
- Grupo Editorial Cochrane:
-
Grupo Cochrane de Cáncer ginecológico, neurooncología y otros cánceres
- Copyright:
-
- Copyright © 2019 The Cochrane Collaboration. Published by John Wiley & Sons, Ltd.
Cifras del artículo
Altmetric:
Citado por:
Autores
Contributions of authors
Siriwan Tangjitgamol and Kanyarat Katanyoo developed the review, searched for and determined the relevance of trials for the review, assessed their methodological quality, collected and extracted data and wrote the review. Pisake Lumbiganon supervised the drafts, provided methodological advice throughout the review, arbitrated over disagreements and advised over the content and presentation of the review. Sumonmal Manusirivithaya developed the protocol and reviewed the drafts and the final manuscript. Malinee Laopaiboon and Busaba Supawattanabodee developed the protocol and ensured scientific purity.
Sources of support
Internal sources
-
Faculty of Medicine Vajira Hospital, University of Bangkok Metropolis, Thailand.
-
Faculty of Medicine, Khon Kaen University, Thailand.
-
Faculty of Public Health, Khon Kaen University, Thailand.
External sources
-
Thailand Research Fund (Senior Research Scholar), Thailand.
-
Thai Cochrane Network, Thailand.
Declarations of interest
The review authors and their colleagues are conducting an RCT entitled 'Randomized controlled trial comparing concurrent chemoradiation versus concurrent chemoradiation followed by adjuvant chemotherapy in locally advanced cervical cancer patients.'.
Acknowledgements
We thank Jo Morrison for providing clinical advice; Jane Hayes for designing the search strategy; Gail Quinn, Andrew Bryant, Tess Lawrie and Clare Jess for contributing to the editorial process and Janice Hamman for assisting with English language presentation.
The National Institute for Health Research (NIHR) is the largest single funder of the Cochrane Gynaecological Cancer Group.
The views and opinions expressed therein are those of the review authors and do not necessarily reflect those of the NIHR, the National Health Service (NHS) or the Department of Health.
Version history
| Published | Title | Stage | Authors | Version |
| 2014 Dec 03 | Adjuvant chemotherapy after concurrent chemoradiation for locally advanced cervical cancer | Review | Siriwan Tangjitgamol, Kanyarat Katanyoo, Malinee Laopaiboon, Pisake Lumbiganon, Sumonmal Manusirivithaya, Busaba Supawattanabodee | |
| 2013 Feb 28 | Adjuvant chemotherapy after concurrent chemoradiation for locally advanced cervical cancer | Protocol | Siriwan Tangjitgamol, Kanyarat Katanyoo, Malinee Laopaiboon, Pisake Lumbiganon, Sumonmal Manusirivithaya, Busaba Supawattanabodee | |
Differences between protocol and review
Failure after treatment, which was not stated in the protocol, was included in the review and meta‐analysis. We determined that two main reasons justified the change. First, adjuvant chemotherapy is generally expected to have a systemic effect in controlling distant failure, and evidence from the meta‐analysis should be useful for clinical practice. Second, data on this outcome were completely reported in both trials.
Keywords
MeSH
Medical Subject Headings (MeSH) Keywords
- Antineoplastic Combined Chemotherapy Protocols [*therapeutic use];
- Chemoradiotherapy [*methods, mortality];
- Chemotherapy, Adjuvant [adverse effects, methods, mortality];
- Cisplatin [administration & dosage];
- Deoxycytidine [administration & dosage, analogs & derivatives];
- Fluorouracil [administration & dosage];
- Mitomycin [administration & dosage];
- Neoplasm Staging;
- Randomized Controlled Trials as Topic;
- Uterine Cervical Neoplasms [mortality, pathology, *therapy];
Medical Subject Headings Check Words
Female; Humans;
PICO

Study flow diagram.

Forest plot of comparison: 1 Survival, outcome: 1.1 Progression‐free survival.

Forest plot of comparison: 1 Survival, outcome: 1.2 Overall survival.

Forest plot of comparison: 2 Failure after treatment, outcome: 2.1 Total failure after treatment.
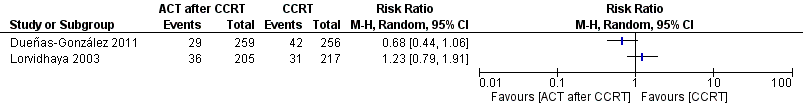
Forest plot of comparison: 2 Failure after treatment, outcome: 2.2 Local failure.

Forest plot of comparison: 2 Failure after treatment, outcome: 2.3 Distant failure.

Forest plot of comparison: 3 Adverse events, outcome: 3.1 Anaemia.

Forest plot of comparison: 3 Adverse events, outcome: 3.2 Thrombocytopenia.

Risk of bias graph: review authors' judgements about each risk of bias item presented as percentages across all included studies.

Risk of bias summary: review authors' judgements about each risk of bias item for each included study.

Comparison 1 Survival, Outcome 1 Progression‐free survival.

Comparison 1 Survival, Outcome 2 Overall survival.

Comparison 2 Failure after treatment, Outcome 1 Total failure after treatment.

Comparison 2 Failure after treatment, Outcome 2 Local failure.

Comparison 2 Failure after treatment, Outcome 3 Distant failure.

Comparison 3 Adverse events, Outcome 1 Anaemia.

Comparison 3 Adverse events, Outcome 2 Thrombocytopenia.
| Study | Lordvithaya | Dueñas‐Gonzalez |
| N (CCRT versus CCRT/ACT) | 233 versus 230 | 256 versus 259 |
| FU | 89 months | 46.9 months |
| Outcomes (CCRT versus CCRT/ACT) |
|
|
| 1. OS |
|
|
| · 3‐year OS | 85% versus 79% (estimated from graph), P value NS HR 1.309, 95% CI 0.795 to 2.157 (by Parmar method) | 69% versus 78% (estimated from graph) HR 0.68, 95% CI 0.49 to 0.95, P value 0.0224 |
| · 5‐year OS | 82.7% (79.0 to 86.4) versus 73.6 (67.1 to 80.1), P value NS | ‐ |
| 2. PFS |
|
|
| · 3‐year PFS | 68% versus 63% (estimated from graph), P value NS HR 1.125, 95% CI 0.799 to 1.586 (by Parmar method) | 65.0% (58.5 to 70.7) versus 74.4 % (68 to 79.8) HR 0.68, 95% CI 0.49 to 0.95), P value 0.0227 |
| · 5‐year PFS | 64.5% (60.6 to 68.0) versus 59.7% (53.6 to 65.8), P value NS | ‐ |
| Study | Lordvithaya | Dueñas‐Gonzalez |
| N (CCRT versus CCRT/ ACT) | 233 versus 230 | 256 versus 259 |
| · Local (with or without DR) | 31 (14.3%) versus 36 (17.6%), P value NS | 16.4% versus 11.2%, P value 0.097 |
| · Distant (with or without LR) | 38 (17.7%) versus 40 (19.5%), P value NS | 16.4% versus 8.1%, P value 0.005 |
| · Local and/ or distant | 63 (29.0%) versus 64 (31.2%), P value NS | ‐ |
| Study | Lordvithaya | Dueñas‐Gonzalez |
| Response rate | NA | 93.4 (89.6 to 96.1) in CCRT arm versus 95.8 (92.5 to 97.9) in CCRT + ACT arm, P value 0.249 |
| Adverse events/Study | Lordvithaya n (%) | Dueñas‐Gonzalez n (%) | ||
| CCRT (N = 218) | CCRT + ACT (N = 211) | CCRT (N = 255) | CCRT + ACT (N = 260) | |
| Acute adverse event (grade 1 to 2) | ||||
| 1. Haematological | ||||
|
| 110 (50.4) | 139 (65.8) | NA | |
|
| 137 (62.8) | 142 (67.3) | 86 (33.8) | 128 (49.3) |
|
| NA | 62 (24.3) | 80 (30.8) | |
|
| NA | 0 | 1 (0.4) | |
|
| 56 (25.7) | 70 (33.5) | 26 (10.2) | 58 (32.4) |
|
| NA | NA | ||
| 2. Gastrointestinal | ||||
|
| NA | 148 (58.0) | 153 (58.8) | |
|
| NA | 116 (45.5) | 129 (49.6) | |
|
| NA | 37 (14.5) | 46 (17.7) | |
|
| NA | 119 (46.7) | 121 (46.5) | |
|
| NA | 6 (1.6) | 33 (12.6) | |
|
| NA | 20 (7.9) | 29 (11.2) | |
| 3. Genitourinary (increased Cr level) | NA | 2 (0.8) | 5 (1.9) | |
| 4. Skin | NA | 40 (15.7) | 45 (17.3) | |
| 5. Neurological | NA | NA | ||
| 6. Pulmonary | NA | NA | ||
| Acute adverse event (grade 3 to 4) | ||||
| 1. Haematological | ||||
|
| 9 (4.1) | 6 (2.9) | NA | |
|
| 0 | 5 (2.0) | 24 (9.2) | |
|
| NA | 15 (5.9) | 133 (51.2) | |
|
| NA | 1 (0.4) | 6 (2.3) | |
|
| 5 (2.3) | 3 (1.5) | 3 (1.2) | 16 (6.2) |
|
| NA | NA | ||
| 2. Gastrointestinal | ||||
|
| NA | 7 (2.7) | 11 (4.2) | |
|
| NA | 7 (2.8) | 20 (7.7) | |
|
| NA | 0 | 1 (0.4) | |
|
| NA | 12 (4.7) | 46 (17.7) | |
|
| NA | 0 | 4 (1.6) | |
|
| NA | 1 (0.4) | 9 (3.5) | |
| 3. Genitourinary (increased Cr level) | NA | 2 (0.8) | 4 (1.5) | |
| 4. Skin | NA | 27 (10.6) | 29 (11.2) | |
| 5. Neurological | NA | NA | ||
| 6. Pulmonary | NA | NA | ||
| Study | Lordvithaya n (%) | Dueñas‐Gonzalez n (%) |
| Late adverse event (grade 3 to 4) | ||
| 1. Bowel | 3.1% vs 5.8% | 1 (0.5) vs 5 (2.3) |
| 2. Bladder | 1 (0.5) vs 3 (1.4) | |
| 3. Mucous membrane | NA | 1 (0.5%) vs 1 (0.5) |
| 4. Subcutaneous | 0 vs 1 (0.5) | |
| Outcome or subgroup title | No. of studies | No. of participants | Statistical method | Effect size |
| 1 Progression‐free survival Show forest plot | 2 | Hazard Ratio (Fixed, 95% CI) | Totals not selected | |
| 2 Overall survival Show forest plot | 2 | Hazard Ratio (Fixed, 95% CI) | Totals not selected | |
| Outcome or subgroup title | No. of studies | No. of participants | Statistical method | Effect size |
| 1 Total failure after treatment Show forest plot | 2 | Risk Ratio (M‐H, Random, 95% CI) | Totals not selected | |
| 2 Local failure Show forest plot | 2 | Risk Ratio (M‐H, Random, 95% CI) | Totals not selected | |
| 3 Distant failure Show forest plot | 2 | Risk Ratio (M‐H, Random, 95% CI) | Totals not selected | |
| Outcome or subgroup title | No. of studies | No. of participants | Statistical method | Effect size |
| 1 Anaemia Show forest plot | 2 | Risk Ratio (M‐H, Random, 95% CI) | Totals not selected | |
| 2 Thrombocytopenia Show forest plot | 2 | Risk Ratio (M‐H, Random, 95% CI) | Totals not selected | |