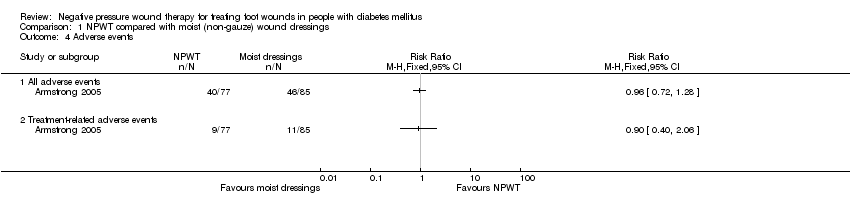
Scolaris Content Display Scolaris Content Display

Study flow diagram (Liberati 2009)
Figuras y tablas -
Figure 1

Study flow diagram (Liberati 2009)

Risk of bias graph: review authors' judgements about each risk of bias item presented as percentages across all included studies.
Figuras y tablas -
Figure 2

Risk of bias graph: review authors' judgements about each risk of bias item presented as percentages across all included studies.

Risk of bias summary: review authors' judgements about each risk of bias item for each included study.
Figuras y tablas -
Figure 3

Risk of bias summary: review authors' judgements about each risk of bias item for each included study.

Comparison 1 NPWT compared with moist (non‐gauze) wound dressings, Outcome 1 Proportion of wounds healed.
Figuras y tablas -
Analysis 1.1

Comparison 1 NPWT compared with moist (non‐gauze) wound dressings, Outcome 1 Proportion of wounds healed.

Comparison 1 NPWT compared with moist (non‐gauze) wound dressings, Outcome 2 Time to healing.
Figuras y tablas -
Analysis 1.2

Comparison 1 NPWT compared with moist (non‐gauze) wound dressings, Outcome 2 Time to healing.

Comparison 1 NPWT compared with moist (non‐gauze) wound dressings, Outcome 3 Amputations.
Figuras y tablas -
Analysis 1.3

Comparison 1 NPWT compared with moist (non‐gauze) wound dressings, Outcome 3 Amputations.

Comparison 1 NPWT compared with moist (non‐gauze) wound dressings, Outcome 4 Adverse events.
Figuras y tablas -
Analysis 1.4

Comparison 1 NPWT compared with moist (non‐gauze) wound dressings, Outcome 4 Adverse events.

Comparison 2 NPWT compared with gauze dressings, Outcome 1 Proportion of wounds healed.
Figuras y tablas -
Analysis 2.1

Comparison 2 NPWT compared with gauze dressings, Outcome 1 Proportion of wounds healed.

Summary of findings for the main comparison. NPWT compared to Moist dressings for healing post‐operative wounds in people with diabetes

NPWT compared to Moist dressings for healing post‐operative wounds in people with diabetes

Patient or population: patients with healing post‐operative wounds in people with diabetes
Settings:
Intervention: NPWT
Comparison: Moist dressings

Outcomes

Illustrative comparative risks* (95% CI)

Relative effect
(95% CI)

No of Participants
(studies)

Quality of the evidence
(GRADE)

Comments

Assumed risk

Corresponding risk

Moist dressings

NPWT

Proportion of wounds healed
Follow‐up: mean 16 weeks

Study population

RR 1.44
(1.03 to 2.01)

162
(1 study)

⊕⊕⊝⊝
low1,2

388 per 1000

559 per 1000
(400 to 780)

Moderate

Time to ulcer healing
Follow‐up: mean 16 weeks

Study population

HR 1.91
(1.21 to 2.99)

162
(1 study)

⊕⊕⊝⊝
low1,3

388 per 1000

609 per 1000
(448 to 770)

Moderate

Amputation
Follow‐up: mean 16 weeks

Study population

RR 0.25
(0.05 to 1.10)

162
(1 study)

⊕⊝⊝⊝
very low1,4

106 per 1000

26 per 1000
(5 to 116)

Moderate

*The basis for the assumed risk (e.g. the median control group risk across studies) is provided in footnotes. The corresponding risk (and its 95% confidence interval) is based on the assumed risk in the comparison group and the relative effect of the intervention (and its 95% CI).
CI: Confidence interval; RR: Risk ratio; HR: Hazard ratio;

GRADE Working Group grades of evidence
High quality: Further research is very unlikely to change our confidence in the estimate of effect.
Moderate quality: Further research is likely to have an important impact on our confidence in the estimate of effect and may change the estimate.
Low quality: Further research is very likely to have an important impact on our confidence in the estimate of effect and is likely to change the estimate.
Very low quality: We are very uncertain about the estimate.

1 There was the potential for performance bias as unblinded health professionals were able to make decisions about undertaking closure surgery that could then have resulted more wounds being closed (and classed as healed) or amputated in one group compared with the other.
2 The confidence interval around the estimate of relative risk is consistent with a 3% relative increase in healing with NPWT to a 101% relative increase in healing with NPWT.
3 The confidence interval around the estimate hazard ratio is consistent with a 21% relative increase in the hazard of healing with NPWT to a 199% relative increase in the hazard of healing with NPWT.
4 The confidence interval around the estimate of relative risk is consistent with a 95% relative reduction in chance of healing with NPWT to a 10% relative increase in healing with NPWT.

Figuras y tablas -
Summary of findings for the main comparison. NPWT compared to Moist dressings for healing post‐operative wounds in people with diabetes
Summary of findings 2. NPWT compared to Moist dressings for debrided foot ulcers in people with diabetes

NPWT compared to Moist dressings for debrided foot ulcers in people with diabetes

Patient or population: patients with debrided foot ulcers in people with diabetes
Settings:
Intervention: NPWT
Comparison: Moist dressings

Outcomes

Illustrative comparative risks* (95% CI)

Relative effect
(95% CI)

No of Participants
(studies)

Quality of the evidence
(GRADE)

Comments

Assumed risk

Corresponding risk

Moist dressings

NPWT

Proportion of wounds healed
Follow‐up: mean 16 weeks

Low risk of healing1

RR 1.49
(1.11 to 2.01)

341
(1 study)

⊕⊕⊝⊝
low2,3

340 per 1000

507 per 1000
(377 to 683)

Moderate risk of healing1

530 per 1000

790 per 1000
(588 to 1000)

High risk of healing1

650 per 1000

968 per 1000
(722 to 1000)

Time to healing
Follow‐up: mean 16 weeks

Low risk of healing4

HR 1.82
(1.27 to 2.60)

341
(1 study)

⊕⊕⊝⊝
low2,5

340 per 1000

531 per 1000
(410 to 661)

Moderate risk of healing4

530 per 1000

747 per 1000
(617 to 860)

High risk of healing4

650 per 1000

852 per 1000
(736 to 935)

Amputation
Follow‐up: mean 16 weeks

Study population

RR 0.40
(0.17 to 0.95)

341
(1 study)

⊕⊕⊝⊝
low2,6

101 per 1000

40 per 1000
(17 to 96)

Moderate

*The basis for the assumed risk (e.g. the median control group risk across studies) is provided in footnotes. The corresponding risk (and its 95% confidence interval) is based on the assumed risk in the comparison group and the relative effect of the intervention (and its 95% CI).
CI: Confidence interval; RR: Risk ratio; HR: Hazard ratio;

GRADE Working Group grades of evidence
High quality: Further research is very unlikely to change our confidence in the estimate of effect.
Moderate quality: Further research is likely to have an important impact on our confidence in the estimate of effect and may change the estimate.
Low quality: Further research is very likely to have an important impact on our confidence in the estimate of effect and is likely to change the estimate.
Very low quality: We are very uncertain about the estimate.

1 Baseline risk of healing obtained from external source in which data from 27,630 patients with a diabetic neuropathic foot ulcer was used to develop a simple prognostic model to predict likelihood of ulcer healing (Margolis DJ, Allen‐Taylor L, Hoffstad O, Berlin JA. Diabetic neuropathic foot ulcers: predicting which ones will not heal. Am J Med. 2003;115:627‐31). It is important to note that given an outcome of ulcer healing, low risk refers to a low risk of healing and thus reflects the most severe patient populations. Conversely high risk refers to a high risk of healing.
2 There was the potential for performance bias as unblinded health professionals were able to make decisions about undertaking closure surgery that could then have resulted more wounds being closed (and classed as healed) or amputated in one group compared with the other.
3 The confidence interval around the estimate of relative risk is consistent with a 11% relative increase in healing with NPWT to a 101% relative increase in risk of healing with NPWT.
4 Baseline risk of healing obtained from external source in which data from 27,630 patients with a diabetic neuropathic foot ulcer was used to develop a simple prognostic model to predict likelihood of ulcer healing (Margolis DJ, Allen‐Taylor L, Hoffstad O, Berlin JA. Diabetic neuropathic foot ulcers: predicting which ones will not heal. Am J Med. 2003;115:627‐31). It is important to note that given an outcome of ulcer healing, low risk refers to a low risk of healing and thus reflects the most severe patient populations. Conversely high risk refers to a high risk of healing.
5 The confidence interval around the estimate hazard ratio is consistent with a 27% relative increase in the hazard of healing with NPWT to a 160% relative increase in the hazard of healing with NPWT.
6 The confidence interval around the estimate of relative risk is consistent with a 83% relative reduction in amputation risk with NPWT to a 5% relative reduction in amputation risk with NPWT.

Figuras y tablas -
Summary of findings 2. NPWT compared to Moist dressings for debrided foot ulcers in people with diabetes
Summary of findings 3. NPWT compared to Gauze dressings for debrided foot ulcers in people with diabetes

NPWT compared to Gauze dressings for debrided foot ulcers in people with diabetes

Patient or population: patients with debrided foot ulcers in people with diabetes
Settings:
Intervention: NPWT
Comparison: Gauze dressings

Outcomes

Illustrative comparative risks* (95% CI)

Relative effect
(95% CI)

No of Participants
(studies)

Quality of the evidence
(GRADE)

Comments

Assumed risk

Corresponding risk

Gauze dressings

NPWT

Proportion of wounds healed
Follow‐up: mean 30 days

Low risk of healing1

RR 0.38
(0.05 to 2.59)

15
(1 study)

⊕⊝⊝⊝
very low2,3

340 per 1000

129 per 1000
(17 to 881)

Moderate risk of healing1

530 per 1000

201 per 1000
(27 to 1000)

High risk of healing1

650 per 1000

247 per 1000
(33 to 1000)

*The basis for the assumed risk (e.g. the median control group risk across studies) is provided in footnotes. The corresponding risk (and its 95% confidence interval) is based on the assumed risk in the comparison group and the relative effect of the intervention (and its 95% CI).
CI: Confidence interval; RR: Risk ratio;

GRADE Working Group grades of evidence
High quality: Further research is very unlikely to change our confidence in the estimate of effect.
Moderate quality: Further research is likely to have an important impact on our confidence in the estimate of effect and may change the estimate.
Low quality: Further research is very likely to have an important impact on our confidence in the estimate of effect and is likely to change the estimate.
Very low quality: We are very uncertain about the estimate.

1 Baseline risk of healing obtained from external source in which data from 27,630 patients with a diabetic neuropathic foot ulcer was used to develop a simple prognostic model to predict likelihood of ulcer healing (Margolis DJ, Allen‐Taylor L, Hoffstad O, Berlin JA. Diabetic neuropathic foot ulcers: predicting which ones will not heal. Am J Med. 2003;115:627‐31). It is important to note that given an outcome of ulcer healing, low risk refers to a low risk of healing and thus reflects the most severe patient populations. Conversely high risk refers to a high risk of healing.
2 Several domain had unclear risk of bias recorded.
3 The confidence interval around the estimate of relative risk is consistent with a 95% relative reduction in risk of healing with NPWT to a 159% relative increased risk of healing with NPWT.

Figuras y tablas -
Summary of findings 3. NPWT compared to Gauze dressings for debrided foot ulcers in people with diabetes
Table 1. Overview of trials

Armstrong 2005

16 weeks

Diabetic foot amputation to trans‐metatarsal level

Group A: moist wound therapy with alginates, hydrocolloid, foam or hydrogel dressings (n = 85)

Group B: NPWT (VAC system, dressing changes every 48 h. Treatment conducted until wound closure or completion of 112‐day assessment (n = 77)

Number of wounds completely healed

Group A: 33/85 (38.8%)

Group B: 43/77 (55.8%)

Of healed wounds —healed by secondary intention (without primary/surgical wound closure)

Group A: 25/33 (75.8%)

Group B: 31/43 (72.1%)

Remaining wounds were closed following surgery.

Time to wound healing

median time to healing

Group A: 77 days (IQR 40 to 122)

Group B: 56 days (IQR 26 to 92)

Log rank = p = 0.005

Amputation

Number of participants undergoing further amputation

Group A: 9/85 (10.6%)

Major = 5/Minor = 4

Group B: 2/77 (2.3%)

Major = 0/Minor = 2

There was no difference noted in time to healing for acute or chronic wounds.

Adverse events

Participants who had one or more adverse events

Group A: 46/85 (54.1%)

Group B: 40/77 (51.9%)

Participants who had one or more treatment‐related adverse events

Group A: 11/85 (12.9%)

5 classified as serious

Group B: 9/77 (11.7%)

1 classified serious

Resource use

Average total cost per participant

Group A: USD 36,887

Group B: USD26,972

Average total direct cost per participants for those treated for 8 weeks or longer

Group A: USD 36,096

Group B: USD 27,270

Average per participant cost to achieve 100% healing

Group A: USD 38,806

Group B: USD 25,954

Blume 2008

16 weeks

Ulceration of the foot in people with diabetes

Group A: advanced moist wound therapy dressings used according to guidelines/local protocols (n = 169)

Group B: NPWT (VAC system), applied according to manufacturer’s instructions. (n = 172)

Number of wounds completely healed (six participants excluded in paper as did not receive treatment, added back into denominator here)

Group A: 48/169 (28.4%)

Group B: 73/172 (42.4%)

Proportion of wounds closed using surgery (unclear if considered part of healed group)

Group A: 14/169 (8.3%)

Group B: 16/172 (9.3%)

Time to wound healing

median time to healing

Group A: could not be estimated

Group B: 96 days (95% CI 75.0 to 114.0)

Log rank taken as P value 0.001

Amputation

Number of participants undergoing amputation*

Group A: 17/169 (10.1%)

Major = 4; minor = 13

Group B: 7/172 (4.1%)

Major = 5; minor = 2

Adverse events

Limited data: not extracted

Resource use – taken from conference abstract that we think is related to this main publication.

Mean estimated total costs of inpatient services per participant

Group A: USD 8570 (95%CI USD 5922 to USD 11,432)

Group B: USD 5206 (95%CI USD 3172 to USD 7561)

Karatepe 2011

Not specified. Last assessment one month after healing

Diabetic foot ulcers

Group A: conventional wound care treatment: based on text in report taken to be dry gauze (n = 37)

Group B: NPWT (VAC system) (n = 30)

Time to healing

Median time to healing

Group A: 4.4 weeks

Group B: 3.9 weeks

Mean value presented but not extracted.

No specific P value presented

Health‐related quality of life

SF‐36: Data not presented.
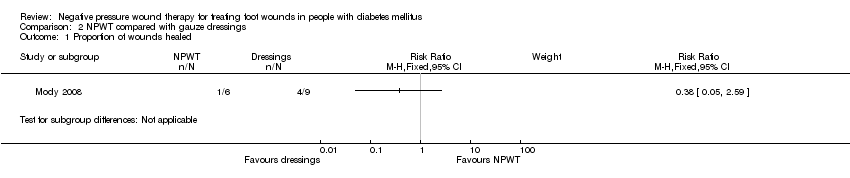
Mody 2008

Not specified: until healing or loss to follow‐up

Diabetic foot ulcers

Group A: wet‐to‐dry gauze (n = 9)

Group B: locally‐constructed NPWT (n = 6)

Number of wounds completely healed

By secondary intention:

Group A: 1/9 (11.0%)

Group B: 1/6 (16.6%)

By delayed primary closure:

Group A: 3/9 (33%)

Group B: 0/6 (0%)

Novinščak 2010

2 months

Complicated diabetic foot ulcers

Group A: classic gauze (n = 8)

Group B: dressings (moist) (n = 12)
Group C: NPWT (n = 7)

Healing rate (percentage with wound closure – defined by author on contact)

Group A: 4/8* (50%)

Group B: 9/12* (75%)

Group C: * could not be calculated (90%)

*Figure calculated by review author as only proportions obtained from study author

Figuras y tablas -
Table 1. Overview of trials
Comparison 1. NPWT compared with moist (non‐gauze) wound dressings

Outcome or subgroup title

No. of studies

No. of participants

Statistical method

Effect size

1 Proportion of wounds healed Show forest plot

2

503

Risk Ratio (M‐H, Fixed, 95% CI)

1.47 [1.18, 1.84]

2 Time to healing Show forest plot

2

Hazard Ratio (Fixed, 95% CI)

1.85 [1.40, 2.45]

3 Amputations Show forest plot

2

503

Risk Ratio (M‐H, Fixed, 95% CI)

0.35 [0.17, 0.74]

4 Adverse events Show forest plot

1

Risk Ratio (M‐H, Fixed, 95% CI)

Totals not selected

4.1 All adverse events

1

Risk Ratio (M‐H, Fixed, 95% CI)

0.0 [0.0, 0.0]

4.2 Treatment‐related adverse events

1

Risk Ratio (M‐H, Fixed, 95% CI)

0.0 [0.0, 0.0]

Figuras y tablas -
Comparison 1. NPWT compared with moist (non‐gauze) wound dressings
Comparison 2. NPWT compared with gauze dressings

Outcome or subgroup title

No. of studies

No. of participants

Statistical method

Effect size

1 Proportion of wounds healed Show forest plot

1

Risk Ratio (M‐H, Fixed, 95% CI)

Subtotals only

Figuras y tablas -
Comparison 2. NPWT compared with gauze dressings