Tratamiento combinado de primera línea versus monoterapia de primera línea para la hipertensión primaria
Información
- DOI:
- https://doi.org/10.1002/14651858.CD010316.pub2Copiar DOI

- Base de datos:
-
- Cochrane Database of Systematic Reviews
- Versión publicada:
-
- 13 enero 2017see what's new
- Tipo:
-
- Intervention
- Etapa:
-
- Review
- Grupo Editorial Cochrane:
-
Grupo Cochrane de Hipertensión
- Copyright:
-
- Copyright © 2017 The Cochrane Collaboration. Published by John Wiley & Sons, Ltd.
Cifras del artículo
Altmetric:
Citado por:
Autores
Contributions of authors
JG is the lead author, entered text of the review into Review Manager 5, assisted with searches appraised inclusion criteria and quality, and extracted and analyzed data.
LCS co‐ordinated the review, conducted the external correspondence, appraised inclusion criteria and quality, and extracted and analyzed data.
AA appraised inclusion criteria and quality of studies, and drafted the final review.
JJE appraised inclusion criteria and quality of studies, and drafted the final review.
IG appraised inclusion criteria and quality of studies, and interpreted the analysis from a methodological and policy perspective.
MJA appraised inclusion criteria and quality of studies, and interpreted the analysis from a clinical perspective.
JE appraised inclusion criteria and quality of studies, and drafted the final review.
All authors participated in the writing of discussion and conclusions.
Sources of support
Internal sources
-
Navarre Health Service and Health Department of the Government of Navarre, Spain.
Working time of authors (employees of the Government of Navarre). Facilities. Library services.
External sources
-
University of British Columbia, Vancouver, Canada.
Bibliographic searches. Methodological support.
-
European Social Fund Operational Programme 2007 to 2013, Other.
50% of the full research project, as salary for the Pharmacotherapy Research Coordinator in the Navarre Health Service (LCS).
Declarations of interest
None known.
Acknowledgements
We are grateful to Dr James M Wright and the Cochrane Hypertension Group for their encouragement, support and assistance.
Annalisa Perna, Istituto di Ricerche Farmacologiche Mario Negri, Milan, Italy, provided protocol and individual participant data for three studies (BENEDICT‐A 2004; BENEDICT‐B 2011; DEMAND 2011).
Institut de Recherches Internationales Servier, Courbevoie, France, and Prof Roland Asmar, Foundation ‐ Medical Research Institutes, Geneva, Switzerland, provided aggregate results of participants without previous antihypertensive treatment for three studies (REASON 2001; PREMIER 2003; PICXEL 2005).
Yuan Jinqiu, School of Public Health and Primary Care, The Chinese University of Hong Kong, checked inclusion criteria of an article written in Chinese.
Kateryna Kuzmytska Kalayda, general practitioner, Navarre Health Service, Tafalla, Spain, checked inclusion criteria of an article written in Russian.
Agustín Ciapponi and Demian Glujovsky, Institute of Clinical Effectiveness and Health Policy, Buenos Aires, Argentina, provided access to EROS.
Miguel Angel Imízcoz, retired cardiologist at Navarre Health Service, Pamplona, Spain, helped with the assessment of cardiovascular events reported in studies.
Version history
| Published | Title | Stage | Authors | Version |
| 2020 Feb 06 | First‐line combination therapy versus first‐line monotherapy for primary hypertension | Review | Javier Garjón, Luis Carlos Saiz, Ana Azparren, Idoia Gaminde, Mª José Ariz, Juan Erviti | |
| 2017 Jan 13 | First‐line combination therapy versus first‐line monotherapy for primary hypertension | Review | Javier Garjón, Luis Carlos Saiz, Ana Azparren, José J Elizondo, Idoia Gaminde, Mª José Ariz, Juan Erviti | |
| 2013 Jan 31 | Monotherapy versus combination therapy used as first‐line therapy for primary hypertension | Protocol | Javier Garjón, Ana Azparren, José J Elizondo, Idoia Gaminde, Mª José Ariz, Juan Erviti, Luis Carlos Saiz | |
Differences between protocol and review
We have improved the wording of the title of the review from "Monotherapy versus combination therapy used as first‐line therapy for primary hypertension" to "First‐line combination therapy versus first‐line monotherapy for primary hypertension".
We have corrected the unit of analysis from 'individual trials' to 'individual participants'.
Keywords
MeSH
Medical Subject Headings (MeSH) Keywords
Medical Subject Headings Check Words
Adult; Aged; Humans;
PICO

Study flow diagram.
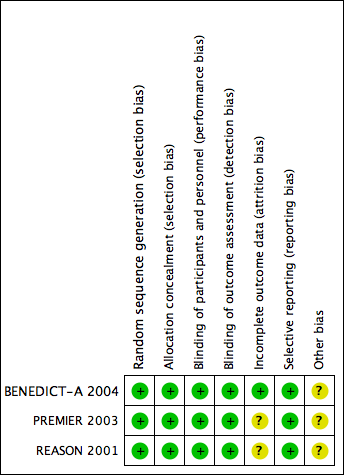
Risk of bias summary: review authors' judgements about each risk of bias item for each included study.
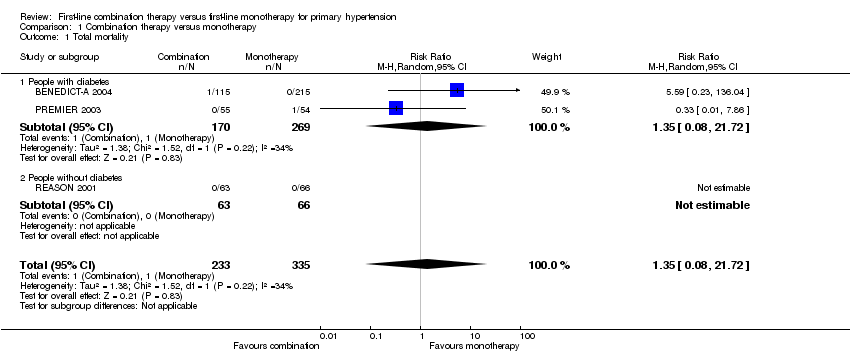
Comparison 1 Combination therapy versus monotherapy, Outcome 1 Total mortality.
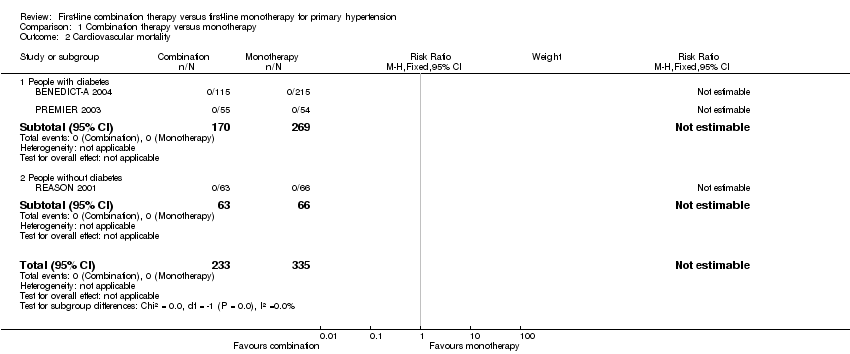
Comparison 1 Combination therapy versus monotherapy, Outcome 2 Cardiovascular mortality.

Comparison 1 Combination therapy versus monotherapy, Outcome 3 Cardiovascular events.
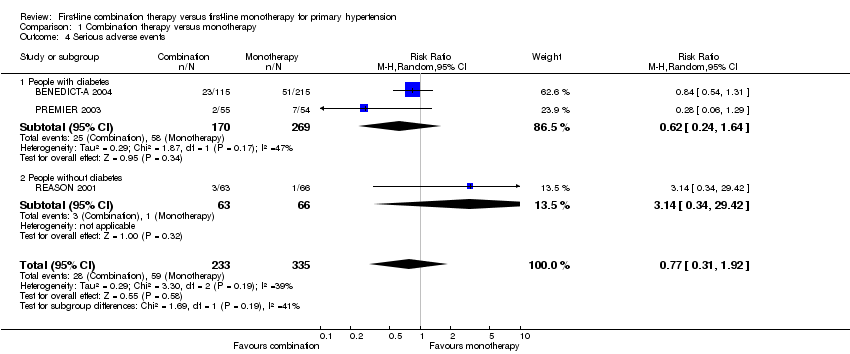
Comparison 1 Combination therapy versus monotherapy, Outcome 4 Serious adverse events.
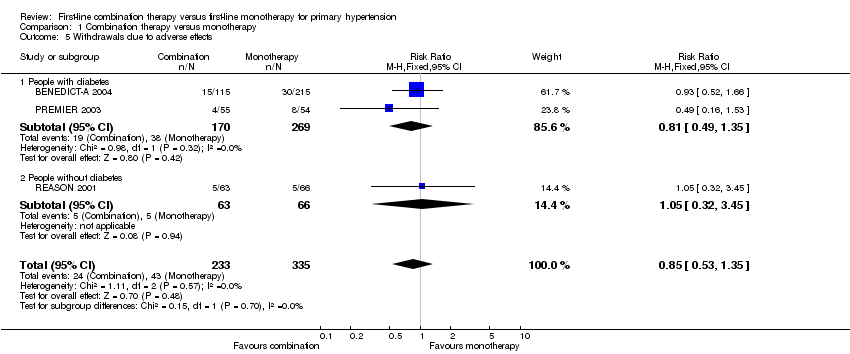
Comparison 1 Combination therapy versus monotherapy, Outcome 5 Withdrawals due to adverse effects.

Comparison 1 Combination therapy versus monotherapy, Outcome 6 Reaching target blood pressure at 1 year.

Comparison 1 Combination therapy versus monotherapy, Outcome 7 Systolic blood pressure change from baseline at end of 1 year.
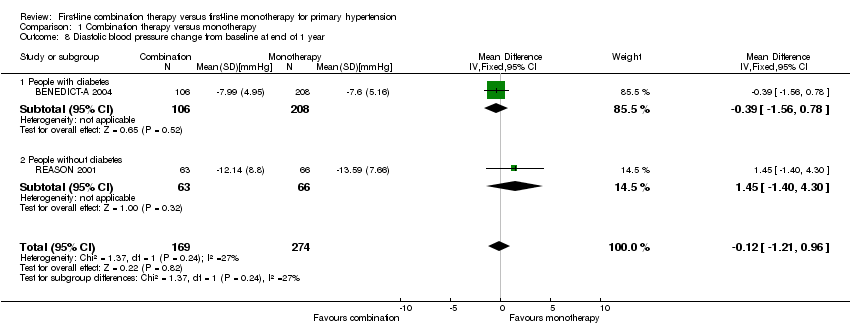
Comparison 1 Combination therapy versus monotherapy, Outcome 8 Diastolic blood pressure change from baseline at end of 1 year.

Comparison 2 Combination therapy versus monotherapy (men versus women), Outcome 1 Serious adverse events.

Comparison 2 Combination therapy versus monotherapy (men versus women), Outcome 2 Withdrawals due to adverse effects.
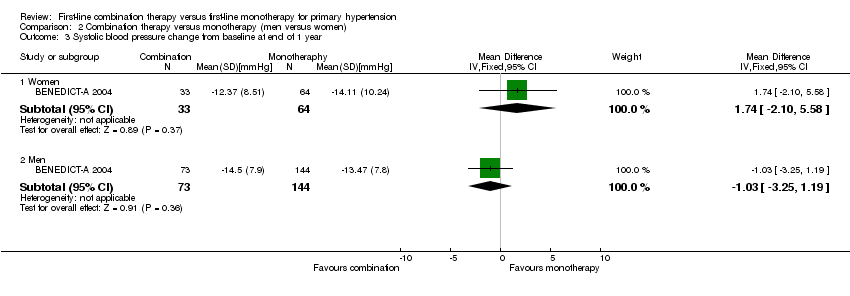
Comparison 2 Combination therapy versus monotherapy (men versus women), Outcome 3 Systolic blood pressure change from baseline at end of 1 year.

Comparison 2 Combination therapy versus monotherapy (men versus women), Outcome 4 Diastolic blood pressure change from baseline at end of 1 year.
| Combination therapy versus monotherapy for primary hypertension | ||||||
| Patient or population: people with primary hypertension | ||||||
| Outcomes | Illustrative comparative risks* (95% CI) | Relative effect | No of participants | Certainty of the evidence | Comments | |
| Assumed risk | Corresponding risk | |||||
| Monotherapy | Combination therapy | |||||
| Total mortality | 3 per 1000 | 4 per 1000 | RR 1.35 | 568 | ⊕⊝⊝⊝ | ‐ |
| Cardiovascular mortality | See footnote4 | See footnote4 | Not estimable | 568 | ⊕⊝⊝⊝ | ‐ |
| Cardiovascular events | 9 per 1000 | 9 per 1000 | RR 0.98 | 568 | ⊕⊝⊝⊝ | ‐ |
| Serious adverse events | 176 per 1000 | 136 per 1000 | RR 0.77 | 568 | ⊕⊝⊝⊝ | ‐ |
| Withdrawals due to adverse effects | 128 per 1000 | 109 per 1000 | RR 0.85 | 568 | ⊕⊝⊝⊝ | ‐ |
| *The basis for the assumed is the mean monotherapy group risk across studies. The corresponding risk (and its 95% confidence interval) is based on the assumed risk in the combination group and the relative effect of the intervention (and its 95% CI). | ||||||
| GRADE Working Group grades of evidence | ||||||
| 1 All data come from subgroups of participants not predefined in the original studies. Outcomes of our review were not the primary outcome in any included trial. | ||||||
| Characteristic | Treatment | Mean (standard deviation) | ||
| Number of participants | Combination | 115 | 55 | 63 |
| Monotherapy | 215 | 54 | 66 | |
| Total participants included in the trial (%) | Combination | 38.08% | 22.78% | 28.09% |
| Monotherapy | 35.54% | 22.54% | 25.82% | |
| Age (years) | Combination | 60.98 (7.62) | 57.27 (8.53) | 52.49 (12.68) |
| Monotherapy | 60.62 (8.36) | 59.93 (8.75) | 50.38 (10.57) | |
| Sex (% men) | Combination | 67.83% | 74.55% | 71.43% |
| Monotherapy | 69.30% | 77.78% | 62.12% | |
| Ethnicity (% white people) | Combination | 100.00% | 96.36% | 98.41% |
| Monotherapy | 100.00% | 88.89% | 93.94% | |
| Body mass index (kg/m2) | Combination | 28.68 (5.19) | 28.23 (3.18) | 26.85 (3.11) |
| Monotherapy | 28.34 (4.42) | 29.22 (3.51) | 26.99 (2.38) | |
| Systolic blood pressure (mm Hg) | Combination | 151.61 (9.70) | 154.56 (9.86) | 162.56 (11.24) |
| Monotherapy | 152.11 (11.57) | 154.04 (11.67) | 158.74 (12.84) | |
| Diastolic blood pressure (mm Hg) | Combination | 88.72 (7.17) | 90.98 (8.43) | 97.65 (6.89) |
| Monotherapy | 89.54 (6.32) | 91.00 (8.26) | 98.94 (5.07) | |
| Outcome or subgroup title | No. of studies | No. of participants | Statistical method | Effect size |
| 1 Total mortality Show forest plot | 3 | 568 | Risk Ratio (M‐H, Random, 95% CI) | 1.35 [0.08, 21.72] |
| 1.1 People with diabetes | 2 | 439 | Risk Ratio (M‐H, Random, 95% CI) | 1.35 [0.08, 21.72] |
| 1.2 People without diabetes | 1 | 129 | Risk Ratio (M‐H, Random, 95% CI) | 0.0 [0.0, 0.0] |
| 2 Cardiovascular mortality Show forest plot | 3 | 568 | Risk Ratio (M‐H, Fixed, 95% CI) | 0.0 [0.0, 0.0] |
| 2.1 People with diabetes | 2 | 439 | Risk Ratio (M‐H, Fixed, 95% CI) | 0.0 [0.0, 0.0] |
| 2.2 People without diabetes | 1 | 129 | Risk Ratio (M‐H, Fixed, 95% CI) | 0.0 [0.0, 0.0] |
| 3 Cardiovascular events Show forest plot | 3 | 568 | Risk Ratio (M‐H, Fixed, 95% CI) | 0.98 [0.22, 4.41] |
| 3.1 People with diabetes | 2 | 439 | Risk Ratio (M‐H, Fixed, 95% CI) | 0.62 [0.10, 3.95] |
| 3.2 People without diabetes | 1 | 129 | Risk Ratio (M‐H, Fixed, 95% CI) | 3.14 [0.13, 75.69] |
| 4 Serious adverse events Show forest plot | 3 | 568 | Risk Ratio (M‐H, Random, 95% CI) | 0.77 [0.31, 1.92] |
| 4.1 People with diabetes | 2 | 439 | Risk Ratio (M‐H, Random, 95% CI) | 0.62 [0.24, 1.64] |
| 4.2 People without diabetes | 1 | 129 | Risk Ratio (M‐H, Random, 95% CI) | 3.14 [0.34, 29.42] |
| 5 Withdrawals due to adverse effects Show forest plot | 3 | 568 | Risk Ratio (M‐H, Fixed, 95% CI) | 0.85 [0.53, 1.35] |
| 5.1 People with diabetes | 2 | 439 | Risk Ratio (M‐H, Fixed, 95% CI) | 0.81 [0.49, 1.35] |
| 5.2 People without diabetes | 1 | 129 | Risk Ratio (M‐H, Fixed, 95% CI) | 1.05 [0.32, 3.45] |
| 6 Reaching target blood pressure at 1 year Show forest plot | 3 | 548 | Risk Ratio (M‐H, Random, 95% CI) | 1.15 [0.52, 2.54] |
| 6.1 People with diabetes, target ≤ 120/80 mmHg | 1 | 314 | Risk Ratio (M‐H, Random, 95% CI) | 0.18 [0.01, 3.18] |
| 6.2 People with diabetes, target ≤ 140/90 mmHg | 1 | 105 | Risk Ratio (M‐H, Random, 95% CI) | 2.0 [1.24, 3.22] |
| 6.3 People without diabetes, target ≤ 140/90 mmHg | 1 | 129 | Risk Ratio (M‐H, Random, 95% CI) | 0.89 [0.62, 1.28] |
| 7 Systolic blood pressure change from baseline at end of 1 year Show forest plot | 3 | 548 | Mean Difference (IV, Random, 95% CI) | ‐2.06 [‐5.39, 1.27] |
| 7.1 People with diabetes | 2 | 419 | Mean Difference (IV, Random, 95% CI) | ‐2.54 [‐8.27, 3.19] |
| 7.2 People without diabetes | 1 | 129 | Mean Difference (IV, Random, 95% CI) | ‐2.33 [‐7.28, 2.62] |
| 8 Diastolic blood pressure change from baseline at end of 1 year Show forest plot | 2 | 443 | Mean Difference (IV, Fixed, 95% CI) | ‐0.12 [‐1.21, 0.96] |
| 8.1 People with diabetes | 1 | 314 | Mean Difference (IV, Fixed, 95% CI) | ‐0.39 [‐1.56, 0.78] |
| 8.2 People without diabetes | 1 | 129 | Mean Difference (IV, Fixed, 95% CI) | 1.45 [‐1.40, 4.30] |
| Outcome or subgroup title | No. of studies | No. of participants | Statistical method | Effect size |
| 1 Serious adverse events Show forest plot | 1 | Risk Ratio (M‐H, Fixed, 95% CI) | Subtotals only | |
| 1.1 Women | 1 | 103 | Risk Ratio (M‐H, Fixed, 95% CI) | 1.25 [0.52, 3.00] |
| 1.2 Men | 1 | 227 | Risk Ratio (M‐H, Fixed, 95% CI) | 0.75 [0.45, 1.24] |
| 2 Withdrawals due to adverse effects Show forest plot | 1 | Risk Ratio (M‐H, Fixed, 95% CI) | Subtotals only | |
| 2.1 Women | 1 | 103 | Risk Ratio (M‐H, Fixed, 95% CI) | 1.27 [0.43, 3.73] |
| 2.2 Men | 1 | 227 | Risk Ratio (M‐H, Fixed, 95% CI) | 0.83 [0.42, 1.66] |
| 3 Systolic blood pressure change from baseline at end of 1 year Show forest plot | 1 | Mean Difference (IV, Fixed, 95% CI) | Subtotals only | |
| 3.1 Women | 1 | 97 | Mean Difference (IV, Fixed, 95% CI) | 1.74 [‐2.10, 5.58] |
| 3.2 Men | 1 | 217 | Mean Difference (IV, Fixed, 95% CI) | ‐1.03 [‐3.25, 1.19] |
| 4 Diastolic blood pressure change from baseline at end of 1 year Show forest plot | 1 | Mean Difference (IV, Fixed, 95% CI) | Subtotals only | |
| 4.1 Women | 1 | 97 | Mean Difference (IV, Fixed, 95% CI) | 0.47 [‐1.96, 2.90] |
| 4.2 Men | 1 | 217 | Mean Difference (IV, Fixed, 95% CI) | ‐0.77 [‐2.08, 0.54] |