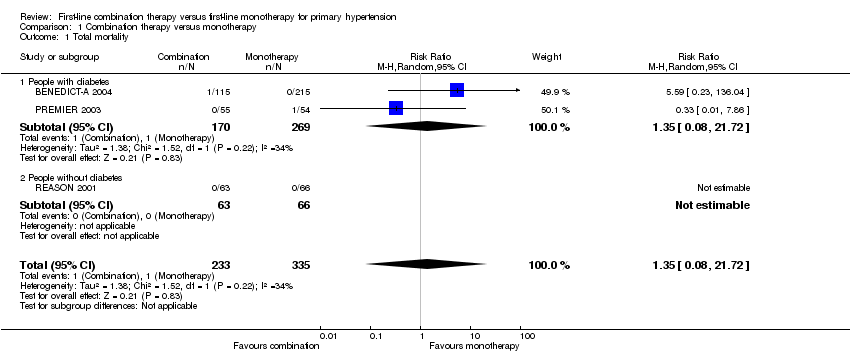
| 1 Total mortality Show forest plot | 3 | 568 | Risk Ratio (M‐H, Random, 95% CI) | 1.35 [0.08, 21.72] |
|
| 1.1 People with diabetes | 2 | 439 | Risk Ratio (M‐H, Random, 95% CI) | 1.35 [0.08, 21.72] |
| 1.2 People without diabetes | 1 | 129 | Risk Ratio (M‐H, Random, 95% CI) | 0.0 [0.0, 0.0] |
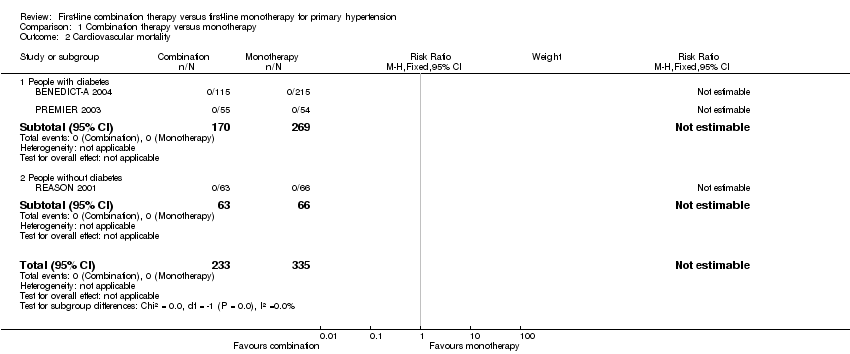
| 2 Cardiovascular mortality Show forest plot | 3 | 568 | Risk Ratio (M‐H, Fixed, 95% CI) | 0.0 [0.0, 0.0] |
|
| 2.1 People with diabetes | 2 | 439 | Risk Ratio (M‐H, Fixed, 95% CI) | 0.0 [0.0, 0.0] |
| 2.2 People without diabetes | 1 | 129 | Risk Ratio (M‐H, Fixed, 95% CI) | 0.0 [0.0, 0.0] |
| 3 Cardiovascular events Show forest plot | 3 | 568 | Risk Ratio (M‐H, Fixed, 95% CI) | 0.98 [0.22, 4.41] |
|
| 3.1 People with diabetes | 2 | 439 | Risk Ratio (M‐H, Fixed, 95% CI) | 0.62 [0.10, 3.95] |
| 3.2 People without diabetes | 1 | 129 | Risk Ratio (M‐H, Fixed, 95% CI) | 3.14 [0.13, 75.69] |
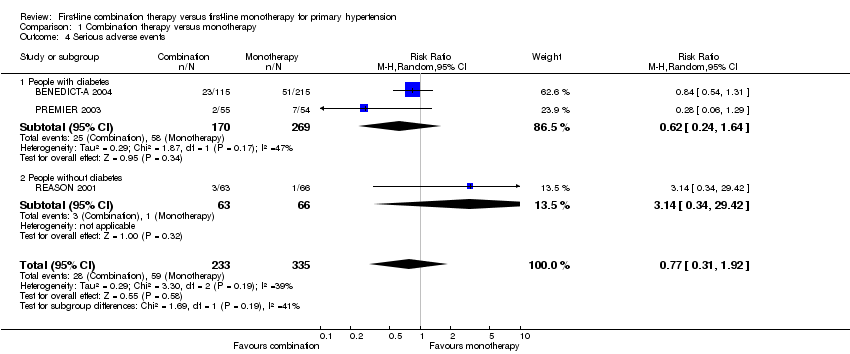
| 4 Serious adverse events Show forest plot | 3 | 568 | Risk Ratio (M‐H, Random, 95% CI) | 0.77 [0.31, 1.92] |
|
| 4.1 People with diabetes | 2 | 439 | Risk Ratio (M‐H, Random, 95% CI) | 0.62 [0.24, 1.64] |
| 4.2 People without diabetes | 1 | 129 | Risk Ratio (M‐H, Random, 95% CI) | 3.14 [0.34, 29.42] |
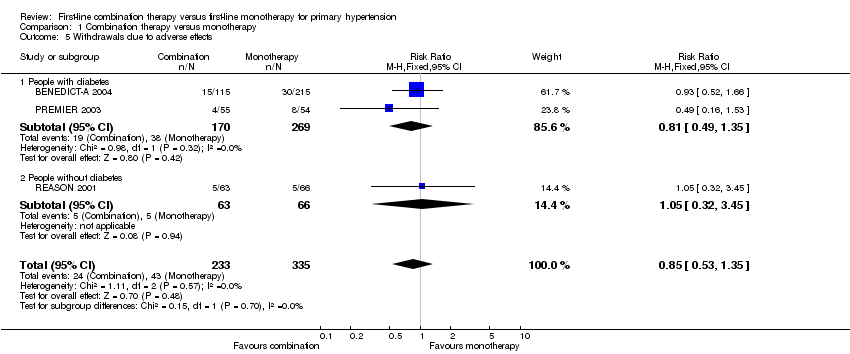
| 5 Withdrawals due to adverse effects Show forest plot | 3 | 568 | Risk Ratio (M‐H, Fixed, 95% CI) | 0.85 [0.53, 1.35] |
|
| 5.1 People with diabetes | 2 | 439 | Risk Ratio (M‐H, Fixed, 95% CI) | 0.81 [0.49, 1.35] |
| 5.2 People without diabetes | 1 | 129 | Risk Ratio (M‐H, Fixed, 95% CI) | 1.05 [0.32, 3.45] |
| 6 Reaching target blood pressure at 1 year Show forest plot | 3 | 548 | Risk Ratio (M‐H, Random, 95% CI) | 1.15 [0.52, 2.54] |
|
| 6.1 People with diabetes, target ≤ 120/80 mmHg | 1 | 314 | Risk Ratio (M‐H, Random, 95% CI) | 0.18 [0.01, 3.18] |
| 6.2 People with diabetes, target ≤ 140/90 mmHg | 1 | 105 | Risk Ratio (M‐H, Random, 95% CI) | 2.0 [1.24, 3.22] |
| 6.3 People without diabetes, target ≤ 140/90 mmHg | 1 | 129 | Risk Ratio (M‐H, Random, 95% CI) | 0.89 [0.62, 1.28] |
| 7 Systolic blood pressure change from baseline at end of 1 year Show forest plot | 3 | 548 | Mean Difference (IV, Random, 95% CI) | ‐2.06 [‐5.39, 1.27] |
|
| 7.1 People with diabetes | 2 | 419 | Mean Difference (IV, Random, 95% CI) | ‐2.54 [‐8.27, 3.19] |
| 7.2 People without diabetes | 1 | 129 | Mean Difference (IV, Random, 95% CI) | ‐2.33 [‐7.28, 2.62] |
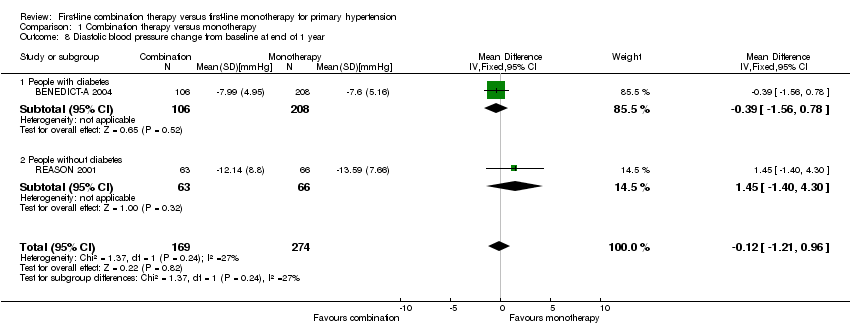
| 8 Diastolic blood pressure change from baseline at end of 1 year Show forest plot | 2 | 443 | Mean Difference (IV, Fixed, 95% CI) | ‐0.12 [‐1.21, 0.96] |
|
| 8.1 People with diabetes | 1 | 314 | Mean Difference (IV, Fixed, 95% CI) | ‐0.39 [‐1.56, 0.78] |
| 8.2 People without diabetes | 1 | 129 | Mean Difference (IV, Fixed, 95% CI) | 1.45 [‐1.40, 4.30] |