Objetivos de presión arterial para la hipertensión en adultos mayores
Resumen
Antecedentes
Ocho de cada 10 ensayos principales sobre antihipertensivos en pacientes adultos mayores intentaron lograr una presión arterial (PA) sistólica objetivo menor que 160 mmHg. En conjunto, estos ensayos demostraron el beneficio del tratamiento, en comparación con ningún tratamiento, para un adulto mayor con PA mayor que 160 mmHg. Sin embargo, comúnmente se aplica un objetivo de PA aun menor que 140 mmHg a todos los grupos etarios. En la actualidad, no se sabe si un objetivo de PA más bajo o más alto se asocia con mejores resultados cardiovasculares en pacientes adultos mayores.
Objetivos
Evaluar los efectos de un objetivo de PA superior (menos de 150 a 160/95 a 105 mmHg) en comparación con el objetivo de PA inferior de menos de 140/90 mmHg en adultos hipertensos a partir de los 65 años de edad.
Métodos de búsqueda
El especialista en información del Grupo Cochrane de Hipertensión (Cochrane Hypertension Group) buscó ensayos controlados aleatorios en las siguientes bases de datos hasta febrero de 2017: registro especializado del Grupo Cochrane de Hipertensión (Cochrane Hypertension Specialised Register), MEDLINE, Embase, ClinicalTrials.gov y en la World Health Organization International Clinical Trials Registry Platform. También se contactó con los autores de los trabajos pertinentes con respecto a otros trabajos publicados y no publicados.
Criterios de selección
Ensayos aleatorios, de al menos un año de duración, realizados en adultos hipertensos a partir de los 65 años de edad, que informen el efecto sobre la mortalidad y la morbilidad de un objetivo terapéutico de PA sistólica o diastólica más alto (medidas ambulatorias, en el domicilio o en el consultorio) en el intervalo de PA sistólica de menos de 150 a 160 mmHg o diastólica de menos de 95 a 105 mmHg en comparación con un objetivo terapéutico de PA más bajo, de menos de 140/90 mmHg o más bajo.
Obtención y análisis de los datos
Dos autores de la revisión, de forma independiente, examinaron y seleccionaron los ensayos para la inclusión, evaluaron el riesgo de sesgo y extrajeron los datos. Se combinaron los datos para los resultados dicotómicos mediante el cociente de riesgos (CR) con intervalo de confianza (IC) del 95%, y para los resultados continuos se usó la diferencia de medias (DM). Los resultados primarios fueron: la mortalidad por todas las causas, el accidente cerebrovascular, la hospitalización y los eventos adversos graves cardiovasculares. Los resultados secundarios fueron: mortalidad cardiovascular, mortalidad no cardiovascular, hospitalización no planificada, cada componente de los eventos adversos graves cardiovasculares por separado (incluida la enfermedad cerebrovascular, la enfermedad cardíaca, la vasculopatía y la insuficiencia renal), los eventos adversos graves totales, los eventos adversos menores totales, los retiros por los efectos adversos, la PA sistólica alcanzada y la PA diastólica alcanzada.
Resultados principales
Se hallaron e incluyeron tres ensayos aleatorios no cegados en 8221 pacientes adultos mayores (edad promedio 74,8 años), en que se compararon objetivos de PA mayores de menos de 150/90 mmHg (dos ensayos) y menos de 160/90 mmHg (un ensayo) con un objetivo inferior de menos de 140/90 mmHg. El tratamiento de los dos objetivos diferentes de PA en dos a cuatro años no logró una diferencia en ninguno de los resultados primarios, incluida la mortalidad por todas las causas (CR 1,24; IC del 95%: 0,99 a 1,54), el accidente cerebrovascular (CR 1,25; IC del 95%: 0,94 a 1,67) y los eventos adversos graves cardiovasculares totales (CR 1,19; IC del 95%: 0,98 a 1,45). Sin embargo, los intervalos de confianza del 95% de estos resultados indican que el objetivo de PA inferior quizás no sea peor y ofrezca un beneficio clínicamente importante. Se consideró que todas las comparaciones se basaban en evidencia de baja calidad. No estaban disponibles los datos sobre los efectos adversos de todos los ensayos y no diferentes, incluidos los eventos adversos graves totales, los eventos adversos menores totales y los retiros debidos a los efectos adversos.
Conclusiones de los autores
En la actualidad, la evidencia es insuficiente para saber si un objetivo superior de PA (menos de 150 a 160/95 a 105 mmHg) o un objetivo de PA inferior (menos de 140/90 mmHg) es mejor para los pacientes adultos mayores con hipertensión. Se necesitan ensayos adicionales de buena calidad que evalúen los objetivos de PA en esta población.
PICO
Resumen en términos sencillos
Objetivos de presión arterial para la hipertensión en adultos mayores
Pregunta de la revisión
¿Cuál es el objetivo de presión arterial (PA) óptimo para el tratamiento de pacientes adultos mayores con hipertensión?
Antecedentes
La PA elevada en pacientes adultos mayores es frecuente, y valores más altos aumentan el riesgo de eventos adversos como el accidente cerebrovascular, el ataque cardíaco, la insuficiencia cardíaca y la muerte. Se ha demostrado que la disminución de la PA con fármacos disminuye el riesgo de estos eventos adversos graves aunque se desconoce el objetivo de PA óptimo para el tratamiento de los pacientes adultos mayores.
Características de los estudios
Se recuperaron sistemáticamente todos los ensayos aleatorios que compararon el efecto de un objetivo mayor de PA (valor de PA superior menor de 150 a 160 mmHg) con un objetivo de PA inferior convencional (valor de PA superior menor de 140 mmHg) en los pacientes mayores de 65 años. La evidencia está actualizada hasta febrero de 2017.
Resultados clave
Se hallaron tres ensayos aleatorios (el valor de referencia de la evidencia médica) que investigaron esta pregunta en un total de 8221 pacientes adultos mayores (edad promedio 75 años; 59% de mujeres). No se encontró una diferencia entre el objetivo más alto y más bajo convencional de PA; sin embargo, no pudo descartarse una diferencia importante a favor del objetivo de PA más bajo.
Calidad de la evidencia
Se consideró que la evidencia agrupada era de baja calidad y no se pudo responder a la pregunta de cuál objetivo de PA era más conveniente. Se necesitan más ensayos de buena calidad que aborden esta cuestión.
Authors' conclusions
Summary of findings
| Higher BP target (< 150‐160/95‐105 mmHg) compared with lower BP target (< 140/90 mmHg) for cardiovascular risk reduction | ||||||
| Patient or population: older adults with primary hypertension Settings: outpatient Intervention: higher BP target < 150‐160)/95‐105 mmHg Comparison: lower BP target < 140/90 mmHg | ||||||
| Outcomes | Illustrative comparative risks1 | Relative effect | No of participants | Quality of the evidence | Comments | |
| Assumed | Corresponding | |||||
| Lower | Higher | |||||
| All‐cause mortality Mean follow‐up: 2.6 years | 31 per 1000 | 39 per 1000 | RR 1.24 (0.99 to 1.54) | 8221 | ⊕⊕⊝⊝ | |
| Stroke Mean follow‐up: 2.6 years | 20 per 1000 | 25 per 1000 | RR 1.25 (0.94 to 1.67) | 8221 | ⊕⊕⊝⊝ | |
| Cardiovascular serious adverse events Mean follow‐up: 2.6 years | 42 per 1000 | 50 per 1000 | RR 1.19 (0.98 to 1.45) | 8221 | ⊕⊕⊝⊝ | |
| Withdrawals due to adverse effects Mean follow‐up: 2.4 years | 17 per 1000 | 14 per 1000 | RR 0.83 (0.58 to 1.19) | 7497 | ⊕⊕⊝⊝ | |
| The basis for the assumed risk is provided in footnote below. The corresponding risk (and its 95% CI) is based on the assumed risk in the comparison group and the relative effect of the intervention (and its 95% CI). | ||||||
| GRADE Working Group grades of evidence | ||||||
| 1Rationale for our choice of assumed risk: the risk of cardiovascular events in a hypertensive general population varies considerably across countries (Finegold 2013). With no reason to favour one country over another we have opted to use (now and for future updates) an assumed risk, which is the average across studies included in this review. | ||||||
Background
Description of the condition
Hypertension (elevated blood pressure (BP)) is a common condition and the second most frequent reason for visiting a family physician in Canada (Chan 2005). Although hypertensive individuals are generally asymptomatic, high BP is associated with higher rates of cardiovascular morbidity and mortality in the population at large (Lewington 2002) and it has been well demonstrated that lowering BP with antihypertensive drugs can reduce cardiovascular morbidity and mortality (Musini 2009; Wright 2009) in people with moderate to severe hypertension. Hence primary care visits for hypertension focus on prevention (lowering overall cardiovascular risk) and frequently involve the adding or adjusting of antihypertensive medication to obtain BPs in a range believed to put the patient at lowest risk for adverse health outcomes.
By convention the target BP for the treatment of otherwise healthy adults is the same as the threshold used to diagnose hypertension (i.e. a target BP less than 140/90 mmHg). Yet the risk and benefit of antihypertensive therapy can be expected to vary across patient populations. In people over the age of 80 years, for example, the evidence for a mortality benefit from BP lowering is conflicting (Beckett 2008; Musini 2009). The BP target that will minimise adverse events in older adults is unknown.
Eight out of 10 major antihypertensive trials in elderly people targeted a systolic BP of less than 160 mmHg (Mancia 2009). These trials (with the exception of the lone trial to target a systolic BP of less than 140 mmHg (JATOS 2008) show improvement in clinical endpoints and lend support to a systolic BP target for older adults of less than 160 mmHg. However a BP target of less than 140/90 mmHg is commonly applied to all people, irrespective of age and, according to a consensus document prepared by the American College of Cardiology Foundation and the American Heart Association, use of this lower BP target in older adults is based only on expert opinion and not on data from randomised controlled trials (RCTs) (Aronow 2011). By performing this review we hope to determine, for older adults, whether differences in BP targets lead to important differences in clinical outcomes.
Description of the intervention
Physicians tailor the introduction and dosing of BP‐lowering medication to a person's BP readings. Such readings can be obtained from automated 24‐hour ambulatory BP monitors, several days of recordings from patient‐actuated home BP machines or same day measurements in the physician's office (single or multiple readings, acquired either by a healthcare worker or an automated device). In practice BP targets (though not based on evidence) may vary with the setting in which BP is measured (e.g. home BP targets may be 5 mmHg lower) and may focus on systolic BP, diastolic BP, or both (Daskalopoulou 2012).
For the purpose of this review we compared a higher (intervention) systolic or diastolic BP target of less than 150 to 160/95 to 105 mmHg to a lower (control) BP target of less than 140/90 mmHg irrespective of how BP was measured.
How the intervention might work
The elderly are a distinct population with greater comorbidity, more polypharmacy, and greater potential risk from low organ perfusion pressure (e.g. cognitive impairment, or postural hypotension resulting in falls and fractures) (Hilmer 2007). More aggressive BP targets mean more medication use and greater potential for adverse drug‐drug and drug‐disease interactions (Cadieux 1989).
Occlusive vascular disease can also be expected to be more common in the elderly. Conceivably, in people with focal obstructions in blood flow, a reduction in overall BP may further compromise the perfusion, performance and health of that already under‐perfused organ ‐ increasing the potential for adverse effects beyond what is seen in typical clinical trial populations (which are generally comprised of younger and healthier participants) (Masoudi 2003; Van Spall 2007).
Cohort studies lend support to speculation that older adults may do better with less aggressive BP targets. In particular, adults over the age of 85 years have been shown to have slower rates of cognitive and physical decline when systolic BP is higher (Sabayan 2012) and the frailest older adults (as measured by gait speed) have lower mortality when hypertension is present (Odden 2012). Such studies have multiple potential explanations but one of these explanations is that the risk/benefit ratio of antihypertensive treatment may be different in the elderly ‐ with maximum overall benefit occurring when less aggressive antihypertensive therapy is pursued and somewhat higher BPs are achieved.
Why it is important to do this review
Given how common the treatment of hypertension is, given our aging population, and given how poorly represented older adults are in most of the large RCTs that guide clinical practice, it is important to explore whether older adults might do just as well, or better, with less aggressive pharmacotherapy for hypertension.
Objectives
To assess the effects of a higher BP target compared to a lower BP target of less than 140/90 mmHg in hypertensive adults 65 years of age or older.
Methods
Criteria for considering studies for this review
Types of studies
Open‐label RCTs (including parallel‐group or cross‐over trials) of at least one year's duration. As it is necessary for clinicians to know the BP target to which a patient is randomised in order to adjust their medication, it is assumed that any existing trials will not blind the participant or the care provider.
Types of participants
Adults 65 years of age or older who are either:
-
already being treated for hypertension; or
-
have elevated BP (BP 140/90 mmHg or higher) documented in a standard way on at least two occasions.
Types of interventions
A higher systolic or diastolic BP treatment target (whether ambulatory, home, or office measurements) in the range of systolic BP less than 150 to 160 mmHg or diastolic BP less than 95 to 105 mmHg. Valid comparators would include any BP treatment target that is less than 140/90 mmHg or lower.
Types of outcome measures
Primary outcomes
-
All‐cause mortality
-
Stroke (fatal and non‐fatal, excluding transient ischaemic attack)
-
Institutionalisation (i.e. nursing home admission)
-
Cardiovascular serious adverse events, including: cerebrovascular disease (infarction, haemorrhage, transient ischaemic attack), cardiac disease (myocardial infarction, new treatment for angina or congestive heart failure, sudden death), vascular disease (enlarging or rupturing or dissecting aneurysms of the aorta, treatment for occlusive arterial disease) and renal failure (acute or chronic doubling of serum creatinine or dialysis)
We chose the first three outcomes because we believe death (from any cause) and disability/loss of independence to be the most important outcomes from the perspective of older adults. We chose our fourth outcome because we believe a composite measure of serious cardiovascular events would have the greatest statistical power to show a difference between therapies.
Secondary outcomes
-
Cardiovascular mortality
-
Non‐cardiovascular mortality
-
Unplanned hospitalisation
-
Each component of 'cardiovascular serious adverse events' separately
-
cerebrovascular disease
-
cardiac disease
-
vascular disease
-
renal failure
-
-
Total serious adverse events (death, hospitalisation and/or events requiring medical treatment)
-
Total minor adverse events (symptoms not requiring medical treatment such as cough, fatigue or light‐headedness)
-
Withdrawals due to adverse effects
-
Systolic BP achieved (mean)
-
Diastolic BP achieved (mean)
Search methods for identification of studies
Electronic searches
The Cochrane Hypertension Information Specialist conducted systematic searches in the following databases for RCTs without language, publication year or publication status restrictions:
-
the Cochrane Hypertension Specialised Register via the Cochrane Register of Studies (CRS‐Web) (searched 3 February 2017);
-
the Cochrane Central Register of Controlled Trials (CENTRAL; 2017, Issue 2) via the Cochrane Register of Studies (CRS‐Web) (searched 3 February 2017);
-
MEDLINE Ovid (from 1946 onwards), MEDLINE Ovid Epub Ahead of Print, and MEDLINE Ovid In‐Process & Other Non‐Indexed Citations (searched 3 February 2017);
-
Embase Ovid (searched 3 February 2017);
-
ClinicalTrials.gov (www.clinicaltrials.gov) searched 3 February 2017);
-
World Health Organization International Clinical Trials Registry Platform (ICTRP) (www.who.int/trialsearch) searched 3 February 2017).
The Information Specialist modelled subject strategies for databases on the search strategy designed for MEDLINE. Where appropriate, they were combined with subject strategy adaptations of the sensitivity and precision‐maximising strategy designed by Cochrane for identifying randomised controlled trials (as described in the Cochrane Handbook for Systematic Reviews of Interventions Version 5.1.0, Box 6.4.d. (Lefebvre 2011)). Search strategies for major databases are provided in Appendix 1.
Searching other resources
We checked all references in the relevant identified trials and attempted to contact the study authors to identify any additional published or unpublished data. We also searched ICTRP in an attempt to uncover unpublished trials; searched ISI Web of Science for papers citing the studies included in this review; and contacted the Food and Drug Administration (FDA) to ask if they had any related clinical trial information in their possession.
Data collection and analysis
Selection of studies
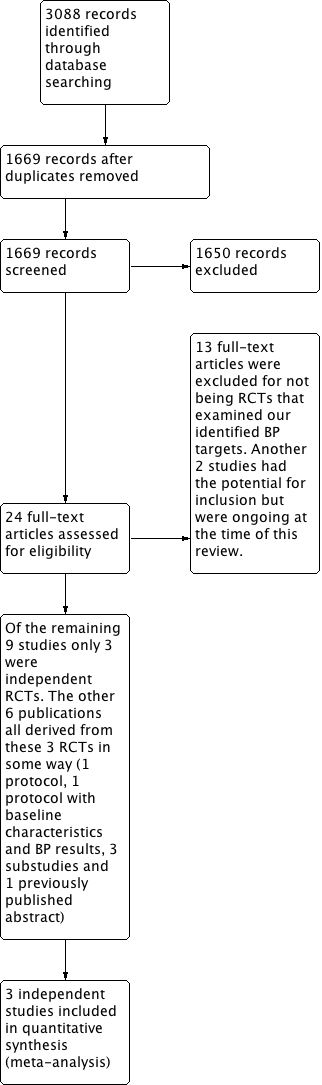
Two review authors independently screened the titles and abstracts of all articles identified by the search algorithm, obtained the full text of all potentially relevant studies and determined which studies met the inclusion criteria. A third author adjudicated any disagreements regarding study inclusion. A full accounting of the search results is provided in Figure 1 in the form of a PRISMA study flow diagram (Liberati 2009).
Study flow diagram
Data extraction and management
Two review authors independently extracted data onto specially designed forms. One review author entered the data into Review Manager 5 (RevMan 5) software (RevMan 2014) and a second review author independently checked the data entry.
Assessment of risk of bias in included studies
Two review authors independently assessed the risk of bias in the included studies using the Cochrane recommended tool (Higgins 2011). A third review author adjudicated any disagreements.
We assessed the risk of bias for each study according to six domains: sequence generation, allocation concealment, blinding, incomplete outcome data, selective outcome reporting, and 'other sources of bias'. We rated each domain as high, low or unclear risk of bias. We presented the risk of bias assessment in a table for each study, and provided a graph displaying risk of bias across studies and domains, respectively (Figure 2).

Risk of bias summary: review authors' judgements about each risk of bias item for each included study
Measures of treatment effect
We measured most of our outcomes as the proportion of participants suffering an event. This includes mortality (all‐cause, cardiovascular, non‐cardiovascular), stroke, institutionalisation, total serious adverse events, cardiovascular serious adverse events and its individual components, total minor adverse events, withdrawals due to adverse effects, and unplanned hospitalisation. For achieved systolic and diastolic BPs we used the intervention and control group means.
Unit of analysis issues
For each included study the unit of analysis and the unit of randomisation (expected to be the participant) needed to match to prevent the introduction of bias. For any study in which this was not the case, our intention was to qualitatively describe the findings but not include such studies in meta‐analyses. For all included studies the unit of analysis and the unit of randomisation matched.
Dealing with missing data
We attempted to contact authors of included studies for any necessary clarification, and to request any missing data. If data were still missing after author contact, and assumed to be missing at random (i.e. provided it appeared that the reason data were missing had nothing to do with the data values themselves) then our intention was to analyse only available data. If we believed that persistently missing data were missing for non‐random reasons, then our intention was to impute values for these missing data using methods such as assigning a poor value to each, assigning the mean value, or using the last value carried forward. The decision on how to impute such values was to depend on what was missing, and on the study design. No missing values were identified for which these steps were needed.
Assessment of heterogeneity
We assessed heterogeneity using a Chi2 test on n‐1 degrees of freedom and by calculating the I2 statistic (Higgins 2003). Where statistical heterogeneity was found we examined the trial methodology, the intervention, and the study populations with an eye to finding potential explanations for observed variation (Deeks 2011). Subgroup analysis was not possible as this information was not available for the included trials.
Assessment of reporting biases
We did not prepare any funnel plots as we only identified three studies (we had previously stated in the protocol that such a graph would be produced if 10 or more studies were found).
Data synthesis
We combined trial data identified for inclusion in this review using the most current version of the Cochrane statistical package, RevMan 5 (RevMan 2014). We anticipated a similar magnitude of effect across studies and accordingly performed only fixed‐effect meta‐analyses.
Subgroup analysis and investigation of heterogeneity
None of the three included trials reported outcomes in a way that permitted subgroup analysis. As stated in our protocol, when possible, we intended to use subgroup analysis to search for variation in treatment effect and to explore possible sources of heterogeneity. Prespecified subgroups related to clinical presentation included gender, age (under/over 75 years), and frailty (via a median split of either integrative physical measures such as gait speed or of composite clinical frailty scores). Prespecified subgroups related to method of treatment included the class of medication with which the treatment protocol began (e.g. calcium channel blocker versus angiotensin receptor blocker (ARB)). Although we identified that we may perform additional subgroup analyses we stated that such post‐hoc analyses would be merely hypothesis‐generating.
Sensitivity analysis
Where heterogeneity existed, we presented results both with and without the outlying trial(s). Where high risk of bias existed, we presented results both with and without the high‐risk trial(s).
Results
Description of studies
See: Characteristics of included studies; Characteristics of excluded studies.
Results of the search
A search of the Database of Abstracts of Reviews of Effects (DARE) revealed no prior reviews specific to BP targets in older adults. Search results from the Cochrane Hypertension Specialised Register, CENTRAL, MEDLINE, MEDLINE In‐Process, Embase, and ClinicalTrials.gov revealed 1669 citations (3088 prior to deduplication). We screened titles and abstracts for all 1669 citations. Of these, the review authors obtained and reviewed 24 full papers. We excluded 13 studies (see Characteristics of excluded studies) and 2 potentially eligible studies were ongoing (see Characteristics of ongoing studies). Of the remaining nine publications, only three were independent RCTs meeting our inclusion criteria. The other six publications were derived from these three RCTs in some way (one protocol, one protocol that included participant characteristics and BP results in the first year, three substudies, and one previously published abstract) (Characteristics of included studies). Contacting the FDA, searching ISS Web of Science for papers citing the studies included in this review, and a search of the International Clinical Trials Registry Platform (WHO‐ICTRP) revealed no additional published or unpublished studies.
Included studies
The two larger of the three included trials (4418 and 3079 participants in analysis) were in Japanese outpatients with either systolic hypertension irrespective of diastolic BP (JATOS 2008) or isolated systolic hypertension (VALISH 2010). These participants were in their mid 70s, and had baseline BPs of 170/90 (JATOS 2008) and 170/81 (VALISH 2010). Around 61% of these participants were women, around 12% had diabetes and around 16% smoked. The smaller trial (724 participants in analysis) enrolled Chinese general practice patients with either systolic or diastolic hypertension (Wei 2013). Mean baseline BP was 160/84 mmHg and these participants differed from the Japanese trials in being predominantly men (66%) with twice as many people with diabetes (23%) and more that smoked (25%).
The two Japanese trials compared conventional systolic BP targets of less than 140 mmHg to higher systolic targets of less than 150mmHg (VALISH 2010) or less than 160 mmHg (JATOS 2008). The Chinese trial compared a conventional strict mixed systolic and diastolic BP target of less than 140/90 mmHg to less than 150/90 mmHg (Wei 2013). Achieved BP was similar in the lower BP groups for all three trials (around 136/75 at study conclusion) but achieved BP differed substantially in the higher BP group, being 142/76.5 mmHg in VALISH 2010, 145.6/78.1 in JATOS 2008, and 149.7/82.1 in Wei 2013.
In two of the trials the study protocol mandated that participants be initially switched to, or started on (if previously untreated), a specified study medication. These medications were either the long‐acting dihydropyridine calcium antagonist efonidipine (JATOS 2008) or the angiotensin II type 1 receptor blocker valsartan (VALISH 2010). In Wei 2013 it is unclear how the initial choice of medication was made but could include single drug treatment of either an angiotensin‐converting‐enzyme (ACE) inhibitor (enalapril), a beta‐blocker (bisoprolol or metoprolol), a calcium channel blocker (amlodipine), or a diuretic (indapamide). In all three studies drug doses were adjusted upwards and numbers of drugs increased until BP control was achieved according to the allocated BP target. Trial protocols led to all JATOS 2008 subjects being on efonidipine with 36% of these subjects also receiving an ACE/ARB (plus 13% received a betablocker and 12% received a diuretic). VALISH 2010 subjects all took valsartan, with 37% also taking a calcium channel blocker (plus 12% taking a diuretic and 5% taking a betablocker). Wei 2013 subjects were more balanced as to use of different antihypertensive classes (ACEI 31%, calcium channel blocker 28%, beta blocker 20%, diuretic 20%).
All three studies were prospective, randomised, parallel, and open‐label with average follow‐up ranging from two years (JATOS 2008) to four years (Wei 2013). All studies used a primary outcome that was a composite of major adverse cardiovascular events and all composites included fatal and nonfatal stroke and myocardial infarction, and death from other cardiovascular causes (sudden death, congestive heart failure). The two Japanese trials also included within the composite other hospitalisations for cardiovascular disease (e.g. angina, aortic dissection) and renal dysfunction.
Excluded studies
In all cases, we excluded studies because they were not randomised trials using the conventional and relaxed BP targets identified for this review.
Risk of bias in included studies
We carried out the 'Risk of bias' assessment as outlined in the methods and summarised our assessments in Figure 2.
Allocation
The risk of allocation bias was unclear in two of the trials (VALISH 2010 and Wei 2013) largely because of inadequate description in the methods.
Blinding
We rated the risk from blinding high for all three trials, since neither clinicians nor participants could be blinded to the allocated BP target. However outcome assessors were blinded, which mitigates concerns to some degree.
Incomplete outcome data
Although it was generally unclear how participants who were lost to follow‐up were handled in the analysis, all trials had fairly low rates of attrition. The highest rate of attrition was in VALISH 2010 (5.9%), which we rated at unclear risk of bias because more participants dropped out than experienced the primary outcome and no sensitivity analysis was performed.
Selective reporting
Although we rated all trials as low risk of reporting bias for their identified primary and secondary outcomes, Wei 2013 did not provide total serious adverse events and reported adverse events only selectively.
Other potential sources of bias
We rated VALISH 2010 at unclear risk of bias because it did not describe how participants were selected for a per‐protocol analysis (with participants excluded "...according to a judging criteria drawn up by the Statistical Committee of this study"). We rated Wei 2013 as high risk of bias because an initial analysis of this study was published in abstract form with no mention of Wei (the lead author of the final publication) as a co‐investigator. E‐mail communication with authors of Wei 2013 confirm that the lead author was a late addition to the project and hence, in our view, unable to meaningfully take responsibility for study design and conduct.
Effects of interventions
See: summary of findings Table for the main comparison
Primary Outcomes
1. All‐cause mortality
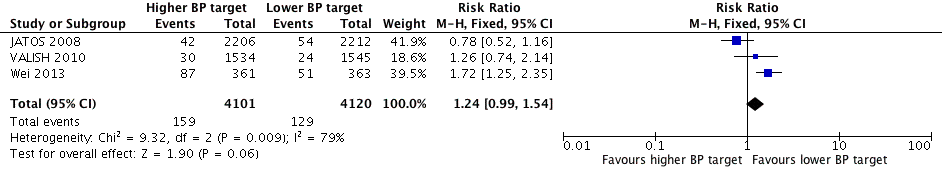
Although all three studies provided data on total mortality, only results from Wei 2013 were statistically significant, finding the higher BP target to be inferior (RR 1.72, 95% CI 1.25 to 2.35). In contrast, JATOS 2008 found a non‐significant difference in the opposite direction, favouring the lower target (RR 0.78, 95% CI 0.52 to 1.16). Pooling data produced a nonsignificant difference (RR 1.24, 95% CI 0.99 to 1.54) with high heterogeneity (I2= 79%) (Figure 3, Analysis 1.1).

Forest plot of comparison higher (< 150‐160/95‐100 mmHg) versus lower (< 140/90 mmHg) BP target, outcome 1. All‐cause mortality.
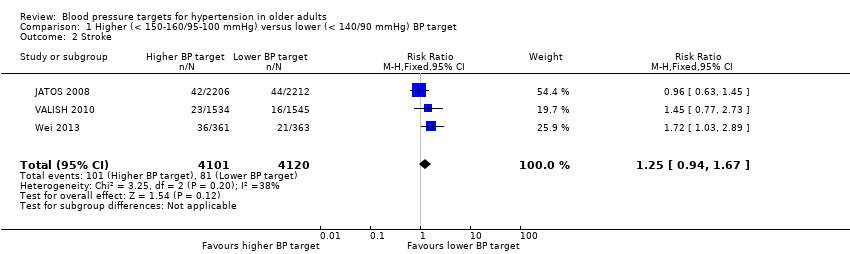
2. Stroke (fatal and non‐fatal, excluding transient ischaemic attack)
All three studies provided data on stroke and only results from Wei 2013 were statistically significant, finding the higher BP target to be inferior. Pooling data produced a nonsignificant difference (RR 1.25, 95% CI 0.94 to 1.67) with moderate heterogeneity (I2 = 38%) (Figure 4, Analysis 1.2).
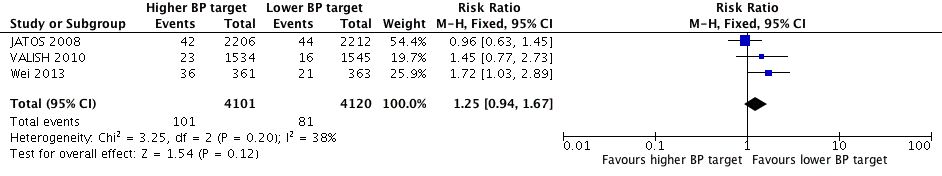
Forest plot of comparison higher (< 150‐160/95‐100 mmHg) versus lower (< 140/90 mmHg) BP target, outcome 2. Stroke
3. Institutionalisation (i.e. nursing home admission)
Although we believe this to be an important outcome for older adults it was not reported in any of the included studies.
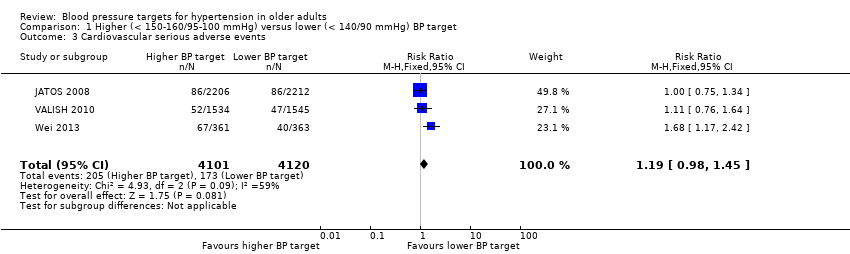
4. Cardiovascular serious adverse events (cerebrovascular disease, cardiac disease, vascular disease and renal failure)
All three studies provided data on cardiovascular serious adverse events and only Wei 2013 was statistically significant, finding the higher BP target to be inferior. Pooling data produced a nonsignificant difference (RR 1.19, 95% CI 0.98 to 1.45) with high heterogeneity (I2 = 59%) (Figure 5, Analysis 1.3).

Forest plot of comparison higher (< 150‐160/95‐100 mmHg) versus lower (< 140/90 mmHg) BP target, outcome 4. Cardiovascular serious adverse events
Secondary Outcomes
1. Cardiovascular mortality
All three studies provided data on cardiovascular mortality and only results from Wei 2013 were statistically significant, finding the higher BP target to be inferior. Pooling data produced a statistically significant difference showing the higher target to be inferior (RR 1.52, 95% CI 1.06 to 2.19) with high heterogeneity (I2 = 52%) (Figure 6, Analysis 1.4).

Forest plot of comparison higher (< 150‐160/95‐100 mmHg) versus lower (< 140/90 mmHg) BP target, outcome7. Withdrawals due to adverse effects
2. Non‐cardiovascular mortality
All three studies provided data on non‐cardiovascular mortality and none demonstrated statistically significant differences. Pooling data produced a non‐significant difference (RR 1.09, 95% CI 0.81 to 1.46) with high heterogeneity (I2 = 52%) (Analysis 1.5.)
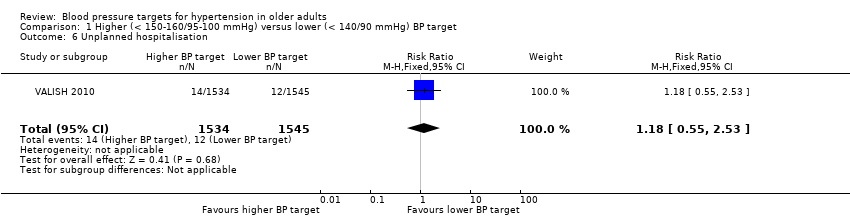
3. Unplanned hospitalisation
Only VALISH 2010 reported unplanned hospitalisation and no significant difference was found (RR 1.18, 95% CI 0.55 to 2.53) (Analysis 1.6).
4. Cardiovascular serious adverse events
4a. Cerebrovascular disease (infarction, haemorrhage or transient ischaemic attack)
All three studies provided data on cerebrovascular disease and only results from Wei 2013 were statistically significant, finding the higher BP target to be inferior. Pooling data produced a non‐significant difference (RR 1.22 95% CI 0.93 to 1.61) with moderate heterogeneity (I2 = 46%) (Analysis 1.7.1).
4b. Cardiac disease (myocardial infarction, new treatment for angina or congestive heart failure, sudden death)
All three studies provided data on cardiac disease and only results from Wei 2013 were statistically significant, finding the higher BP target to be inferior. Pooling data produced a non‐significant difference (RR 1.21, 95% CI 0.82 to 1.79) with no heterogeneity (I2 = 0%) (Analysis 1.7.2). Differences between groups were largely accounted for by congestive heart failure.
4c. Vascular disease (enlarging or rupturing or dissecting aneurysms of the aorta, treatment for occlusive arterial disease)
Only one study provided information on vascular disease (JATOS 2008) and found a non‐significant difference (RR 2.01, 95% CI 0.37 to 10.94) (Analysis 1.7.3).
4d. Renal failure (acute or chronic doubling of serum creatinine or dialysis)
Only two studies provided information on renal failure (JATOS 2008, VALISH 2010) and neither demonstrated significant differences. Pooling data produced no significant difference (RR 0.85, 95% CI 0.38 to 1.89) with low heterogeneity (I2 = 12%) (Analysis 1.7.4).
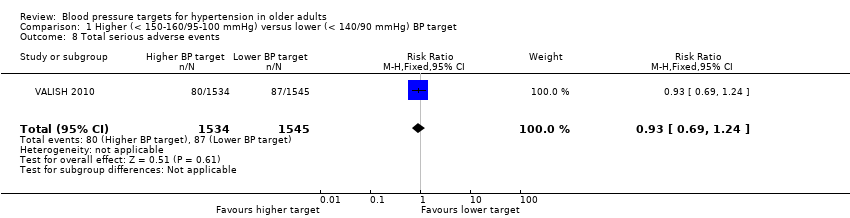
5. Total serious adverse events (death, hospitalisation and/or events requiring medical treatment)
Only VALISH 2010 reported total serious adverse events, which showed no significant difference (RR 0.93, 95% CI 0.69 to 1.24) (Analysis 1.8).
6. Total minor adverse events (symptoms not requiring medical treatment such as cough, fatigue or light‐headedness)
Only two studies provided information on total minor adverse events (JATOS 2008, VALISH 2010) and neither demonstrated significant differences. Pooling data produced no significant difference (RR 0.99, 95% CI 0.91 to 1.08) with low heterogeneity (I2 = 0%) (Analysis 1.9).
7. Withdrawals due to adverse effects
Only two studies provided information on withdrawals due to adverse effects (JATOS 2008, VALISH 2010) and neither demonstrated significant differences. Pooling data produced no significant difference (RR 0.83, 95% CI 0.58 to 1.19) with moderate heterogeneity (I2 = 36%) (Figure 6, Analysis 1.10).
8. Systolic BP achieved (mean difference)
Pooling all three studies, the mean difference in achieved systolic BP was 8.88 mmHg (95% CI 8.38 to 9.39 mmHg) greater in the higher as compared to the lower BP target groups with high heterogeneity (I2 = 98%) (Analysis 1.11).
9. Diastolic BP achieved (mean difference)
Pooling all three studies, the mean difference in achieved diastolic BP was 3.09 mmHg (95% CI 2.72 to 3.47 mmHg) greater in the higher as compared to the lower BP target groups with high heterogeneity (I2 = 96%) Analysis 1.12.
Discussion
Overview
Three relatively large RCTs met our inclusion criteria, however we rated the quality of evidence for our pooled estimates of effect as low for all outcomes. In most cases this downgrade was because of high heterogeneity and imprecision. In some cases we downgraded the quality of evidence because of high risk of bias or because not all trials reported the outcome of interest.
How were these studies heterogeneous?
One of the three included trials (Wei 2013: 724 participants) was substantially smaller than the other two trials (JATOS 2008: 4418 participants; VALISH 2010: 3079 participants) but none of the three trials dominated the weight of the analysis because the smallest trial (Wei 2013) had much higher event rates. This is at least partially explained by the fact that Japan (where the two larger trials took place) has one of the lowest age‐standardised cardiovascular mortality rates in the world and China (where Wei 2013 was conducted) has an indirectly standardised mortality ratio for ischaemic heart disease which is four times higher than Japan (and marginally higher than the USA) (Finegold 2013). Although the methods in Wei 2013 did not describe attempts to select a higher risk population, the composite primary outcome event rate in the less‐than‐140 mmHg‐BP group of Wei 2013 (which we calculate to be 2.8% per year) was not that different than the composite cardiovascular event rate in the 75‐years‐or‐over subset of the recently completed SPRINT trial's less‐than‐140 mmHg arm (which we calculate to be 3.3% per year) (SPRINT 2015). SPRINT participants were Americans without diabetes, considered to be at high risk of cardiovascular disease.
Separate from the difference in the underlying event rates, these three trials found very different estimates of the direction and magnitude of effect. With only three studies to compare, it is difficult to consider any one trial an outlier. One study (VALISH 2010) found nonsignificant results that most often lay between the other two studies. These other two studies either statistically significantly favoured the lower BP target for many outcomes (Wei 2013) or found a nonsignificant difference that lay close to, and at times even on the opposite side of, the no‐effect line (JATOS 2008). Selectively excluding JATOS 2008 from the meta‐analysis removed the heterogeneity for all‐cause mortality (I2 79% →0%) and stroke (I2 38% →0%), while removing Wei 2013 removed the heterogeneity from cardiovascular serious adverse events (I2 59% →0%) and cardiovascular mortality (I2 52% →0%).
An exploration of the observed heterogeneity
Methodology
Although the methodology described in each trial was not sufficiently different to explain the observed heterogeneity, we considered the only trial reporting a statistically significant benefit (Wei 2013) to be at high risk of bias, because the lead author appeared to join the trial after the results had already been reported in a conference abstract. When we excluded Wei 2013 from the analysis, all trends towards a benefit for the lower target disappeared. In particular this included all‐cause mortality (RR 0.93, 95% CI 0.68 to 1.27), cardiovascular serious adverse events (RR 1.04, 95% CI 0.82 to 1.32), and cardiovascular mortality (RR 0.90, 95% CI 0.48 to 1.71).
Populations studied
Consistent with the observed differences in event rates between these trials, participants in Wei 2013 had substantially higher prevalence of cardiovascular risk factors than did participants in JATOS 2008. Specifically, Wei 2013 had a higher proportion of men (66% versus 40%), higher proportion of people with diabetes (23% versus 12%), higher proportion of people that smoked (25% versus 13.5%), and greater age (76.5 years versus 73.6 years). The discussion in Wei 2013 also offered other information on baseline characteristics compared to JATOS 2008 that were not included in the body of the text (all of which showed Wei 2013 participants to be at higher risk) including differences in prior stroke (6.9% versus 4.2%), prior coronary heart disease (7.5% versus 3%), and presence of atrial fibrillation (18% in Wei 2013, excluded in JATOS 2008).
Outcomes
It is important to note that the primary outcome in Wei 2013 was driven by differences in stroke and congestive heart failure (fatal and non‐fatal). Fatal and non‐fatal myocardial infarction, in contrast, was essentially identical for both BP targets in all three trials. Importantly, and separate from the relative benefit of the different BP targets, coronary events (which typically represent a large proportion of events in trials with younger, high cardiovascular‐risk, hypertensive populations) represented a minority of events in these three trials of older, hypertensive adults (Wei 2013 18/107 events = 16.8% of events were myocardial infarction; JATOS 2008 31/176 events = 17.6% of events were myocardial infarction or angina; VALISH 2010 9/99 events = 9.1% of events were myocardial infarction). The HYVET antihypertensive trial (Beckett 2008) in people over the age of 80 years, similarly found both stroke and congestive heart failure to be more frequent occurrences than myocardial infarction (fatal or nonfatal outcomes in the placebo group were: stroke 17.7%, heart failure 14.8%, myocardial infarction only 3.1%). This compares, for instance, to the ACCOMPLISH trial (Jamerson 2008) which compared benazepril plus amlodipine to benazepril plus hydrochlorothiazide. In this often‐cited trial of (relatively) younger, high‐risk, hypertensive adults (average age 68.4 yrs) coronary revascularisations accounted for 720/1231 = 58.5% of the composite primary outcome. Chronic disease surveillance carried out by the Canadian government is consistent with this age differential in cardiovascular events. Examining (and stratifying by age) hospitalisations for coronary artery disease, congestive heart failure and stroke in Canada, the majority of such admissions (78.2%) are for coronary artery disease in the 55 years to 65 years age group whereas coronary artery disease accounts for only 38.8% of such admissions in those over 85 years of age (Dai 2009).
Intervention
Two aspects of the intervention are likely to be relevant to the observed differences in trial results. The first is the difference in systolic BP in the lower BP target group, compared to the higher BP target group (‐14.0 mmHg in Wei 2013, ‐9.7 mmHg in JATOS 2008, ‐5.4 mmHg in VALISH 2010). Clearly the greater difference in BP between treatment arms in Wei 2013 could explain some of the difference in the degree of benefit seen. The other potentially important difference is in which medications were used. In JATOS 2008 (the trial that concluded no difference between BP targets), all participants initially started and continued to use the calcium channel blocker efonidipine and had other medications added if needed. Roughly half of the participants in this trial were on efonidipine as monotherapy. The most common add‐on medications in the lower BP group included ACEI/ARB (40.7% of participants), followed distantly by adrenoceptor‐blocking drugs (14.3%) and diuretics (15.3%). The heavy reliance on calcium channel blockers is important since they have been demonstrated in meta‐analysis to be inferior to other antihypertensives in preventing heart failure outcomes (Chen 2010; Ettehad 2016). In VALISH 2010 (the trial that reported a nonsignificant trend to benefit for the lower BP target) all participants initially started on the ARB, valsartan. Roughly 57% were on valsartan monotherapy with the most commonly added agents in the lower BP target group again being calcium channel blockers (37.1%), followed much more distantly by diuretics (13.0%) and beta‐blockers (6.0%). In contrast Wei 2013 (the trial demonstrating statistically significant benefit) started participants on a variety of medications and ended up with the lower BP target group having participants on the ACE inhibitor, enalapril (31.5%), the calcium channel blocker amlodipine (27.2%), the beta‐blockers metoprolol or bisoprolol (21.2%) and the diuretic, indapamide (21.2%). Although it is not stated how many participants were on monotherapy with each agent, we know from VALISH 2010 and JATOS 2008 that roughly 50% of participants ended up on monotherapy with one drug. Given the greater BP difference in this trial, the percentage of participants on monotherapy may be even smaller. If so, and if participants started on each drug class equally frequently, we estimate only 12% of Wei 2013 participants to have been on monotherapy with a calcium channel blocker.
Possible explanations for the observed heterogeneity
-
Bias may have influenced the sole trial finding a statistically significant benefit. We considered Wei 2013, the smallest trial driving any trend to benefit, to be at high risk of bias.
-
The effect of antihypertensive medication on outcomes that are common in the elderly may differ by medication class. The older adults participating in these three trials had stroke and heart failure (fatal and nonfatal) as their most common cardiovascular events. Each trial also differed in the extent to which they relied on medications indicated for use in heart failure. In Wei 2013 (the single study finding statistically significant benefit) close to 90% of participants were expected to have been on at least one, and possibly two or more drugs with established benefit to treat or prevent heart failure. In JATOS 2008 (the study finding no benefit) roughly half of these participants were on monotherapy with a calcium channel blocker, a medication class shown to be inferior to other antihypertensives for preventing heart failure outcomes (Chen 2010, Ettehad 2016). It is conceivable that the heavy reliance of JATOS 2008 on a calcium channel blocker might have led to less effective risk reduction for heart failure‐related events, which were one of the main contributors to the composite primary outcome in all three studies. The substantially more common cardiovascular risk factors in Wei 2013, including the 18% of participants with atrial fibrillation (which JATOS excluded), would also be expected to put the participants in Wei at substantially greater risk of stroke than those of JATOS 2008. Although calcium channel blockers have superior efficacy to other antihypertensives for the prevention of stroke (Chen 2010, Ettehad 2016), the low‐risk participants in JATOS 2008, and the relatively smaller difference in BP between study arms in that trial, may have diminished the opportunity for stroke benefit to be seen.
Summary of main results
See summary of findings Table for the main comparison for key results. Although none of our primary outcomes reached conventional statistical significance, two of these outcomes were numerically in favour of the lower BP target, these being all‐cause mortality (RR 1.24, 95% CI 0.99 to 1.54) and cardiovascular serious adverse events (RR 1.19, 95% CI 0.98 to 1.45). Consistent with the possibility that these differences might be real, cardiovascular mortality also favoured the lower BP target and was statistically significantly different (RR 1.52, 95% CI 1.06 to 2.19). Although this suggests the potential of a clinically important difference favouring the lower BP target, the high degree of unexplained heterogeneity amongst these trials (I2 of 38% to 79% for the primary outcomes), and the apparent disappearance of potential benefit when the single trial considered to be at high risk of bias was removed, prevents any conclusions being drawn.
Overall completeness and applicability of evidence
In this review we systematically searched all relevant electronic databases. It is unlikely that published RCTs meeting our inclusion criteria would have been missed, however unpublished studies could have gone undetected. There were too few studies to assess the likelihood of missing studies with a funnel plot. The study participants appear to have all been drawn from general practice populations, however these populations may have been somewhat atypical for general practice patients in many countries given that they appeared to be either at lower risk than average for cardiovascular events (JATOS 2008 and VALISH 2010), or higher risk than average (Wei 2013).
Quality of the evidence
We assessed the risk of bias for each of the RCTs included in this review (Figure 2), and we viewed one of the three included trials as having a higher overall risk of bias. While two large RCTs and one moderate‐sized RCT might normally be considered to provide high‐quality evidence, the high level of heterogeneity observed, and the higher potential for bias in the only trial finding benefit, led us to consider this evidence as low quality overall.
Potential biases in the review process
This review is limited to published trials. Conceivably smaller trials that were never published might exist (publication bias). The high heterogeneity also suggests that either Wei 2013 or JATOS 2008 may substantially over, or under‐estimate, the magnitude of the mean benefit conveyed by differing BP targets.
Agreements and disagreements with other studies or reviews
SPRINT 2015, an RCT in high cardiovascular disease risk, non‐diabetic hypertensive people, comparing a systolic BP target of less than 140 mmHg with less than 120 mmHg, does not meet the inclusion criteria for this review and has been excluded. For the subset of participants over the age of 75 years (2636 subjects, mean age 79.9 years), this trial reported a statistically significant difference in a composite CVD primary outcome that favoured the lower BP target (HR 0.67, 95% CI 0.51 to 0.86). For SPRINT 2015 as a whole, the average difference in BP between treatment groups was 14.8 mmHg. If a difference in BP targets can demonstrate risk reduction when those BPs are already fairly low (as in SPRINT 2015), it seems possible that benefit from a lower BP target might also be found when those targets are substantially higher (as in our review). Multiple systematic reviews (Chen 2010; Ettehad 2016; Wiysonge 2017; Xue 2015) have also demonstrated that antihypertensive drug classes differ in their efficacy for preventing various cardiovascular events. In particular diuretics appear superior at preventing heart failure compared to other drugs, calcium channel blockers appear inferior at preventing heart failure compared to other drugs, and both calcium channel blockers and ARBs appear superior at preventing stroke. Given our observation that heart failure admissions are a major driver of events in older adults, the body of literature suggesting that calcium channel blockers are inferior to other agents for the prevention of heart failure might explain why JATOS 2008 (in which half the subjects were on calcium channel blocker monotherapy) did not find benefit to the lower BP target.

Study flow diagram

Risk of bias summary: review authors' judgements about each risk of bias item for each included study
Forest plot of comparison higher (< 150‐160/95‐100 mmHg) versus lower (< 140/90 mmHg) BP target, outcome 1. All‐cause mortality.

Forest plot of comparison higher (< 150‐160/95‐100 mmHg) versus lower (< 140/90 mmHg) BP target, outcome 2. Stroke

Forest plot of comparison higher (< 150‐160/95‐100 mmHg) versus lower (< 140/90 mmHg) BP target, outcome 4. Cardiovascular serious adverse events

Forest plot of comparison higher (< 150‐160/95‐100 mmHg) versus lower (< 140/90 mmHg) BP target, outcome7. Withdrawals due to adverse effects
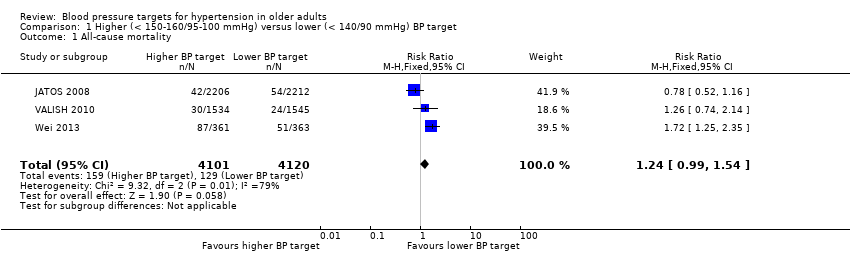
Comparison 1 Higher (< 150‐160/95‐100 mmHg) versus lower (< 140/90 mmHg) BP target, Outcome 1 All‐cause mortality.
Comparison 1 Higher (< 150‐160/95‐100 mmHg) versus lower (< 140/90 mmHg) BP target, Outcome 2 Stroke.
Comparison 1 Higher (< 150‐160/95‐100 mmHg) versus lower (< 140/90 mmHg) BP target, Outcome 3 Cardiovascular serious adverse events.

Comparison 1 Higher (< 150‐160/95‐100 mmHg) versus lower (< 140/90 mmHg) BP target, Outcome 4 Cardiovascular mortality.

Comparison 1 Higher (< 150‐160/95‐100 mmHg) versus lower (< 140/90 mmHg) BP target, Outcome 5 Non‐cardiovascular mortality.
Comparison 1 Higher (< 150‐160/95‐100 mmHg) versus lower (< 140/90 mmHg) BP target, Outcome 6 Unplanned hospitalisation.

Comparison 1 Higher (< 150‐160/95‐100 mmHg) versus lower (< 140/90 mmHg) BP target, Outcome 7 Cardiovascular serious adverse events (by component).
Comparison 1 Higher (< 150‐160/95‐100 mmHg) versus lower (< 140/90 mmHg) BP target, Outcome 8 Total serious adverse events.
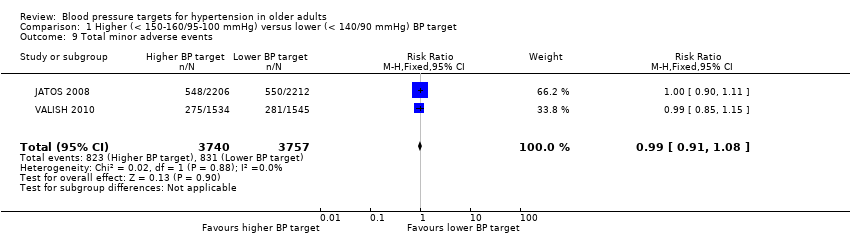
Comparison 1 Higher (< 150‐160/95‐100 mmHg) versus lower (< 140/90 mmHg) BP target, Outcome 9 Total minor adverse events.

Comparison 1 Higher (< 150‐160/95‐100 mmHg) versus lower (< 140/90 mmHg) BP target, Outcome 10 Withdrawals due to adverse effects.
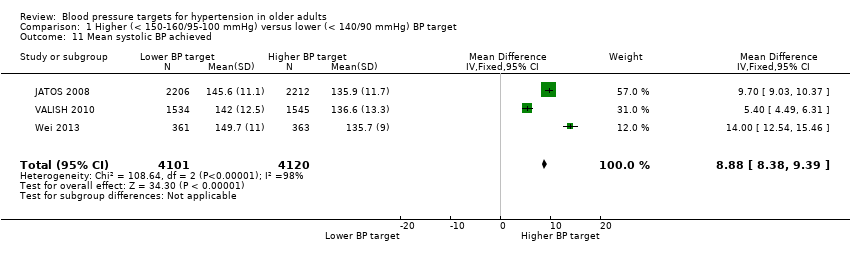
Comparison 1 Higher (< 150‐160/95‐100 mmHg) versus lower (< 140/90 mmHg) BP target, Outcome 11 Mean systolic BP achieved.

Comparison 1 Higher (< 150‐160/95‐100 mmHg) versus lower (< 140/90 mmHg) BP target, Outcome 12 Mean diastolic BP achieved.
| Higher BP target (< 150‐160/95‐105 mmHg) compared with lower BP target (< 140/90 mmHg) for cardiovascular risk reduction | ||||||
| Patient or population: older adults with primary hypertension Settings: outpatient Intervention: higher BP target < 150‐160)/95‐105 mmHg Comparison: lower BP target < 140/90 mmHg | ||||||
| Outcomes | Illustrative comparative risks1 | Relative effect | No of participants | Quality of the evidence | Comments | |
| Assumed | Corresponding | |||||
| Lower | Higher | |||||
| All‐cause mortality Mean follow‐up: 2.6 years | 31 per 1000 | 39 per 1000 | RR 1.24 (0.99 to 1.54) | 8221 | ⊕⊕⊝⊝ | |
| Stroke Mean follow‐up: 2.6 years | 20 per 1000 | 25 per 1000 | RR 1.25 (0.94 to 1.67) | 8221 | ⊕⊕⊝⊝ | |
| Cardiovascular serious adverse events Mean follow‐up: 2.6 years | 42 per 1000 | 50 per 1000 | RR 1.19 (0.98 to 1.45) | 8221 | ⊕⊕⊝⊝ | |
| Withdrawals due to adverse effects Mean follow‐up: 2.4 years | 17 per 1000 | 14 per 1000 | RR 0.83 (0.58 to 1.19) | 7497 | ⊕⊕⊝⊝ | |
| The basis for the assumed risk is provided in footnote below. The corresponding risk (and its 95% CI) is based on the assumed risk in the comparison group and the relative effect of the intervention (and its 95% CI). | ||||||
| GRADE Working Group grades of evidence | ||||||
| 1Rationale for our choice of assumed risk: the risk of cardiovascular events in a hypertensive general population varies considerably across countries (Finegold 2013). With no reason to favour one country over another we have opted to use (now and for future updates) an assumed risk, which is the average across studies included in this review. | ||||||
| Outcome or subgroup title | No. of studies | No. of participants | Statistical method | Effect size |
| 1 All‐cause mortality Show forest plot | 3 | 8221 | Risk Ratio (M‐H, Fixed, 95% CI) | 1.24 [0.99, 1.54] |
| 2 Stroke Show forest plot | 3 | 8221 | Risk Ratio (M‐H, Fixed, 95% CI) | 1.25 [0.94, 1.67] |
| 3 Cardiovascular serious adverse events Show forest plot | 3 | 8221 | Risk Ratio (M‐H, Fixed, 95% CI) | 1.19 [0.98, 1.45] |
| 4 Cardiovascular mortality Show forest plot | 3 | 8221 | Risk Ratio (M‐H, Fixed, 95% CI) | 1.52 [1.06, 2.19] |
| 5 Non‐cardiovascular mortality Show forest plot | 3 | 8221 | Risk Ratio (M‐H, Fixed, 95% CI) | 1.09 [0.81, 1.46] |
| 6 Unplanned hospitalisation Show forest plot | 1 | 3079 | Risk Ratio (M‐H, Fixed, 95% CI) | 1.18 [0.55, 2.53] |
| 7 Cardiovascular serious adverse events (by component) Show forest plot | 3 | Risk Ratio (M‐H, Fixed, 95% CI) | Subtotals only | |
| 7.1 Cerebrovascular disease | 3 | 8221 | Risk Ratio (M‐H, Fixed, 95% CI) | 1.22 [0.93, 1.61] |
| 7.2 Cardiac disease | 3 | 8221 | Risk Ratio (M‐H, Fixed, 95% CI) | 1.21 [0.82, 1.79] |
| 7.3 Vascular disease | 1 | 4418 | Risk Ratio (M‐H, Fixed, 95% CI) | 2.01 [0.37, 10.94] |
| 7.4 Renal failure | 2 | 7497 | Risk Ratio (M‐H, Fixed, 95% CI) | 0.85 [0.38, 1.89] |
| 8 Total serious adverse events Show forest plot | 1 | 3079 | Risk Ratio (M‐H, Fixed, 95% CI) | 0.93 [0.69, 1.24] |
| 9 Total minor adverse events Show forest plot | 2 | 7497 | Risk Ratio (M‐H, Fixed, 95% CI) | 0.99 [0.91, 1.08] |
| 10 Withdrawals due to adverse effects Show forest plot | 2 | 7497 | Risk Ratio (M‐H, Fixed, 95% CI) | 0.83 [0.58, 1.19] |
| 11 Mean systolic BP achieved Show forest plot | 3 | 8221 | Mean Difference (IV, Fixed, 95% CI) | 8.88 [8.38, 9.39] |
| 12 Mean diastolic BP achieved Show forest plot | 3 | 8221 | Mean Difference (IV, Fixed, 95% CI) | 3.09 [2.72, 3.47] |