First‐line combination therapy versus first‐line monotherapy for primary hypertension
Abstract
Background
This is the second update of a review originally published in 2017. Starting with one drug and with a combination of two drugs are strategies suggested in clinical guidelines as initial treatment for hypertension. The recommendations are not based on evidence about clinically relevant outcomes. Some antihypertensive combinations have been shown to be harmful. The actual harm‐to‐benefit balance of each strategy is unknown.
Objectives
To determine if there are differences in clinical outcomes between monotherapy and combination therapy as initial treatment for primary hypertension.
Search methods
The Cochrane Hypertension Information Specialist searched the following databases for randomised controlled trials up to March 2021: the Cochrane Hypertension Specialised Register, the Cochrane Central Register of Controlled Trials (CENTRAL), MEDLINE (from 1946), and Embase (from 1974). The World Health Organization International Clinical Trials Registry Platform and the US National Institutes of Health Ongoing Trials Register (ClinicalTrials.gov) were searched for ongoing trials. We also contacted authors of relevant papers regarding further published and unpublished work. We used no language restrictions. We also searched clinical studies repositories of pharmaceutical companies, reviews of combination drugs on the US Food and Drug Administration and European Medicines Agency websites, and lists of references in reviews and clinical practice guidelines.
Selection criteria
We included randomised, double‐blind trials with at least 12 months' follow‐up in adults with primary hypertension (systolic blood pressure/diastolic blood pressure 140/90 mmHg or higher, or 130/80 mmHg or higher if participants had diabetes), which compared a combination of two first‐line antihypertensive drugs with monotherapy as initial treatment. Trials had to include at least 50 participants per group and report mortality, cardiovascular mortality, cardiovascular events, or serious adverse events.
Data collection and analysis
Two review authors independently selected trials for inclusion, evaluated the risks of bias, and performed data entry. The primary outcomes were mortality, serious adverse events, cardiovascular events, and cardiovascular mortality. Secondary outcomes were withdrawals due to drug‐related adverse effects, reaching blood pressure control (as defined in each trial), and blood pressure change from baseline. Analyses were based on the intention‐to‐treat principle. We summarised data on dichotomous outcomes as risk ratios (RRs) with 95% confidence intervals (CIs). We used GRADE to assess the quality of the evidence.
Main results
We found no new trials for this update. The three original trials in the main comparison (monotherapy: 335 participants; combination therapy: 233 participants) included outpatients, mostly European and white people. Two trials only included people with type 2 diabetes; the remaining trial excluded people treated with diabetes, hypocholesterolaemia, or cardiovascular drugs. The follow‐up was 12 months in two trials and 36 months in one trial. The following treatments were compared: perindopril + indapamide versus enalapril; perindopril + indapamide versus atenolol; and verapamil + trandolapril versus verapamil or trandolapril.
Our 2019 update included one new study in which a subgroup of participants met our inclusion criteria. As none of the four included studies focused solely on people initiating antihypertensive treatment, we asked investigators for data for this subgroup. One study (PREVER‐treatment 2016) used a combination of thiazide‐type diuretic/potassium‐sparing diuretic: chlorthalidone + amiloride compared to losartan. As the amiloride is not indicated in monotherapy, we analysed this study separately.
It is very uncertain whether combination therapy versus monotherapy reduces total mortality (RR 1.35, 95% CI 0.08 to 21.72), cardiovascular mortality (zero events reported), cardiovascular events (RR 0.98, 95% CI 0.22 to 4.41), serious adverse events (RR 0.77, 95% CI 0.31 to 1.92), or withdrawals due to adverse effects (RR 0.85, 95% CI 0.53 to 1.35); all outcomes had 568 participants, and we rated the evidence as of very low certainty due to serious imprecision and for using a subgroup that was not defined in advance. The confidence intervals were extremely wide for all important outcomes and included both appreciable harm and benefit.
The PREVER‐treatment 2016 trial, which used a combination therapy with potassium‐sparing diuretic (monotherapy: 84 participants; combination therapy: 116 participants), included outpatients. This trial was conducted in Brazil and had a follow‐up of 18 months. The number of events was very low and confidence intervals very wide, with zero events reported for cardiovascular mortality and withdrawals due to adverse events. It is very uncertain if there are differences in clinical outcomes between monotherapy and combination therapy in this trial.
Authors' conclusions
The numbers of included participants, and hence the number of events, were too small to draw any conclusion about the relative efficacy of monotherapy versus combination therapy, as initial treatment for primary hypertension. There is a need for large clinical trials that address the review question and report clinically relevant endpoints.
PICO
Plain language summary
Beginning treatment of hypertension with one medicine versus with a combination of two medicines
What is high blood pressure?
This is the second update of a review published for the first time in 2017. Hypertension (high blood pressure) is a long‐term condition that increases the risk of health problems such as heart attack, stroke, or kidney disease.
How is high blood pressure treated?
Several types of medicines are used to treat hypertension. Over time a person with hypertension will often need more than one type of medicine to help control their blood pressure. A doctor prescribing medicines to reduce blood pressure for the first time in a patient has two options: using only one medicine (monotherapy) or using two medicines (combination therapy). Combination therapy can be in the same tablet or in different tablets.
What did we want to find out?
We wanted to find out if there are differences between treating people with high blood pressure with one medicine or with two medicines. The potential advantage of using two medicines is that blood pressure may fall faster, but we do not know if this is better or worse for avoiding harmful effects in the patient.
What did we do?
We searched for studies that compared starting treatment of hypertension in adults with one medicine versus studies that started treatment with two medicines. Studies had to talk about results such as deaths or other events caused by diseases of the heart or the blood vessels, such as heart attack, stroke, or heart failure. Studies could also talk about other kinds of health‐related side effects. We only chose studies with 50 or more people in each group and that lasted at least 12 months.
What did we find?
In this update we did not find any new studies, with a total of four studies included in the review, with 419 treated with one medicine and 349 people treated with more than one medicine. However, there was not enough information to answer our review question. There is a need for more and larger studies that compare using one medicine versus using two medicines as the first treatment for high blood pressure.
Authors' conclusions
Summary of findings
| Combination therapy compared to monotherapy for primary hypertension | |||||
| Patient or population: people with primary hypertension | |||||
| Outcomes | Anticipated absolute effects* (95% CI) | Relative effect | № of participants | Certainty of the evidence | |
|---|---|---|---|---|---|
| Risk with monotherapy | Risk with combination therapy | ||||
| Total mortality Follow‐up: 12 to 36 months | 3 per 1000 | 4 per 1000 | RR 1.35 | 568 | ⊕⊝⊝⊝ |
| Cardiovascular mortality Follow‐up: 12 to 36 months | 0 per 1000 | 0 per 1000 | Not estimable | 568 | ⊕⊝⊝⊝ |
| Cardiovascular events Follow‐up: 12 to 36 months | 9 per 1000 | 9 per 1000 | RR 0.98 | 568 | ⊕⊝⊝⊝ |
| Serious adverse events Follow‐up: 12 to 36 months | 176 per 1000 | 136 per 1000 | RR 0.77 | 568 | ⊕⊝⊝⊝ |
| Withdrawals due to adverse effects Follow‐up: 12 to 36 months | 128 per 1000 | 109 per 1000 | RR 0.85 | 568 | ⊕⊝⊝⊝ |
| *The risk in the intervention group (and its 95% confidence interval) is based on the assumed risk in the comparison group and the relative effect of the intervention (and its 95% CI). | |||||
| GRADE Working Group grades of evidence | |||||
| aWe downgraded by one level for serious risk of bias because all data came from subgroups of participants not predefined in the original studies, and the outcomes of our review were not the primary outcome in any included trial. | |||||
| Combination with potassium‐sparing diuretics versus monotherapy for primary hypertension | |||||
| Patient or population: people with primary hypertension | |||||
| Outcomes | Anticipated absolute effects* (95% CI) | Relative effect | № of participants | Certainty of the evidence | |
|---|---|---|---|---|---|
| Risk with monotherapy | Risk with combination with potassium‐sparing diuretics | ||||
| Total mortality Follow‐up: 18 months | 12 per 1000 | 3 per 1000 | RR 0.24 | 200 | ⊕⊝⊝⊝ |
| Cardiovascular mortality Follow‐up: 18 months | 0 per 1000 | 0 per 1000 | Not estimable | 200 | ⊕⊝⊝⊝ |
| Cardiovascular events Follow‐up: 18 months | 12 per 1000 | 17 per 1000 | RR 1.45 | 200 | ⊕⊝⊝⊝ |
| Serious adverse events Follow‐up: 18 months | 24 per 1000 | 17 per 1000 | RR 0.72 | 200 | ⊕⊝⊝⊝ |
| Withdrawals due to adverse effects Follow‐up: 18 months | 0 per 1000 | 0 per 1000 | Not estimable | 200 | ⊕⊝⊝⊝ |
| *The risk in the intervention group (and its 95% confidence interval) is based on the assumed risk in the comparison group and the relative effect of the intervention (and its 95% CI). | |||||
| GRADE Working Group grades of evidence | |||||
| aWe downgraded by one level for serious risk of bias because all data came from a subgroup of participants not predefined in the original study, and outcomes of our review were not the primary outcome in the trial. | |||||
Background
Description of the condition
Elevated blood pressure (hypertension), arbitrarily defined as systolic blood pressure of 140 mmHg or greater or diastolic blood pressure of 90 mmHg or greater, is a risk factor for stroke, myocardial infarction, renal failure, congestive heart failure, and peripheral artery disease. There is a graded relationship between blood pressure and the risk of cardiovascular disease (ESH/ESC 2018; NICE 2019). Approximately 90% of cases of elevated blood pressure are considered to be primary hypertension, as there is no secondary cause that can be determined (ESH/ESC 2018). The main goal of attempts to lower the blood pressure is to prevent cardiovascular morbidity and death, without adversely affecting quality of life. Blood pressure reduction per se is one of the main approaches to cardiovascular risk reduction (Gradman 2010; Law 2009).
Description of the intervention
Stepped therapy constitutes the usual initial approach in most people with hypertension, increasing the dose of the first drug or adding other drugs if blood pressure targets are not reached. First‐line low‐dose thiazides have the best evidence for reducing mortality and morbidity (Wright 2018). Guidelines that are often based on lower levels of evidence have suggested other classes for first‐line therapy in addition to thiazides, including: beta‐blockers, angiotensin‐converting enzyme inhibitors (ACEIs), angiotensin receptor blockers (ARBs), and calcium channel blockers (CCBs) (ESH/ESC 2018; Hypertension Canada 2020). They also suggest that determination of the need for drug therapy is based on a combined assessment of the blood pressure level and the risk for cardiovascular disease. Available data suggest that at least 75% of people with hypertension will require combination therapy to achieve blood pressure targets (Gradman 2010).
The aim of using a combination of two antihypertensive drugs as initial therapy is providing a faster reduction in blood pressure. The preferred drug combinations are ACEI or ARB with a thiazide‐type diuretic or CCB, and thiazide‐type diuretic with CCB (ESH/ESC 2018; Hypertension Canada 2020). In one large trial with high‐risk participants, ACEI/CCB combination resulted in fewer cardiovascular events than ACEI/hydrochlorothiazide (ACCOMPLISH 2008). Guidelines have suggested that chlorthalidone and indapamide have better evidence of benefit on clinical outcomes than bendroflumethiazide or hydrochlorothiazide (NICE 2019); however, this is not supported by evidence from randomised controlled trials (Wright 2018). Furthermore, most single‐pill combinations include hydrochlorothiazide. The combination of ACEI and ARB is not recommended (ESH/ESC 2018; Hypertension Canada 2020; JNC 8 2014; NICE 2019; Whelton 2018).
How the intervention might work
Treatment of hypertension reduces the risk of stroke, coronary artery disease, and congestive heart failure, as well as overall cardiovascular morbidity and mortality from cardiovascular causes. Stepped antihypertensive therapy starting with low‐dose thiazides reduces mortality and cardiovascular morbidity (Wright 2018), and in head‐to‐head trials, first‐line thiazides are better at reducing total cardiovascular events than first‐line beta‐blockers (Wiysonge 2017), first‐line drugs inhibiting the renin‐angiotensin system (Chen 2018), and first‐line CCBs (Zhu 2021).
The clinical practice guideline from the National Institute for Health and Care Excellence (NICE) recommends monotherapy as the initial approach, even for people with type 2 diabetes (NICE 2019). Some current guidelines suggest that two drugs be used for initial therapy if there is an elevation in blood pressure of 20 mmHg systolic or 10 mmHg diastolic above goal (JNC 8 2014; Whelton 2018). The guideline from the European Society of Hypertension (ESH) and the European Society of Cardiology (ESC) recommends initiating an antihypertensive treatment with a two‐drug combination of ACEI or ARB plus CCB or diuretic, with a subsequent increase in drug number, if needed. Monotherapy may be considered as the initial treatment for frail older patients and those at low risk and with grade 1 hypertension (particularly if systolic blood pressure is less than 150 mmHg) (ESH/ESC 2018). For people with past stroke or transient ischaemic attack, Hypertension Canada 2020 recommends initiating treatment with an ACEI/thiazide‐type diuretic combination.
Some advantages of initial combination treatment have been proposed. Two drugs can be given at low doses, thereby reducing the risk of adverse effects. Combination therapy provides more rapid control of blood pressure than monotherapy. Adherence may be improved, and subsequent blood pressure control, when the person perceives the treatment is effective and well tolerated (ESH/ESC 2018).
The disadvantages of initiating treatment with drug combinations are that one of the drugs may be ineffective or unnecessary, thus complicating the treatment (ESH/ESC 2013), and that a substantial decrease in blood pressure can be poorly tolerated in some people (e.g. older people).
Why it is important to do this review
It is unknown whether the benefits of combination therapy compared to monotherapy for initial treatment of hypertension exceed the harms.
One meta‐analysis showed that combining drugs from different classes is more effective in lowering blood pressure than increasing the dose of one drug, but it did not provide information about morbidity or adverse effects. The authors recommended considering combination therapy as routine initial therapy (Wald 2009). Although the value of routinely starting treatment with combination therapy, particularly with low doses, has been proposed, it has not been widely accepted. It is unknown if beginning with two drugs results in improved cardiovascular outcomes or mortality compared with starting with one drug (JNC 8 2014). The recommendation to use combinations when blood pressure is 20/10 mmHg above goal is not based on direct evidence from randomised controlled trials (JNC 8 2014; Whelton 2018).
Combinations of drugs acting on the renin‐angiotensin system have been proposed, but these have been shown to be harmful (ALTITUDE 2012; Makani 2013; ONTARGET 2008).
One observational study including 1127 people older than 80 years living in nursing homes found a significant increase in two‐year mortality (adjusted hazard ratio 1.78, 95% confidence interval (CI) 1.34 to 2.37) associated with combinations of antihypertensive drugs in people with systolic blood pressure less than 130 mmHg (PARTAGE 2015). Other observational studies have claimed benefits with combination strategy versus monotherapy: Rea 2018 (44,534 participants aged 40 to 80 years) showed a reduced one‐year risk of hospitalisation for cardiovascular events (hazard ratio 0.85, 95% CI 0.74 to 0.97) after matching by a high‐dimensional propensity score. Weir 2017 (48,131 participants, median age 57 years) showed greater odds of achieving blood pressure control at six months (odds ratio 1.21, 95% CI 1.09 to 1.35).
There is an increasing awareness about the problem of polypharmacy. The single most important predictor of risk of adverse drug events in older people is the number of prescribed drugs, so using the minimum number of drugs is a measure to improve patient safety (Scott 2015).
Objectives
To determine if there are differences in clinical outcomes between monotherapy and combination therapy as initial treatment for primary hypertension.
Methods
Criteria for considering studies for this review
Types of studies
Double‐blind randomised controlled trials of at least one‐year duration and containing 50 or more participants per group. The trials must have reported data for at least one of the primary outcomes. We excluded trials using non‐randomised allocation methods such as alternate allocation, week of presentation, or retrospective controls.
Types of participants
We included participants aged at least 18 years whose blood pressure was measured using a validated technique.
Trials were limited to those in which participants had a baseline resting systolic blood pressure of at least 140 mmHg or a diastolic blood pressure of at least 90 mmHg (130/80 mmHg or greater in people with diabetes). We included the study if 70% or more of the participants met the above definitions; individual participant data were available; or data of relevant participants were provided separately, allowing inclusion of this specific population.
We excluded people with confirmed secondary hypertension.
Trials were not limited by any other factor or baseline risk.
Types of interventions
Intervention: combination therapy (i.e. participants treated initially with two antihypertensive drugs).
Control: monotherapy (i.e. participants treated initially with one antihypertensive drug).
Treatment should have been clearly defined as a specific class of first‐line antihypertensive therapy in one of the following classes: thiazide‐type diuretics, loop diuretics, beta‐blockers, CCBs, ACEIs, ARBs, renin inhibitors, or α‐adrenergic blockers (ATC codes: C03, C07, C08, C09, C02CA, C02LE). We excluded drug classes that have not been confirmed to lower blood pressure as monotherapy (e.g. potassium‐sparing diuretics triamterene and amiloride) (Heran 2012). We planned that if a trial used a combination of diuretics with these agents, we would analyse them separately. Aldosterone antagonists (spironolactone and eplerenone) are normally used for resistant hypertension (ESH/ESC 2018; Whelton 2018). Trials using a combination of first‐line agents with aldosterone antagonists would also be included as combination therapy.
Initial therapy is defined as the first time participants were treated with antihypertensive drugs.
Both groups under study should have had the same blood pressure target, if this was defined.
Drugs and doses were acceptable when the doses were within the manufacturer‐recommended dose range for hypertension.
Types of outcome measures
Primary outcomes
-
Total mortality.
-
Total serious adverse events, defined according to the International Conference on Harmonisation Guidelines (ICH 1995), as any event that leads to death, was life‐threatening, required hospitalisation or prolongation of existing hospitalisation, resulted in persistent or significant disability, or that was a congenital anomaly/birth defect.
-
Total cardiovascular events including total myocardial infarction, stroke, sudden death, hospitalisation or death from congestive heart failure, and other significant vascular events such as ruptured aneurysms (not including angina, transient ischaemic attacks, surgical or other procedures, or accelerated hypertension).
-
Cardiovascular mortality.
If a study used a different definition for serious adverse events, two review authors (JG and LCS) decided on inclusion of the data by consensus, consulting another review author where required. .
All primary outcomes were important outcomes to be included in the summary of findings table.
Secondary outcomes
-
Withdrawals due to drug‐related adverse effects (important outcome).
-
Reaching blood pressure control, as defined in each trial.
-
Systolic and diastolic blood pressure change from baseline.
Search methods for identification of studies
Electronic searches
The Cochrane Hypertension Information Specialist conducted systematic searches of the following databases for primary studies, without language or publication status restrictions:
-
the Cochrane Hypertension Specialised Register via the Cochrane Register of Studies (CRS‐Web) (searched 12 March 2021);
-
the Cochrane Central Register of Controlled Trials (CENTRAL, 2019, Issue 3) via CRS‐Web (searched 11 March 2021);
-
MEDLINE Ovid (from 1946), MEDLINE Ovid Epub Ahead of Print, and MEDLINE Ovid In‐Process & Other Non‐Indexed Citations (searched 11 March 2021);
-
Embase (from 1974) (searched 11 March 2021);
-
US National Institutes of Health Ongoing Trials Register ClinicalTrials.gov (clinicaltrials.gov/) (searched 12 March 2021);
-
WHO International Clinical Trials Registry Platform (ICTRP) via CENTRAL in CRS‐Web (searched 12 March 2021)
The Specialised Register also includes searches for controlled trials in the Allied and Complementary Medicine Database (AMED), CAB Abstracts & Global Health, Cumulative Index to Nursing and Allied Health Literature (CINAHL), ProQuest Dissertations & Theses, and Web of Science.
The Information Specialist modelled subject strategies for databases on the search strategy designed for MEDLINE. Where appropriate, these were combined with subject strategy adaptations of the sensitivity‐ and precision‐maximising search strategy designed by Cochrane for identifying randomised controlled trials, as described in the Cochrane Handbook for Systematic Reviews of Interventions (Higgins 2021). The search strategies for major databases are shown in Appendix 1.
Searching other resources
-
The Cochrane Hypertension Information Specialist searched the Hypertension Specialised Register segment (which includes searches of MEDLINE, Embase, and Epistemonikos for systematic reviews) to retrieve existing reviews relevant to this systematic review, so that we could scan their reference lists for additional trials. The Specialised Register also includes searches for controlled trials in AMED, CAB Abstracts & Global Health, CINAHL, ProQuest Dissertations & Theses, and Web of Science.
-
We contacted relevant pharmaceutical companies and searched their clinical studies repositories (Appendix 2).
-
We searched the websites of the US Food and Drug Administration (FDA) (www.fda.gov) and the European Medicines Agency (EMA) (www.ema.europa.eu) for published and unpublished clinical trial data relevant to this review. We only considered FDA and EMA reports of authorised combination drugs. We searched the Scientific Discussion of the European Public Assessment Reports and the FDA's Medical Reviews.
-
We searched the TRIP Database (www.tripdatabase.com) for systematic reviews, guidelines, and health technology assessment reports.
-
We searched for additional trials by checking the reference lists of included trials and reviews, guidelines, and health technology assessment reports (Appendix 3).
Dealing with duplicate publications
When we identified more than one publication of an original trial, we assessed the articles together to maximise data collection.
References from published studies
We examined the references of the included and excluded studies for further potentially eligible randomised controlled trials.
Language
We applied no language restrictions.
Correspondence
We contacted trial investigators to request data for the subgroup of participants without previous antihypertensive treatment, for missing data, or to clarify study details.
Data collection and analysis
Two review authors independently reviewed the search results. One review author (JG) checked all results and the remaining review authors (LCS, AA, IG, MJA, JE) participated as a second review author by dividing the whole search results among themselves. We used EROS and Covidence software for screening and classifying references.
Selection of studies
We performed an initial screening based on title and abstract, excluding records for any of the following reasons:
-
not a double‐blind randomised controlled trial;
-
participants were not naïve to antihypertensive treatment;
-
there were fewer than 50 participants per group;
-
follow‐up was less than 12 months;
-
the trial did not compare monotherapy with a combination therapy of the included classes;
-
blood pressure targets differed between groups; or
-
antihypertensive doses were not in the recommended range.
We obtained the full text of the remaining articles and assessed whether they met the inclusion criteria. If we determined that a study could have included a subgroup of participants that met our inclusion criteria (more than 50 people with hypertension without previous antihypertensive drugs per group), we provisionally included it and contacted the study authors for data for the subgroup.
Two review authors independently reviewed the selected articles. One review author (LCS) checked all results and the remaining review authors (JG, AA, IG, MJA, JE) participated as a second review author by dividing the whole search results among themselves. Any disagreements were resolved by discussion or by involving all review authors if necessary.
Data extraction and management
Two review authors (JG and LCS) independently extracted data from the included trials, using a standardised data extraction form which included the following:
-
study design;
-
randomisation;
-
allocation concealment;
-
blinding;
-
drugs;
-
doses;
-
duration of treatment;
-
baseline characteristics;
-
losses to follow‐up;
-
outcomes;
-
analysis and reporting.
Any disagreements between authors were resolved by discussion or by involving all review authors if necessary.
We used Access 2010 and Excel 2010 for dealing with individual participant data.
We used Review Manager 5 software for data synthesis and analyses (Review Manager 2020). We based quantitative analyses of outcomes on the intention‐to‐treat principle.
We considered all publications of the trials, including protocols and FDA‐ and EMA‐authorised drug reports.
Assessment of risk of bias in included studies
Two review authors independently assessed the risks of bias in each trial using the Cochrane risk of bias tool (Higgins 2021). One review author (LCS) checked all results and the remaining review authors (JG, AA, IG, MJA, JE) participated as a second review author by dividing the whole search results among themselves. Any disagreements were resolved by discussion or by consulting a third review author if necessary.
We reported the overall risk of bias for each of the included studies according to the following:
-
low risk of bias (plausible bias unlikely to seriously alter the results) if all criteria were met;
-
unclear risk of bias (plausible bias that raised some doubt about the results) if one or more criteria were assessed as unclear;
-
high risk of bias (plausible bias that seriously weakens confidence in the results) if one or more criteria were not met.
We planned to perform sensitivity analyses excluding trials with high or high and unclear risk of bias.
Measures of treatment effect
We based quantitative analyses of outcomes on intention‐to‐treat results.
We statistically summarised data on dichotomous outcomes as risk ratios (RRs) with 95% confidence intervals (CIs). We planned to calculate the risk difference (RD) and number needed to treat for an additional beneficial outcome (NNTB).
We summarised continuous outcomes as mean differences (MDs) with a 95% CI.
We combined data for change in blood pressure using mean differences.
Unit of analysis issues
The unit of analysis was individual participants.
Dealing with missing data
We contacted study investigators in the case of missing data. We based the quantitative analyses of outcomes on intention‐to‐treat results.
Assessment of heterogeneity
We planned to examine heterogeneity using the standard Chi2 test and the I2 statistic.
We assessed values of the I2 statistic as follows (Higgins 2021):
-
0% to 40%: heterogeneity might not be important;
-
30% to 60%: moderate heterogeneity;
-
50% to 90%: substantial heterogeneity;
-
75% to 100% considerable heterogeneity.
We planned that if data exhibited more than moderate heterogeneity (I2 greater than 60%), we would investigate possible causes. If the causes of the heterogeneity could not be addressed, we would not perform meta‐analysis.
Assessment of reporting biases
We planned to assess reporting bias following the recommendations on testing for funnel plot asymmetry, as described in the Cochrane Handbook for Systematic Reviews of Interventions (Higgins 2021).
Data synthesis
Two review authors analysed the data in Review Manager 5 (Review Manager 2020), and reported them in accordance with the Cochrane Handbook for Systematic Reviews of Interventions (Higgins 2021).
We planned to use a fixed‐effect model to pool the data in a meta‐analysis. In the presence of statistical heterogeneity (greater than 30%, or P < 0.05 as estimated by the I2 statistic), we used a random‐effects model.
If meta‐analysis was not appropriate, we would describe the results narratively.
Subgroup analysis and investigation of heterogeneity
We planned the following subgroup analyses:
-
people aged less than 75 years versus people aged 75 years or over;
-
men versus women;
-
people with diabetes versus people without diabetes.
Sensitivity analysis
We planned to perform sensitivity analyses to assess the robustness of the results, as follows.
-
According to baseline blood pressure levels:
-
less than 160 mmHg;
-
160 mmHg and over to less than 180 mmHg;
-
180 mmHg and over.
-
-
Pharmaceutical‐sponsored versus independent trials. We considered a trial as pharmaceutical sponsored if this was noted in the publication; if any of the authors worked for a pharmaceutical company; or if the trial was sent to the FDA or EMA for drug authorisation.
-
Excluding trials with high or high and unclear risk of bias.
Summary of findings and assessment of the certainty of the evidence
We created a summary of findings table using the methods and recommendations described in Section 8.5 and Chapter 12 of the Cochrane Handbook for Systematic Reviews of Interventions, along with GRADE Pro GDT software (GRADEpro GDT; Higgins 2021). The outcomes included:
• Total mortality;
• Cardiovascular mortality;
• Cardiovascular events;
• Serious adverse events;
• Withdrawals due to adverse effects;
We used the five GRADE considerations (risk of bias, consistency of effect, imprecision, indirectness, and publication bias) to assess the certainty of a body of evidence as it relates to the studies that contribute data for the prespecified outcomes. We justified all decisions to downgrade the quality of studies using footnotes, and made comments to aid the reader’s understanding of the review where necessary.
Results
Description of studies
See Characteristics of included studies; Characteristics of excluded studies; Characteristics of studies awaiting classification tables.
Results of the search
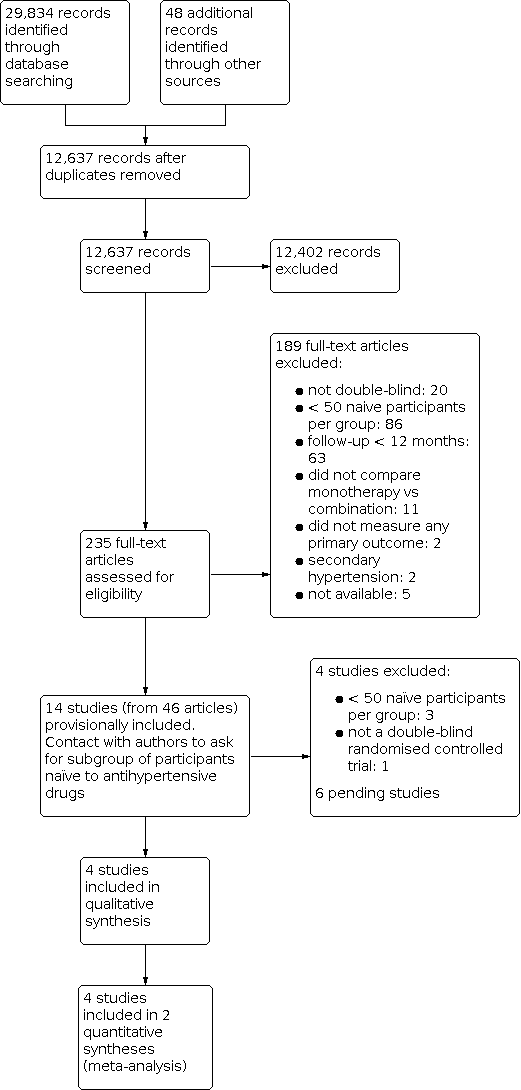
We identified 29,834 records from our searches of the databases and 48 records from additional sources. There remained 12,637 records after removal of duplicates. We screened the titles and abstracts of these records, excluding 12,402 records. We obtained the full‐text articles of 235 records and assessed these for eligibility. We excluded 189 full‐text articles. We provisionally accepted 14 studies (reported in 46 articles) for inclusion whilst we contacted authors for subgroup data. We subsequently included four studies, excluded four studies, and listed six studies as awaiting classification. See Figure 1 for the flow chart of the bibliographic search.

Study flow diagram.
We sought help in checking the inclusion criteria of two full‐text articles written in Chinese and Russian.
We checked 100 clinical studies included in the FDA's Medical Reviews of 24 fixed‐combination drugs, and 70 clinical studies included in the EMA's scientific discussion of the Public Assessment Reports of seven fixed‐combination drugs. None of these studies met our inclusion criteria, primarily due to follow‐up of less than one year. We did not check whether studies included in FDA or EMA reviews were also in the bibliographic search.
Included studies
https://revman.cochrane.org/#/422712022703251559/sofTables#396502466839899200. We found no additional trials for this update. The three originally‐included studies involved 1867 participants with active treatment (monotherapy: 1077 participants; combination: 790 participants). None of the studies was limited to people who initiated antihypertensive treatment, so we asked investigators for this subgroup, which comprised 568 participants, 30% of the total (monotherapy: 335 participants; combination: 233 participants). PREMIER 2003 and BENEDICT‐A 2004 included only people with type 2 diabetes. PREMIER 2003 included only people with albuminuria, whereas BENEDICT‐A 2004 excluded people with albuminuria. REASON 2001 excluded people treated with antidiabetes, hypocholesterolaemia, or cardiovascular drugs. The characteristics of participants included in the review are shown in Table 1. Follow‐up was 12 months in PREMIER 2003 and REASON 2001, and 36 months in BENEDICT‐A 2004. The following therapeutic groups were compared: ACEI/thiazide‐type diuretic versus ACEI (PREMIER 2003); ACEI/thiazide‐type diuretic versus beta‐blocker (REASON 2001); and ACEI/CCB (non‐dihydropyridine) versus ACEI or CCB (non‐dihydropyridine) (BENEDICT‐A 2004). The three trials were industry‐funded.
| Characteristic | Treatment | Mean (standard deviation) | |||
|---|---|---|---|---|---|
| Number of participants | Combination | 115 | 55 | 63 | 116 |
| Monotherapy | 215 | 54 | 66 | 84 | |
| Total participants included in the trial (%) | Combination | 38.08% | 22.78% | 28.09% | 34.83% |
| Monotherapy | 35.54% | 22.54% | 25.82% | 26.09% | |
| Age (years) | Combination | 60.98 (7.62) | 57.27 (8.53) | 52.49 (12.68) | 51.8 (8.2) |
| Monotherapy | 60.62 (8.36) | 59.93 (8.75) | 50.38 (10.57) | 54.0 (9.0) | |
| Sex (% men) | Combination | 67.83% | 74.55% | 71.43% | 56.90% |
| Monotherapy | 69.30% | 77.78% | 62.12% | 61.90% | |
| Ethnicity (% white people) | Combination | 100.00% | 96.36% | 98.41% | 62.1% |
| Monotherapy | 100.00% | 88.89% | 93.94% | 64.3% | |
| Body mass index (kg/m2) | Combination | 28.68 (5.19) | 28.23 (3.18) | 26.85 (3.11) | 29.1 (5.0) |
| Monotherapy | 28.34 (4.42) | 29.22 (3.51) | 26.99 (2.38) | 28.8 (4.7) | |
| Systolic blood pressure (mmHg) | Combination | 151.61 (9.70) | 154.56 (9.86) | 162.56 (11.24) | 140.4 (8.8) |
| Monotherapy | 152.11 (11.57) | 154.04 (11.67) | 158.74 (12.84) | 142.0 (8.4) | |
| Diastolic blood pressure (mmHg) | Combination | 88.72 (7.17) | 90.98 (8.43) | 97.65 (6.89) | 91.7 (7.4) |
| Monotherapy | 89.54 (6.32) | 91.00 (8.26) | 98.94 (5.07) | 90.3 (7.0) | |
PREVER‐treatment 2016 included 655 participants with no current use of antihypertensives and no previous cardiovascular disease. Cardiovascular events was a prespecified secondary outcome. Follow‐up was 18 months. We asked for data for participants who were naïve to antihypertensives, of which there were 200 (monotherapy: 84; combination: 116) (Table 1), 14 (monotherapy: 7; combination: 7) of whom had diabetes. The PREVER‐treatment 2016 study compared a combination pill of thiazide‐type diuretic/potassium‐sparing diuretic versus ARB monotherapy. As potassium‐sparing diuretics are not indicated in monotherapy, but included in the combination arm of this trial, we have presented the results for this study separately. PREVER‐treatment 2016 was not industry‐funded.
Excluded studies
As our objective was the first‐line therapy of hypertension, we discarded numerous studies that compared monotherapy with combination therapy because of failure of monotherapy.
One large study included only people who were not taking antihypertensive drugs. MRC‐O 1992 was conducted in general practices in the UK. Participants aged 65 to 74 years, with systolic blood pressure of 160 mmHg to 209 mmHg and diastolic blood pressure less than 115 mmHg, were randomised to atenolol 50 mg daily (1102 participants) or hydrochlorothiazide 25 mg to 50 mg daily plus amiloride 2.5 mg to 5 mg daily (1081 participants). The regimens were adjusted to achieve target systolic blood pressures of 150 mmHg or less or 160 mmHg or less, depending on baseline blood pressure. Mean follow‐up was 5.8 years. The participants in the combination‐therapy group had fewer cardiovascular deaths and fewer cardiovascular events. There were no statistically significant differences in total mortality (Wiysonge 2017). We excluded this trial because doctors and nurses were not blinded to treatment.
PICXEL 2005 included 556 participants with hypertension and left ventricular hypertrophy who were randomised to receive perindopril 2 mg plus indapamide 0.625 mg or enalapril 10 mg. Doses were increased depending on response. Follow‐up was 12 months. We sought data from participants without prior antihypertensive treatment from the study authors. However, we excluded this trial as there were fewer than 50 participants per group (perindopril/indapamide: 40 participants, enalapril: 46 participants).
DEMAND 2011 included 380 participants aged 40 years or over with hypertension and a known history of type 2 diabetes mellitus for less than 25 years, with urinary albumin excretion of less than 200 μg/minute and serum creatinine of 1.5 mg/dL or less. Participants were randomised to manidipine 10 mg daily plus delapril 30 mg daily, delapril 30 mg daily, or placebo. Target blood pressure was 120/80 mmHg. Additional antihypertensive drugs were allowed to achieve target blood pressure. The mean follow‐up was 47 months. The study authors provided individual participant data, but there were fewer than 50 participants without prior antihypertensive treatment per group (delapril/manidipine: 38 participants, delapril: 33 participants).
BENEDICT‐B 2011 included 281 participants aged 40 years or over with hypertension (defined as an untreated systolic blood pressure of 130 mmHg or greater or diastolic blood pressure of 85 mmHg or greater), history of type 2 diabetes mellitus not exceeding 25 years, urinary albumin excretion rate 20 μg/minute or greater and less than 200 μg/minute, and serum creatinine concentration of 1.5 mg/dL or less. Two categories of participants entered the study: people who had developed microalbuminuria during the BENEDICT‐A 2004 study, and people included after a new screening. Participants were randomised to trandolapril 2 mg daily or trandolapril 2 mg daily plus verapamil 180 mg daily. The target blood pressure was 120/80 mmHg. Additional antihypertensive drugs were allowed to achieve the target blood pressure. Median follow‐up was 4.5 years. The authors provided individual participant data, but there were fewer than 50 participants without prior antihypertensive treatment per group (trandolapril: 39 participants, trandolapril/verapamil: 40 participants).
ONTARGET 2008 included 25,620 participants with coronary, peripheral, or cerebrovascular disease or diabetes with end‐organ damage. Hypertension was not required for inclusion. Participants were randomised to ramipril 10 mg, telmisartan 80 mg, or ramipril 10 mg plus telmisartan 80 mg. We excluded this trial because there was a three‐week run‐in period in which participants received ramipril plus telmisartan, so participants were not naïve to antihypertensive treatment at randomisation.
Zhang 2010 included 124 participants, of which 112 had no history of using any antihypertensive medication, who were randomised to fosinopril/indapamide or fosinopril alone. Follow‐up was 14 months. We excluded this trial because it was not stated to be double‐blind and it did not evaluate any of the primary outcomes.
ACCELERATE 2011 enrolled 1254 participants, of whom 521 were treatment‐naïve, who were randomised to aliskiren 150 mg (a direct renin inhibitor), amlodipine 5 mg, or aliskiren 150 mg plus amlodipine 5 mg. We excluded this trial because follow‐up was only 32 weeks.
PATHWAY‐1 2017 included 605 participants, of whom 269 had never been previously treated for hypertension, who were randomised to monotherapy with losartan or hydrochlorothiazide or a combination of losartan plus hydrochlorothiazide. We excluded this trial because at week 17 all participants receive a forced open‐label combination, so the double‐blind comparison of monotherapy versus combination only lasted 16 weeks.
PREVER‐prevention 2016 randomised 730 participants (372 allocated to chlortalidone plus amiloride versus 358 allocated to placebo). We excluded this study due to its exclusive focus on pre‐hypertension, a condition not within the scope of this review.
Risk of bias in included studies
The assessment of risk of bias is based on both published and unpublished data. Study authors provided clarification of methods for PREMIER 2003 and REASON 2001 and the protocol of BENEDICT‐A 2004. The risk of bias summary of included studies is shown in Figure 2.

Risk of bias summary: review authors' judgements about each risk of bias item for each included study.
Allocation
All four included studies used a computer‐generated randomisation list. The allocation was performed centrally, and study centres received blinded treatments and randomisation numbers. We judged the risk of allocation bias to be low for all included studies.
Blinding
All four included studies were double‐blind, and stated that capsules of identical appearance were used. REASON 2001, BENEDICT‐A 2004, and PREMIER 2003 reported that evaluators were blinded to treatment. PREVER‐treatment 2016 reported that participants, members of the steering committee, healthcare staff, data collectors, and outcome assessors were blinded to the intervention arm. We judged the risk of performance and detection bias to be low for all included studies.
Incomplete outcome data
There were 21 withdrawals in REASON 2001, the reasons for which were not provided. In PREMIER 2003, there were more withdrawals due to lack of efficacy in the monotherapy group (six with monotherapy versus zero with combination therapy). It is unclear if such circumstances could have led to differences in endpoints. BENEDICT‐A 2004 and PREVER‐treatment 2016 did not show a relevant imbalance in reported withdrawals.
Selective reporting
We sent our protocol to investigators asking for outcomes of interest for this review in the subgroup of participants naïve to antihypertensive drugs. Study authors provided aggregate data for REASON 2001, PREMIER 2003, and PREVER‐treatment 2016, and individual participant data for BENEDICT‐A 2004, so we judged selective reporting bias to be low for all studies.
Other potential sources of bias
The inclusion criteria of BENEDICT‐A 2004 were changed during the trial (from untreated blood pressure 140/90 mmHg or greater to 130/85 mmHg or greater). Blood pressure targets were also changed during the trial from 130/85 mmHg to 120/80 mmHg (protocol amendment 3; 27 May 1999).
All data came from subgroups of participants not predefined in the original studies. The outcomes of our review were not the primary outcome in any included trial.
Effects of interventions
See: Summary of findings 1 Combination therapy compared to monotherapy for primary hypertension; Summary of findings 2 Combination with potassium‐sparing diuretics versus monotherapy for primary hypertension
Combination therapy compared to monotherapy for primary hypertension
According to the data summarised in the main summary of findings table (summary of findings Table 1) we did not find any differences in any of the primary outcomes. The results for each individual outcome are presented as follows:
Total mortality: risk ratio (RR) 1.35, 95% confidence interval (CI) 0.08 to 21.72; 3 studies, 568 participants (Analysis 1.1).
Total serious adverse events: RR 0.77, 95% CI 0.31 to 1.92; 3 studies, 568 participants (Analysis 1.2).
Total cardiovascular events: RR 0.98, 95% CI 0.22 to 4.41; 3 studies, 568 participants (Analysis 1.3).
Cardiovascular mortality: zero events in the three included studies (Analysis 1.4).
Withdrawals due to adverse effects: RR 0.85, 95% CI 0.53 to 1.35; 3 studies, 568 participants (Analysis 1.5).
The large heterogeneity precluded aggregating results of 'reaching blood pressure control' (Analysis 1.6). Separating in subgroups by blood pressure target did not address this heterogeneity. Some explanation can be provided by differences in how trials were conducted. In REASON 2001, the dose was doubled after three months if blood pressure remained above 160/90 mmHg, whereas in PREMIER 2003 the dose was doubled after three months if blood pressure remained above 140/90 mmHg. Despite this, target blood pressure was defined as less than 140/90 mmHg in data provided by investigators in both trials. Another factor may be that REASON 2001 used atenolol as monotherapy, but it was not included in the combination therapy.
At the end of one year, there were no statistically significant differences in change of systolic blood pressure (mean difference −2.06, 95% CI −5.39 to 1.27; 3 studies, 568 participants Analysis 1.7) or diastolic blood pressure (mean difference −0.12, 95% CI −1.21 to 0.96; 2 studies, 443 participants Analysis 1.8) between groups started with monotherapy or with combination therapy. However, the CIs included differences larger than 5 mmHg for systolic blood pressure.
Only BENEDICT‐A 2004 provided separate results data for men and women. The scarcity of events for mortality, cardiovascular mortality, cardiovascular events, and 'reaching blood pressure control' precluded subgroup analysis for these outcomes. There was no indication of a different effect in serious adverse events (Analysis 2.1), withdrawals due to adverse effects (Analysis 2.2), or changes in blood pressure at one year (Analysis 2.3; Analysis 2.4). However, there were too few women to draw any conclusions. BENEDICT‐A 2004 also provided individual data for the age of participants, but as this study only included 17 people aged 75 years or older, data were insufficient to provide results for this subgroup.
The number of participants included in our review, and hence the number of events, was clearly insufficient to reach any conclusion about the different effect of initiating treatment with combination therapy versus monotherapy on important outcomes. Similarly, we considered the scarce available information to be insufficient to support the aforementioned sensitivity analyses.
Combination with potassium‐sparing diuretics versus monotherapy for primary hypertension
A single study (PREVER‐treatment 2016) provided data for this comparison. According to the data summarised in summary of findings Table 2, we did not find any differences in any of the primary outcomes. The results for each individual outcome are presented as follows:
Total mortality: RR 0.24, 95% CI 0.01 to 5.87; 1 study, 200 participants (Analysis 3.1).
Total serious adverse events: RR 0.72, 95% CI 0.10 to 5.04; 1 study, 200 participants (Analysis 3.2).
Total cardiovascular events: RR 1.45, 95% CI 0.13 to 15.71; 1 study, 200 participants (Analysis 3.3).
Cardiovascular mortality: zero events (Analysis 3.4).
Withdrawals due to adverse effects: zero events (Analysis 3.5).
Reaching blood pressure control: there were no statistically significant differences for this outcome. RR 1.15, 95% CI 0.93 to 1.42; 1 study, 200 participants (Analysis 3.6).
In the trial using a combination of thiazide‐type diuretic/potassium‐sparing diuretic, little information was available and no differences were identified between the interventions for total mortality, serious adverse events, cardiovascular events or reaching blood pressure control. The absence of events for cardiovascular mortality and withdrawals due to adverse effects precluded any conclusion about the effect of the interventions. No sensitivity analysis was performed, due to a lack of information.
Discussion
Summary of main results
For the comparison of combination therapy versus monotherapy, the number of participants (568) and hence the number of events, was very small. This led to very wide confidence intervals for the risk ratio of total mortality (RR 1.35, 95% CI 0.08 to 21.72), cardiovascular mortality (zero events reported), cardiovascular events (RR 0.98, 95% CI 0.22 to 4.41), serious adverse events (RR 0.77, 95% CI 0.31 to 1.92), and withdrawals due to adverse events (RR 0.85, 95% CI 0.53 to 1.35).
For the comparison of combination with potassium‐sparing diuretics versus monotherapy (200 participants), there were also few events, as well as substantial imprecision in results: total mortality (RR 0.24, 95% CI 0.01 to 5.87), cardiovascular mortality (zero events reported), cardiovascular events (RR 1.45, 95% CI 0.13 to 15.71), serious adverse events (RR 0.72, 95% CI 0.10 to 5.04), and withdrawals due to adverse events (zero events reported).
Confidence intervals included both substantial benefit and harm of combination therapy or combination with potassium‐sparing diuretics compared to monotherapy.
Overall completeness and applicability of evidence
Despite the huge number of clinical trials with antihypertensive drug combinations, our search was nearly fruitless. The reasons for excluding studies merit consideration.
-
No naïve participants: clinical trials are not addressing questions that doctors face in everyday practice. The inclusion of participants with and without previous antihypertensive treatment facilitates recruitment but impairs the interpretation and applicability of results. Clinical practice guidelines address the question, but recommendations are based on indirect evidence at best.
-
Follow‐up less than 12 months: there are numerous trials of short duration (eight to 12 weeks) that mostly respond to regulatory requirements for pharmaceutical companies. Follow‐ups of this length are not sufficient to provide results of hard clinical outcomes in a chronic condition like hypertension.
The dangers of relying only on theoretical or pharmacological considerations are well illustrated with the case of combinations of drugs targeting the renin‐angiotensin system. Some authors have recommended these drugs because they act at different levels of the physiological pathway and could have synergic actions. However, when those combinations were compared with monotherapy in large clinical trials with hard endpoints, the results were more adverse effects (including hypotension, hyperkalaemia, and renal failure), with no benefits in people without heart failure, despite greater reductions in blood pressure (ALTITUDE 2012; Makani 2013; ONTARGET 2008). Those results led regulatory agencies to amend product information to say that the combined use of ACEIs, ARBs or aliskiren is not recommended (EMA/294911/2014; FDA 2014).
Quality of the evidence
Although the included trials were at low risk of bias, the overall certainty of the evidence was very low. The reasons for downgrading the certainty of evidence were as follows.
-
Risk of bias due to using subgroups that were not defined in advance. On the other hand, our review outcomes were not defined as a primary outcome for any included trial.
-
Indirectness due to two trials including only people with type 2 diabetes, whereas another trial excluded participants treated with drugs for diabetes, hypocholesterolaemia or cardiovascular disease, so these trials were not fully representative of the hypertensive population.
-
Imprecision, because very few events were reported and confidence intervals were wide. Trials were underpowered to assess mortality or cardiovascular events. The need to select the subgroup of participants naïve to antihypertensives further reduced the sample size.
Potential biases in the review process
As stated above, one potential bias introduced into the review process was that we could not use the whole population of the trials, but only a subgroup.
We excluded MRC‐O 1992, which was not double‐blind. It could be argued that the evidence from this study may be as uncertain as that from the small subgroups of participants of the included trials. In the discussions that occurred during the design of our protocol, we decided to limit the inclusion criteria to double‐blind trials because we believed there was a high risk of different care or co‐interventions if doctors judged that participants were receiving treatments of different intensity.
Agreements and disagreements with other studies or reviews
In one large clinical trial that focused on people who were not taking antihypertensive drugs (MRC‐O 1992), there were better results in terms of cardiovascular morbidity and mortality with combination therapy than with monotherapy. There were no statistically significant differences between groups for all‐cause mortality. The drugs compared in the trial were hydrochlorothiazide/amiloride versus a beta‐blocker (atenolol) (see Excluded studies). It is unclear if the differences could have arisen from the different classes of drugs used. However, one systematic review did not find differences between diuretics and beta‐blockers for those outcomes (Wiysonge 2017), so the use of a combination of two diuretics with different mechanisms of action could have influenced the results. We did not include this trial because it was not double‐blind.
One systematic review included 42 clinical trials of a factorial design with durations of between four and 12 weeks (Wald 2009). One review included 354 trials (50 studying combination therapy) (Law 2003a; Law 2003b). The median duration was four weeks (range two to 15 weeks). The authors of these studies did not find any trials of sufficient duration to meet our inclusion criteria. They concluded that combination therapy is the preferred initial strategy in the treatment of hypertension (Law 2003a), but this statement was not based on results of hard clinical endpoints with combination therapy but on indirect evidence. They based their conclusions on the larger reduction of blood pressure obtained with combination therapy. However, we found no differences in blood pressure reductions attained after one year.
The JNC 8 2014 guideline supports both strategies: start with monotherapy, and begin with two drugs either as separate tablets or as a single tablet combination. The guideline's evidence review found no randomised controlled trials that compared monotherapy versus combination therapy and that assessed important health outcomes. The guideline acknowledges that it is unknown if one of the strategies results in improved cardiovascular, cerebrovascular, or kidney outcomes or mortality compared with the alternative strategy.
The guidelines of the American College of Cardiology, the American Heart Association, and several other organisations recommend the initiation of antihypertensive therapy with two first‐line agents of different classes in adults with stage 2 hypertension and an average blood pressure more than 20/10 mmHg above their target (Whelton 2018). These guidelines support the initiation with a single antihypertensive drug in adults with stage 1 hypertension, with dosage titration and the sequential addition of other agents to achieve the target. These statements are based on expert opinion, since the systematic review performed in support of this guideline (Reboussin 2018) compared the initiation of antihypertensive treatment with monotherapy and sequential (stepped‐care) titration of additional agents versus initiation of treatment with combination therapy, but it did not identify any randomised controlled trial meeting the systematic review questions.
The ESH/ESC 2018 guideline recognises that no randomised controlled trial has compared major cardiovascular outcomes between initial combination therapy and monotherapy. In spite of this, it makes a strong recommendation to initiate an antihypertensive treatment with a two‐drug combination, with the exceptions of frail older people and those at low risk and with stage 1 hypertension.
The NICE 2019 guideline recommends starting with monotherapy. Its evidence review addresses the question "Is monotherapy or combination antihypertensive therapy more clinically and cost effective for step 1 treatment for hypertension?". The population comprises adults with primary hypertension who are not on current pharmacological treatment for hypertension (minimum wash‐out four weeks), unlike our review, which includes only naïve participants. The NICE guideline includes PREMIER 2003, REASON 2001, and PICXEL 2005 trials. It found no statistically significant differences, with very low‐certainty evidence for the outcomes of serious cardiovascular events and discontinuation due to adverse events.
Recent retrospective cohort studies have performed comparisons between initiating antihypertensive treatment with monotherapy or with combination therapy. A study promoted by a pharmaceutical company that used the The Health Improvement Network UK general practice database (THIN) found that 96% of patients were initiated on monotherapy. The odds of achieving blood pressure control were higher in those initiating treatment with combination therapy. Surprisingly, patients with diabetes and those with grade 2 to 3 hypertension or with high normal/grade 1 hypertension plus at least one cardiovascular condition pretreatment were less likely than patients with no risk factors to receive combination therapy (Weir 2017). Another study, using the healthcare use database of the Lombardy Region (Italy), compared starting treatment with one antihypertensive drug versus a two‐drug fixed‐dose combination (patients who started with a free drug combination were excluded). This study was funded by a pharmaceutical company. Eighty‐three per cent of patients started treatment with one drug. Patients with combination therapy less frequently had a history of hospitalisation for cardiovascular diseases. Starting with combination therapy had a lower one‐year risk of hospitalisation for cardiovascular events (hazard ratio 0.85, 95% CI 0.74 to 0.97) after matching by a high‐dimensional propensity score (Rea 2018).
Our review confirms the lack of evidence from randomised controlled trials addressing this question. In addition, the possibility of increasing cost without evidence of benefit must be considered, especially in low‐income environments.
Study flow diagram.

Risk of bias summary: review authors' judgements about each risk of bias item for each included study.

Comparison 1: Combination therapy versus monotherapy, Outcome 1: Total mortality

Comparison 1: Combination therapy versus monotherapy, Outcome 2: Serious adverse events

Comparison 1: Combination therapy versus monotherapy, Outcome 3: Cardiovascular events

Comparison 1: Combination therapy versus monotherapy, Outcome 4: Cardiovascular mortality

Comparison 1: Combination therapy versus monotherapy, Outcome 5: Withdrawals due to adverse effects

Comparison 1: Combination therapy versus monotherapy, Outcome 6: Reaching blood pressure control

Comparison 1: Combination therapy versus monotherapy, Outcome 7: Systolic blood pressure change from baseline at end of 1 year

Comparison 1: Combination therapy versus monotherapy, Outcome 8: Diastolic blood pressure change from baseline at end of 1 year

Comparison 2: Combination therapy versus monotherapy (men versus women), Outcome 1: Serious adverse events

Comparison 2: Combination therapy versus monotherapy (men versus women), Outcome 2: Withdrawals due to adverse effects

Comparison 2: Combination therapy versus monotherapy (men versus women), Outcome 3: Systolic blood pressure change from baseline at end of 1 year

Comparison 2: Combination therapy versus monotherapy (men versus women), Outcome 4: Diastolic blood pressure change from baseline at end of 1 year

Comparison 3: Combination with potassium‐sparing diuretics versus monotherapy, Outcome 1: Total mortality

Comparison 3: Combination with potassium‐sparing diuretics versus monotherapy, Outcome 2: Serious adverse events

Comparison 3: Combination with potassium‐sparing diuretics versus monotherapy, Outcome 3: Cardiovascular events

Comparison 3: Combination with potassium‐sparing diuretics versus monotherapy, Outcome 4: Cardiovascular mortality

Comparison 3: Combination with potassium‐sparing diuretics versus monotherapy, Outcome 5: Withdrawals due to adverse effects

Comparison 3: Combination with potassium‐sparing diuretics versus monotherapy, Outcome 6: Reaching blood pressure control
| Combination therapy compared to monotherapy for primary hypertension | |||||
| Patient or population: people with primary hypertension | |||||
| Outcomes | Anticipated absolute effects* (95% CI) | Relative effect | № of participants | Certainty of the evidence | |
|---|---|---|---|---|---|
| Risk with monotherapy | Risk with combination therapy | ||||
| Total mortality Follow‐up: 12 to 36 months | 3 per 1000 | 4 per 1000 | RR 1.35 | 568 | ⊕⊝⊝⊝ |
| Cardiovascular mortality Follow‐up: 12 to 36 months | 0 per 1000 | 0 per 1000 | Not estimable | 568 | ⊕⊝⊝⊝ |
| Cardiovascular events Follow‐up: 12 to 36 months | 9 per 1000 | 9 per 1000 | RR 0.98 | 568 | ⊕⊝⊝⊝ |
| Serious adverse events Follow‐up: 12 to 36 months | 176 per 1000 | 136 per 1000 | RR 0.77 | 568 | ⊕⊝⊝⊝ |
| Withdrawals due to adverse effects Follow‐up: 12 to 36 months | 128 per 1000 | 109 per 1000 | RR 0.85 | 568 | ⊕⊝⊝⊝ |
| *The risk in the intervention group (and its 95% confidence interval) is based on the assumed risk in the comparison group and the relative effect of the intervention (and its 95% CI). | |||||
| GRADE Working Group grades of evidence | |||||
| aWe downgraded by one level for serious risk of bias because all data came from subgroups of participants not predefined in the original studies, and the outcomes of our review were not the primary outcome in any included trial. | |||||
| Combination with potassium‐sparing diuretics versus monotherapy for primary hypertension | |||||
| Patient or population: people with primary hypertension | |||||
| Outcomes | Anticipated absolute effects* (95% CI) | Relative effect | № of participants | Certainty of the evidence | |
|---|---|---|---|---|---|
| Risk with monotherapy | Risk with combination with potassium‐sparing diuretics | ||||
| Total mortality Follow‐up: 18 months | 12 per 1000 | 3 per 1000 | RR 0.24 | 200 | ⊕⊝⊝⊝ |
| Cardiovascular mortality Follow‐up: 18 months | 0 per 1000 | 0 per 1000 | Not estimable | 200 | ⊕⊝⊝⊝ |
| Cardiovascular events Follow‐up: 18 months | 12 per 1000 | 17 per 1000 | RR 1.45 | 200 | ⊕⊝⊝⊝ |
| Serious adverse events Follow‐up: 18 months | 24 per 1000 | 17 per 1000 | RR 0.72 | 200 | ⊕⊝⊝⊝ |
| Withdrawals due to adverse effects Follow‐up: 18 months | 0 per 1000 | 0 per 1000 | Not estimable | 200 | ⊕⊝⊝⊝ |
| *The risk in the intervention group (and its 95% confidence interval) is based on the assumed risk in the comparison group and the relative effect of the intervention (and its 95% CI). | |||||
| GRADE Working Group grades of evidence | |||||
| aWe downgraded by one level for serious risk of bias because all data came from a subgroup of participants not predefined in the original study, and outcomes of our review were not the primary outcome in the trial. | |||||
| Characteristic | Treatment | Mean (standard deviation) | |||
|---|---|---|---|---|---|
| Number of participants | Combination | 115 | 55 | 63 | 116 |
| Monotherapy | 215 | 54 | 66 | 84 | |
| Total participants included in the trial (%) | Combination | 38.08% | 22.78% | 28.09% | 34.83% |
| Monotherapy | 35.54% | 22.54% | 25.82% | 26.09% | |
| Age (years) | Combination | 60.98 (7.62) | 57.27 (8.53) | 52.49 (12.68) | 51.8 (8.2) |
| Monotherapy | 60.62 (8.36) | 59.93 (8.75) | 50.38 (10.57) | 54.0 (9.0) | |
| Sex (% men) | Combination | 67.83% | 74.55% | 71.43% | 56.90% |
| Monotherapy | 69.30% | 77.78% | 62.12% | 61.90% | |
| Ethnicity (% white people) | Combination | 100.00% | 96.36% | 98.41% | 62.1% |
| Monotherapy | 100.00% | 88.89% | 93.94% | 64.3% | |
| Body mass index (kg/m2) | Combination | 28.68 (5.19) | 28.23 (3.18) | 26.85 (3.11) | 29.1 (5.0) |
| Monotherapy | 28.34 (4.42) | 29.22 (3.51) | 26.99 (2.38) | 28.8 (4.7) | |
| Systolic blood pressure (mmHg) | Combination | 151.61 (9.70) | 154.56 (9.86) | 162.56 (11.24) | 140.4 (8.8) |
| Monotherapy | 152.11 (11.57) | 154.04 (11.67) | 158.74 (12.84) | 142.0 (8.4) | |
| Diastolic blood pressure (mmHg) | Combination | 88.72 (7.17) | 90.98 (8.43) | 97.65 (6.89) | 91.7 (7.4) |
| Monotherapy | 89.54 (6.32) | 91.00 (8.26) | 98.94 (5.07) | 90.3 (7.0) | |
| Outcome or subgroup title | No. of studies | No. of participants | Statistical method | Effect size |
| 1.1 Total mortality Show forest plot | 3 | 568 | Risk Ratio (M‐H, Random, 95% CI) | 1.35 [0.08, 21.72] |
| 1.1.1 People with diabetes | 2 | 439 | Risk Ratio (M‐H, Random, 95% CI) | 1.35 [0.08, 21.72] |
| 1.1.2 People without diabetes | 1 | 129 | Risk Ratio (M‐H, Random, 95% CI) | Not estimable |
| 1.2 Serious adverse events Show forest plot | 3 | 568 | Risk Ratio (M‐H, Random, 95% CI) | 0.77 [0.31, 1.92] |
| 1.2.1 People with diabetes | 2 | 439 | Risk Ratio (M‐H, Random, 95% CI) | 0.62 [0.24, 1.64] |
| 1.2.2 People without diabetes | 1 | 129 | Risk Ratio (M‐H, Random, 95% CI) | 3.14 [0.34, 29.42] |
| 1.3 Cardiovascular events Show forest plot | 3 | 568 | Risk Ratio (M‐H, Fixed, 95% CI) | 0.98 [0.22, 4.41] |
| 1.3.1 People with diabetes | 2 | 439 | Risk Ratio (M‐H, Fixed, 95% CI) | 0.62 [0.10, 3.95] |
| 1.3.2 People without diabetes | 1 | 129 | Risk Ratio (M‐H, Fixed, 95% CI) | 3.14 [0.13, 75.69] |
| 1.4 Cardiovascular mortality Show forest plot | 3 | 568 | Risk Ratio (M‐H, Fixed, 95% CI) | Not estimable |
| 1.4.1 People with diabetes | 2 | 439 | Risk Ratio (M‐H, Fixed, 95% CI) | Not estimable |
| 1.4.2 People without diabetes | 1 | 129 | Risk Ratio (M‐H, Fixed, 95% CI) | Not estimable |
| 1.5 Withdrawals due to adverse effects Show forest plot | 3 | 568 | Risk Ratio (M‐H, Fixed, 95% CI) | 0.85 [0.53, 1.35] |
| 1.5.1 People with diabetes | 2 | 439 | Risk Ratio (M‐H, Fixed, 95% CI) | 0.81 [0.49, 1.35] |
| 1.5.2 People without diabetes | 1 | 129 | Risk Ratio (M‐H, Fixed, 95% CI) | 1.05 [0.32, 3.45] |
| 1.6 Reaching blood pressure control Show forest plot | 3 | Risk Ratio (M‐H, Random, 95% CI) | Subtotals only | |
| 1.6.1 People with diabetes, target ≤ 120/80 mmHg | 1 | 314 | Risk Ratio (M‐H, Random, 95% CI) | 0.18 [0.01, 3.18] |
| 1.6.2 People with diabetes, target ≤ 140/90 mmHg | 1 | 105 | Risk Ratio (M‐H, Random, 95% CI) | 2.00 [1.24, 3.22] |
| 1.6.3 People without diabetes, target ≤ 140/90 mmHg | 1 | 129 | Risk Ratio (M‐H, Random, 95% CI) | 0.89 [0.62, 1.28] |
| 1.7 Systolic blood pressure change from baseline at end of 1 year Show forest plot | 3 | 548 | Mean Difference (IV, Random, 95% CI) | ‐2.06 [‐5.39, 1.27] |
| 1.7.1 People with diabetes | 2 | 419 | Mean Difference (IV, Random, 95% CI) | ‐2.54 [‐8.27, 3.19] |
| 1.7.2 People without diabetes | 1 | 129 | Mean Difference (IV, Random, 95% CI) | ‐2.33 [‐7.28, 2.62] |
| 1.8 Diastolic blood pressure change from baseline at end of 1 year Show forest plot | 2 | 443 | Mean Difference (IV, Fixed, 95% CI) | ‐0.12 [‐1.21, 0.96] |
| 1.8.1 People with diabetes | 1 | 314 | Mean Difference (IV, Fixed, 95% CI) | ‐0.39 [‐1.56, 0.78] |
| 1.8.2 People without diabetes | 1 | 129 | Mean Difference (IV, Fixed, 95% CI) | 1.45 [‐1.40, 4.30] |
| Outcome or subgroup title | No. of studies | No. of participants | Statistical method | Effect size |
| 2.1 Serious adverse events Show forest plot | 1 | Risk Ratio (M‐H, Fixed, 95% CI) | Subtotals only | |
| 2.1.1 Women | 1 | 103 | Risk Ratio (M‐H, Fixed, 95% CI) | 1.25 [0.52, 3.00] |
| 2.1.2 Men | 1 | 227 | Risk Ratio (M‐H, Fixed, 95% CI) | 0.75 [0.45, 1.24] |
| 2.2 Withdrawals due to adverse effects Show forest plot | 1 | Risk Ratio (M‐H, Fixed, 95% CI) | Subtotals only | |
| 2.2.1 Women | 1 | 103 | Risk Ratio (M‐H, Fixed, 95% CI) | 1.27 [0.43, 3.73] |
| 2.2.2 Men | 1 | 227 | Risk Ratio (M‐H, Fixed, 95% CI) | 0.83 [0.42, 1.66] |
| 2.3 Systolic blood pressure change from baseline at end of 1 year Show forest plot | 1 | Mean Difference (IV, Fixed, 95% CI) | Subtotals only | |
| 2.3.1 Women | 1 | 97 | Mean Difference (IV, Fixed, 95% CI) | 1.74 [‐2.10, 5.58] |
| 2.3.2 Men | 1 | 217 | Mean Difference (IV, Fixed, 95% CI) | ‐1.03 [‐3.25, 1.19] |
| 2.4 Diastolic blood pressure change from baseline at end of 1 year Show forest plot | 1 | Mean Difference (IV, Fixed, 95% CI) | Subtotals only | |
| 2.4.1 Women | 1 | 97 | Mean Difference (IV, Fixed, 95% CI) | 0.47 [‐1.96, 2.90] |
| 2.4.2 Men | 1 | 217 | Mean Difference (IV, Fixed, 95% CI) | ‐0.77 [‐2.08, 0.54] |
| Outcome or subgroup title | No. of studies | No. of participants | Statistical method | Effect size |
| 3.1 Total mortality Show forest plot | 1 | 200 | Risk Ratio (M‐H, Fixed, 95% CI) | 0.24 [0.01, 5.87] |
| 3.2 Serious adverse events Show forest plot | 1 | 200 | Risk Ratio (M‐H, Fixed, 95% CI) | 0.72 [0.10, 5.04] |
| 3.3 Cardiovascular events Show forest plot | 1 | 200 | Risk Ratio (M‐H, Fixed, 95% CI) | 1.45 [0.13, 15.71] |
| 3.4 Cardiovascular mortality Show forest plot | 1 | 200 | Risk Ratio (M‐H, Fixed, 95% CI) | Not estimable |
| 3.5 Withdrawals due to adverse effects Show forest plot | 1 | 200 | Risk Ratio (M‐H, Fixed, 95% CI) | Not estimable |
| 3.6 Reaching blood pressure control Show forest plot | 1 | 200 | Risk Ratio (M‐H, Fixed, 95% CI) | 1.15 [0.93, 1.42] |