Terapi kombinasi utama berbanding monoterapi utama untuk hipertensi primer
Abstract
Background
Starting with one drug and starting with a combination of two drugs are strategies suggested in clinical guidelines as initial treatment of hypertension. The recommendations are not based on evidence about clinically relevant outcomes. Some antihypertensive combinations have been shown to be harmful. The actual harm‐to‐benefit balance of each strategy is unknown.
Objectives
To determine if there are differences in clinical outcomes between monotherapy and combination therapy as initial treatment for primary hypertension.
Search methods
We searched the Hypertension Group Specialised Register, the Cochrane Central Register of Controlled Trials (CENTRAL, 2016, Issue 2), Ovid MEDLINE, Ovid Embase, LILACS, ClinicalTrials.gov, Current Controlled Trials, and the World Health Organization International Clinical Trials Registry Platform (WHO ICTRP) up to February 2016. We searched in clinical studies repositories of pharmaceutical companies, reviews of combination drugs in Food and Drug Administration and European Medicines Agency, and lists of references in reviews and clinical practice guidelines.
Selection criteria
Randomized, double‐blind trials with at least 12 months' follow‐up in adults with primary hypertension (systolic blood pressure/diastolic blood pressure 140/90 mmHg or higher, or 130/80 mmHg or higher if participants had diabetes), which compared combination of two first‐line antihypertensive drug with monotherapy as initial treatment. Trials had to include at least 50 participants per group and report mortality, cardiovascular mortality, cardiovascular events or serious adverse events.
Data collection and analysis
Two authors independently selected trials for inclusion, evaluated the risk of bias and entered the data. Primary outcomes were mortality, serious adverse events, cardiovascular events and cardiovascular mortality. Secondary outcomes were withdrawals due to drug‐related adverse effects, reaching blood pressure control (as defined in each trial) and blood pressure change from baseline. Analyses were based on the intention‐to‐treat principle. We summarized data on dichotomous outcomes as risk ratios with 95% confidence intervals.
Main results
We found three studies in which a subgroup of participants met our inclusion criteria. None of the studies focused solely on people initiating antihypertensive treatment so we asked investigators for data for this subgroup (monotherapy: 335 participants; combination therapy: 233 participants). They included outpatients, and mostly European and white people. Two trials included only people with type 2 diabetes, whereas the other trial excluded people treated with diabetes, hypocholesterolaemia or cardiovascular drugs. The follow‐up was 12 months in two trials and 36 months in one trial. Certainty of evidence was very low due to the serious imprecision, and for using a subgroup not defined in advance. Confidence intervals were extremely wide for all important outcomes and included both appreciable harm and benefit.
Authors' conclusions
The numbers of included participants and, hence the number of events, were too small to draw any conclusion about the relative efficacy of monotherapy versus combination therapy as initial treatment for primary hypertension. There is a need for large clinical trials that address the question and report clinically relevant endpoints.
PICO
Ringkasan bahasa mudah
Memulakan rawatan hipertensi dengan satu ubat berbanding kombinasi dua ubat
Latar belakang
Hipertensi (tekanan darah tinggi) adalah keadaan jangka panjang yang meningkatkan risiko masalah kesihatan seperti serangan jantung, strok atau penyakit buah pinggang. Terdapat beberapa jenis ubat‐ubatan yang digunakan untuk merawat hipertensi. Lama‐kelamaan, seseorang sering memerlukan lebih daripada satu jenis ubat untuk mengawal tekanan darah. Apabila doktor mempreskripsi ubat‐ubatan bagi mengurangkan tekanan darah untuk kali pertama, dia mempunyai dua pilihan, menggunakan hanya satu ubat (dikenali sebagai monoterapi) atau menggunakan dua ubat (dikenali sebagai terapi kombinasi). Terapi kombinasi boleh dalam satu tablet atau tablet yang berbeza. Kelebihan potensi menggunakan terapi kombinasi adalah tekanan darah boleh dikurangkan lebih cepat, tetapi kita tidak tahu samada ini adalah lebih baik atau lebih teruk untuk mengelakkan masalah‐masalah kesihatan.
Ciri kajian
Kami melihat kepada kajian‐kajian klinikal yang membandingkan memulakan rawatan hipertensi dalam kalangan dewasa dengan monoterapi berbanding memulakan terapi kombinasi. Kajian‐kajian perlu melaporkan keputusan dalam aspek kematian, kejadian akibat penyakit jantung atau salur darah (serangan jantung, strok atau kegagalan jantung); kematian akibat penyakit jantung atau saluran darah, atau mana‐mana kesan sampingan serius berkaitan kesihatan. Kami hanya memilih kajian dengan 50 atau lebih orang setiap kumpulan dan kajian mengambil masa sekurang‐kurangnya 12 bulan. Bukti‐bukti adalah terkini sehingga Februari 2016.
Keputusan utama dan ketepatan bukti
Kami menjumpai tiga kajian yang menepati kriteria kami dengan 233 orang dirawat dengan terapi kombinasi dan 335 dirawat dengan monoterapi. Walau bagaimanapun, kami tidak menjumpai data yang cukup untuk menjawab soalan kami. Kajian yang lebih besar adalah perlu yang membandingkan monoterapi dengan terapi kombinasi sebagai rawatan utama hipertensi.
Authors' conclusions
Summary of findings
| Combination therapy versus monotherapy for primary hypertension | ||||||
| Patient or population: people with primary hypertension | ||||||
| Outcomes | Illustrative comparative risks* (95% CI) | Relative effect | No of participants | Certainty of the evidence | Comments | |
| Assumed risk | Corresponding risk | |||||
| Monotherapy | Combination therapy | |||||
| Total mortality | 3 per 1000 | 4 per 1000 | RR 1.35 | 568 | ⊕⊝⊝⊝ | ‐ |
| Cardiovascular mortality | See footnote4 | See footnote4 | Not estimable | 568 | ⊕⊝⊝⊝ | ‐ |
| Cardiovascular events | 9 per 1000 | 9 per 1000 | RR 0.98 | 568 | ⊕⊝⊝⊝ | ‐ |
| Serious adverse events | 176 per 1000 | 136 per 1000 | RR 0.77 | 568 | ⊕⊝⊝⊝ | ‐ |
| Withdrawals due to adverse effects | 128 per 1000 | 109 per 1000 | RR 0.85 | 568 | ⊕⊝⊝⊝ | ‐ |
| *The basis for the assumed is the mean monotherapy group risk across studies. The corresponding risk (and its 95% confidence interval) is based on the assumed risk in the combination group and the relative effect of the intervention (and its 95% CI). | ||||||
| GRADE Working Group grades of evidence | ||||||
| 1 All data come from subgroups of participants not predefined in the original studies. Outcomes of our review were not the primary outcome in any included trial. | ||||||
Background
Description of the condition
Elevated blood pressure (hypertension), arbitrarily defined as systolic blood pressure of 140 mmHg or greater or diastolic blood pressure of 90 mmHg or greater, is a risk factor for stroke, myocardial infarction, renal failure, congestive heart failure and peripheral artery disease. There is a graded relation between blood pressure and the risk of cardiovascular disease (NICE 2011; ESH‐ESC 2013). In over 90% of cases, it is primary hypertension as there is no secondary cause that can be determined (NICE 2011). The main goal of attempts to lower the blood pressure is to prevent cardiovascular morbidity and death, without adversely affecting quality of life. Blood pressure reduction per se is one of the main approaches to cardiovascular risk reduction (Law 2009; Gradman 2010).
Description of the intervention
Stepped therapy constitutes the usual initial approach in most people with hypertension, increasing the dose of the first drug or adding other drugs if blood pressure targets are not reached. First‐line low‐dose thiazides have the best evidence for reducing mortality and morbidity (Wright 2009). Guidelines that are often based on lower levels of evidence have suggested other classes for first‐line therapy in addition to thiazides including: beta‐blockers, angiotensin‐converting enzyme inhibitors (ACEIs), angiotensin receptor blockers (ARBs) and calcium channel blockers (CCBs) (ESH‐ESC 2013; CHEP 2015). They also suggest that determination of the need for drug therapy is based on a combined assessment of the blood pressure level and the risk of cardiovascular disease. Available data suggest that at least 75% of people with hypertension will require combination therapy to achieve blood pressure targets (Gradman 2010).
Using a combination of two antihypertensive drugs as initial therapy has the aim of providing a faster reduction of blood pressure. The preferred drug combinations are ACEI or ARB with a thiazide‐type diuretic or CCB, and thiazide‐type diuretic with CCB (ESH‐ESC 2013; CHEP 2015). In one large trial with high‐risk participants, ACEI/CCB combination resulted in fewer cardiovascular events than ACEI/hydrochlorothiazide (ACCOMPLISH 2008). Guidelines have suggested that chlorthalidone and indapamide have better evidence of benefit on clinical outcomes than bendroflumethiazide or hydrochlorothiazide (NICE 2011), however, that is not supported by evidence from randomized controlled trials (Wright 2009). Furthermore, most single‐pill combinations include hydrochlorothiazide. The combination of ACEI and ARB is not recommended (ESH‐ESC 2013; JNC 8 2014; CHEP 2015).
How the intervention might work
Treatment of hypertension reduces the risk of stroke, coronary artery disease and congestive heart failure, as well as overall cardiovascular morbidity and mortality from cardiovascular causes. Stepped antihypertensive therapy starting with low‐dose thiazides reduces mortality and cardiovascular morbidity (Wright 2009), and in head‐to‐head trials, first‐line thiazides are better at reducing total cardiovascular events than first‐line beta‐blockers (Wiysonge 2012), first‐line drugs inhibiting the renin‐angiotensin system (Xue 2015), and first‐line CCBs (Chen 2010).
The clinical practice guideline from the National Institute for Health and Care excellence (NICE) recommends monotherapy as the initial approach (NICE 2011). People with diabetes are excluded from its scope. For people with type 2 diabetes, the NICE guideline also recommends monotherapy as first‐line therapy (NICE 2008). Exceptions to this are people of African‐Caribbean descent for whom it recommends an ACEI plus either a diuretic or a CCB. Guidelines from the European Society of Hypertension (ESH) and of the European Society of Cardiology (ESC) state that initial treatment can make use of monotherapy or combination of two drugs at low doses with a subsequent increase in drug doses or number, if needed (ESH‐ESC 2013). Monotherapy could be the initial treatment for a mild blood pressure elevation with low or moderate cardiovascular risk. A combination of two drugs at low doses should be preferred as first‐step treatment when systolic blood pressure is greater than 160 mmHg and/or diastolic blood pressure is greater than 100 mmHg, or total cardiovascular risk is high or very high. Some current guidelines suggest that two drugs be used for initial therapy if there is an elevation in blood pressure of 20 mmHg systolic or 10 mmHg diastolic above goal (ESH‐ESC 2013; JNC 8 2014; CHEP 2015). For people with past stroke CHEP 2015 recommends initiating treatment with an ACEI/thiazide‐type diuretic combination.
Some advantages of initial combination treatment have been proposed: two drugs can be given at low doses so reducing the risk of adverse effects. Combination therapy provides more rapid control of blood pressure than monotherapy. Adherence may be improved, and subsequently blood pressure control, when the person perceives the treatment is effective and well tolerated (ESH‐ESC 2013).
The disadvantages of initiating treatment with drug combinations are that one of the drugs may be ineffective or unnecessary, thus complicating the treatment (ESH‐ESC 2013), and that a substantial decrease in blood pressure can be poorly tolerated in some people (e.g. older people) (CHEP 2015).
Why it is important to do this review
It is unknown whether the benefits of combination therapy as compared to monotherapy for initial treatment of hypertension exceed the harms.
One meta‐analysis showed that combining drugs from different classes is more effective in lowering blood pressure than increasing the dose of one drug, but it did not provide information about morbidity or adverse effects. The authors recommended considering combination as routine initial therapy (Wald 2009). Although the value of routinely starting treatment with combination therapy, particularly with low doses, has been proposed, this has not been widely accepted. It is not known if beginning with two drugs results in improved cardiovascular outcomes or mortality compared with starting one drug (JNC 8 2014). The recommendation of using combinations when blood pressure is 20/10 mmHg above goal is not based on direct evidence from randomized controlled trials (JNC 8 2014; CHEP 2015).
Combinations of drugs acting on the renin‐angiotensin system were proposed; however, these have been shown to be harmful (ONTARGET 2008; ALTITUDE 2012; Makani 2013).
One observational study, which included 1127 people older than 80 years living in nursing homes, found a significant increase in two‐year mortality (adjusted hazard ratio 1.78, 95% CI 1.34 to 2.37) associated with combinations of antihypertensive drugs in people with systolic blood pressure less than 130 mmHg (PARTAGE 2015).
There is an increasing awareness about the problem of polypharmacy. The single most important predictor of risk of adverse drug events in older people is the number of prescribed drugs, so using the minimum number of drugs is a measure to improve patient safety (Scott 2015).
Objectives
To determine if there are differences in clinical outcomes between initial therapy with monotherapy or combination therapy for primary hypertension.
Methods
Criteria for considering studies for this review
Types of studies
Randomized double‐blind controlled trials of at least one year of duration and containing 50 or more participants per group. The trials must have reported data for at least one of the primary outcomes. We excluded trials using non‐randomized allocation methods such as alternate allocation, week of presentation or retrospective controls.
Types of participants
We included participants aged at least 18 years who's blood pressure was measured using a validated technique.
Trials were limited to those where participants had a baseline resting systolic blood pressure of at least 140 mmHg or a diastolic blood pressure of at least 90 mmHg (130/80 mmHg or greater in people with diabetes). We included the study if 70% or more of the participants met the above definitions, or individual participant data were available, or data of relevant participants were provided separately allowing specific inclusion of this population.
We excluded people with confirmed secondary hypertension.
Trials were not limited by any other factor or baseline risk.
Types of interventions
Intervention: combination therapy (i.e. participants treated initially with two antihypertensive drugs).
Control: monotherapy (i.e. participants treated initially with one antihypertensive drug).
Treatment should have been clearly defined as a specific class of first‐line antihypertensive therapy in one of the following classes: thiazide type diuretics, loop diuretics, beta‐blockers, CCBs, ACEIs, ARBs, renin inhibitors or α‐adrenergic blockers (ATC codes: C03, C07, C08, C09, C02CA, C02LE). We excluded drug classes that have not been confirmed to lower blood pressure as monotherapy (e.g. potassium‐sparing diuretics triamterene and amiloride (Heran 2012)). If a trial used combination of diuretics with those agents, we planned to analyze it separately.
Initial therapy is defined as the first‐time participants were treated with antihypertensive drugs.
Both groups under study should have had the same blood pressure target, if any defined.
Drugs and doses were acceptable when the doses were within the manufacturer recommended dose range for hypertension.
Types of outcome measures
Primary outcomes
-
Total mortality.
-
Total serious adverse events, defined according to the International Conference on Harmonisation Guidelines (ICH 1995), as any event that leads to death, that was life‐threatening, required hospitalization or prolongation of existing hospitalization, resulted in persistent or significant disability, or was a congenital anomaly/birth defect.
-
Total cardiovascular events including total myocardial infarction, stroke, sudden death, hospitalization or death from congestive heart failure, and other significant vascular events such as ruptured aneurysms (did not include angina, transient ischaemic attacks, surgical or other procedures, or accelerated hypertension).
-
Cardiovascular mortality.
If a study used a different definition for serious adverse events, the review authors decided on inclusion of data by consensus; if needed we consulted another review author.
All primary outcomes were important outcomes to be included in the 'Summary of findings' table.
Secondary outcomes
-
Withdrawals due to drug‐related adverse effects (important outcome).
-
Reaching blood pressure control, as defined in each trial.
-
Systolic and diastolic blood pressure change from baseline.
Search methods for identification of studies
We searched the Cochrane Library, Ovid MEDLINE and Ovid Embase for related reviews.
We searched the following databases for primary studies:
-
Hypertension Group Specialised Register (1946 to February 2016) (Appendix 1);
-
the Cochrane Central Register of Controlled Trials (CENTRAL) (2016, Issue 2) (Appendix 2);
-
Ovid MEDLINE (2005 to February 2016) (Appendix 3)*;
-
Ovid Embase (2010 to February 2016) (Appendix 4)*;
-
LILACS (1982 to March 2016);
-
trial registries (ClinicalTrials.gov, Current Controlled Trials and the World Health Organization International Clinical Trials Registry Platform (WHO ICTRP)).
*MEDLINE and Embase results were limited to recent years as the US Cochrane Center searched MEDLINE prior to 2005, the UK Cochrane Centre searched Embase prior to 2010, and the Cochrane Hypertension Specialised Register includes randomized trials from weekly searches of MEDLINE and Embase.
The Specialised Register also includes randomized trials from searches of Agricola, AMED, BIOSIS, CAB Abstracts, CINAHL, Food Science & Technology Abstracts, International Pharmaceutical Abstracts, LILACS, ProQuest Dissertations & Theses, PsycINFO, Scirus, Scopus and Web of Science.
Electronic searches
We searched electronic databases using a strategy combining the Cochrane Highly Sensitive Search Strategy for identifying randomized trials in MEDLINE: sensitivity‐ and precision‐maximizing version (2008 revision) with selected MeSH terms and free‐text terms relating to hypertension. We translated the MEDLINE search strategy (Appendix 3) into the Cochrane Hypertension Specialised Register (Appendix 1), CENTRAL (Appendix 2) and Embase (Appendix 4) using the appropriate controlled vocabulary as applicable.
Searching other resources
We contacted relevant pharmaceutical companies and searched in their clinical studies repositories (Appendix 6).
We searched on web pages of the US Food and Drug Administration (FDA) (www.fda.gov) and the European Medicines Agency (EMA) (www.ema.europa.eu) for published and unpublished clinical trial data relevant to the review. We only considered FDA and EMA reports of authorized combination drugs. We looked in the Scientific Discussion of the European Public Assessment Reports and in the FDA's Medical Reviews.
We searched in TRIP Database (www.tripdatabase.com) for systematic reviews, guidelines and health technology assessment reports.
We searched for additional trials by checking the reference lists of included trials and reviews, guidelines and health technology assessment reports (Appendix 7).
Dealing with duplicate publications
When we identified more than one publication of an original trial, we assessed those articles together to maximize data collection.
References from published studies
We examined the references of the included and excluded studies for further potentially eligible randomized controlled trials.
Language
We applied no language restrictions.
Correspondence
We contacted with trial investigators to ask for data of subgroup participants without previous antihypertensive treatment, for missing data or to clarify study details.
Data collection and analysis
Two review authors independently reviewed the search results. One review author (LCS) checked all results. We used EROS software for screening and classifying references.
Selection of studies
In an initial phase, we excluded a record if the title or the abstract showed that was not a randomized double‐blind controlled trial, participants were not naive to antihypertensive treatment, there were fewer than 50 participants per group, follow‐up was less than 12 months, trial did not compare monotherapy with a combination therapy of the included classes, targets of blood pressure were different between groups or antihypertensive doses were not in the recommended range. We obtained the remaining articles in full text and excluded them if they did not meet the inclusion criteria. If a study could have included a subgroup of participants that met our criteria (more than 50 people with hypertension without previous antihypertensive drugs per group), we provisionally included it and we contacted authors for data of the subgroup.
Two authors independently reviewed the selected articles. We resolved disagreements by discussion and involved all authors if necessary.
Data extraction and management
Two authors independently extracted data from selected trials using a standard data extraction form including study design, randomization, allocation concealment, blinding, drugs, doses, duration of treatment, baseline characteristics, losses to follow‐up, outcomes, analysis and reporting. We resolved differences between authors by discussion and involved all authors if necessary.
We used Microsoft Access and Microsoft Excel for dealing with individual participant data.
We use Review Manager 5 software for data synthesis and analyses (RevMan 2014). Quantitative analyses of outcomes were based on the intention‐to‐treat principle.
We considered all publications of the trials, including protocols and FDA and EMA authorized drug reports.
Assessment of risk of bias in included studies
Two authors independently assessed the risk of bias in each trial with the Cochrane 'risk of bias' tool (Higgins 2011). We resolved any differences in opinion by discussion and, if necessary with the participation of a third author.
We reported the overall risk of bias of each of the included studies according to the following:
-
low risk of bias (plausible bias unlikely to seriously alter the results) if all criteria were met;
-
unclear risk of bias (plausible bias that raised some doubt about the results) if one or more criteria were assessed as unclear;
-
high risk of bias (plausible bias that seriously weakens confidence in the results) if one or more criteria were not met.
We planned to perform sensitivity analyses excluding trials with high or high and unclear risk of bias.
Measures of treatment effect
We based quantitative analyses of outcomes on intention‐to‐treat results.
We statistically summarized data on dichotomous outcomes as risk ratios (RR) with 95% confidence intervals (CI). We planned to calculate the risk difference (RD) and number needed to treat for an additional beneficial outcome.
We summarized continuous outcomes as mean differences (MD) with 95% CI.
We combined data for change in blood pressure using mean differences.
Unit of analysis issues
The unit of analysis was the individual participants.
Dealing with missing data
We contacted the investigators in case of missing data. We based the quantitative analyses of outcomes on intention‐to‐treat results.
Assessment of heterogeneity
We planned to examine heterogeneity with standard Chi2 test, and the I2 statistic.
Values of the I2 statistic were graded as (Higgins 2011):
-
0% to 40%: heterogeneity might not be important;
-
30% to 60%: moderate heterogeneity;
-
50% to 90%: substantial heterogeneity;
-
75% to 100% considerable heterogeneity.
If data exhibited more than moderate heterogeneity (I2 greater than 60%), we planned to investigate possible causes. If we had not been able to address heterogeneity causes, we would not have performed the meta‐analysis.
Assessment of reporting biases
We planned to assess reporting bias following the recommendations on testing for funnel plot asymmetry as described in the Cochrane Handbook for Systematic Reviews of Interventions (Higgins 2011).
Data synthesis
Two authors analyzed the data in Review Manager 5 (RevMan 2014), and reported them in accordance with the Cochrane Handbook for Systematic Reviews of Interventions (Higgins 2011).
We planned to use a fixed‐effect model to pool the data into a meta‐analysis. In the presence of statistical heterogeneity (greater than 30% or P < 0.05 as estimated by the I2 statistic), we used a random‐effects model.
If meta‐analysis had not been appropriated, we would have provided a narrative describing the results.
Subgroup analysis and investigation of heterogeneity
We planned the following subgroup analyses:
-
people aged less than 75 years versus people aged 75 years or over;
-
men versus women;
-
people with diabetes versus people without diabetes.
Sensitivity analysis
We planned to perform sensitivity analyses to assess the robustness of the results.
-
According to baseline blood pressure levels:
-
less than 160 mmHg;
-
160 mmHg and over to less than 180 mmHg;
-
180 mmHg and over.
-
-
Pharmaceutical sponsored versus independent trials. We considered a trial as pharmaceutical sponsored if this was noted in the publication, if any of the authors worked for a pharmaceutical company, or if the trial was sent to FDA or EMA for drug authorization.
-
Excluding trials with high or high and unclear risk of bias.
Results
Description of studies
See: Characteristics of included studies; Characteristics of excluded studies; Characteristics of studies awaiting classification tables.
Results of the search
Database searches identified 13,173 records with 48 records from additional sources. After removing duplicates, 7910 records remained. We screened the titles and abstracts and excluded 7682 records. We obtained the full‐text articles of 228 records and assessed them for eligibility. We excluded 186 full‐text articles. We provisionally accepted 12 studies (reported in 42 articles) for inclusion while we contacted authors for subgroup data. We subsequently included three studies, excluded four studies and listed five studies as awaiting classification. See Figure 1 for the flow chart of the bibliographic search.

Study flow diagram.
We sought help for checking inclusion criteria in two full‐text articles written in Chinese and in Russian.
We checked 100 clinical studies included in the FDA's Medical Reviews of 24 fixed‐combination drugs, and 70 clinical studies included in the EMA's scientific discussion of the Public Assessment Reports of seven fixed‐combination drugs. None of them meet our inclusion criteria, mostly because the follow‐up was less than one year. We did not look whether studies included in FDA or EMA reviews also were in the bibliographic search.
Included studies
The three included studies involved 1867 participants with active treatment (monotherapy: 1077 participants; combination: 790 participants). None of the studies was limited to people who initiated antihypertensive treatment so we asked investigators for this subgroup that comprised 568 participants, 30% of the total (monotherapy: 335 participants; combination: 233 participants). PREMIER 2003 and BENEDICT‐A 2004 included only people with type 2 diabetes. PREMIER 2003 included only people with albuminuria whereas BENEDICT‐A 2004 excluded people with albuminuria. REASON 2001 excluded people treated with antidiabetes, hypocholesterolaemia or cardiovascular drugs. The characteristics of participants included in our review are showed in Table 1. Follow‐up was 12 months in PREMIER 2003 and REASON 2001, and was 36 months in BENEDICT‐A 2004. The therapeutic groups compared were: ACEI/thiazide‐type diuretic versus ACEI (PREMIER 2003); ACEI/thiazide‐type diuretic versus beta‐blocker (REASON 2001), and ACEI or CCB (non‐dihydropyridine) versus ACEI/CCB (non‐dihydropyridine) (BENEDICT‐A 2004). The three trials were industry funded.
| Characteristic | Treatment | Mean (standard deviation) | ||
| Number of participants | Combination | 115 | 55 | 63 |
| Monotherapy | 215 | 54 | 66 | |
| Total participants included in the trial (%) | Combination | 38.08% | 22.78% | 28.09% |
| Monotherapy | 35.54% | 22.54% | 25.82% | |
| Age (years) | Combination | 60.98 (7.62) | 57.27 (8.53) | 52.49 (12.68) |
| Monotherapy | 60.62 (8.36) | 59.93 (8.75) | 50.38 (10.57) | |
| Sex (% men) | Combination | 67.83% | 74.55% | 71.43% |
| Monotherapy | 69.30% | 77.78% | 62.12% | |
| Ethnicity (% white people) | Combination | 100.00% | 96.36% | 98.41% |
| Monotherapy | 100.00% | 88.89% | 93.94% | |
| Body mass index (kg/m2) | Combination | 28.68 (5.19) | 28.23 (3.18) | 26.85 (3.11) |
| Monotherapy | 28.34 (4.42) | 29.22 (3.51) | 26.99 (2.38) | |
| Systolic blood pressure (mm Hg) | Combination | 151.61 (9.70) | 154.56 (9.86) | 162.56 (11.24) |
| Monotherapy | 152.11 (11.57) | 154.04 (11.67) | 158.74 (12.84) | |
| Diastolic blood pressure (mm Hg) | Combination | 88.72 (7.17) | 90.98 (8.43) | 97.65 (6.89) |
| Monotherapy | 89.54 (6.32) | 91.00 (8.26) | 98.94 (5.07) | |
Excluded studies
As our objective was the first‐line therapy of hypertension we discarded numerous studies that compared monotherapy with combination in the case of failure of monotherapy.
One large study included only people who were not taking antihypertensive drugs. MRC‐O 1992 was conducted in general practices in the UK. Participants aged 65 to 74 years, with systolic blood pressure of 160 mmHg to 209 mmHg and diastolic blood pressure less than 115 mmHg, were randomized to atenolol 50 mg daily (1102 participants) or hydrochlorothiazide 25 mg daily to 50 mg daily plus amiloride 2.5 mg daily to 5 mg daily (1081 participants). The regimens were adjusted to achieve target systolic blood pressures of 150 mmHg or less or 160 mmHg or less depending on baseline blood pressure. Mean follow‐up was 5.8 years. The participants in the combination therapy group had fewer cardiovascular deaths and fewer cardiovascular events. There were no statistically significant differences in total mortality (Wiysonge 2012). We excluded this trial because doctors and nurses were not blinded to treatment.
PICXEL 2005 included 556 participants with hypertension and left ventricular hypertrophy who were randomized to receive perindopril 2 mg plus indapamide 0.625 mg or enalapril 10 mg. Doses were increased depending on the response. Follow‐up was 12 months. We sought data from participants without prior antihypertensive treatment from the study authors. However, we excluded this trial as there were fewer than 50 participants per group (perindopril/indapamide: 40 participants, enalapril: 46 participants).
DEMAND 2011 included 380 participants aged 40 years or over with hypertension and known history of type 2 diabetes mellitus for less than 25 years, with urinary albumin excretion of less than 200 μg/minute and serum creatinine of 1.5 mg/dL or less. Participants were randomized to manidipine 10 mg daily plus delapril 30 mg daily, delapril 30 mg daily or placebo. Target blood pressure was 120/80 mmHg. Additional antihypertensive drugs were allowed to achieve target blood pressure. The mean follow‐up was 47 months. The study authors provided individual participant data. However, there were fewer than 50 participants without prior antihypertensive treatment per group (delapril/manidipine: 38 participants, delapril: 33 participants).
BENEDICT‐B 2011 included 281 participants aged 40 years or over with hypertension (defined as an untreated systolic blood pressure of 130 mmHg or greater or a diastolic blood pressure of 85 mmHg or greater), history of type 2 diabetes mellitus not exceeding 25 years, urinary albumin excretion rate 20 μg/minute or greater and less than 200 μg/minute, and serum creatinine concentration 1.5 mg/dL or less. Two categories of participants entered the study: people who had developed microalbuminuria during the BENEDICT‐A 2004 study and people included after a new screening. Participants were randomized to trandolapril 2 mg daily or trandolapril 2 mg daily plus verapamil 180 mg daily. The target blood pressure was 120/80 mmHg. Additional antihypertensive drugs were allowed to achieve the target blood pressure. Median follow‐up was 4.5 years. The authors provided individual participant data. However, there were fewer than 50 participants without prior antihypertensive treatment per group (trandolapril: 39 participants, trandolapril/verapamil: 40 participants).
ONTARGET 2008 included 25,620 participants with coronary, peripheral or cerebrovascular disease or diabetes with end‐organ damage. Hypertension was not required for inclusion. Participants were randomized to ramipril 10 mg, telmisartan 80 mg or ramipril 10 mg plus telmisartan 80 mg. We excluded this trial because there was a three‐week run‐in period in which participants received ramipril plus telmisartan, so participants were not naive to antihypertensive treatment at randomization.
Zhang 2010 included 124 participants, 112 without history of using any antihypertensive medication, who were randomized to fosinopril/indapamide or fosinopril alone. The follow‐up was 14 months. We excluded this trial because it was not stated as double blind and it did not provide any of the primary outcomes.
ACCELERATE 2011 enrolled 1254 participants, of whom 521 were treatment‐naive, and were randomized to aliskiren 150 mg (a direct renin inhibitor), amlodipine 5 mg or aliskiren 150 mg plus amlodipine 5 mg. We excluded this trial because follow‐up was only 32 weeks.
Risk of bias in included studies
The assessment of risk of bias is based on both published and unpublished data. Study authors provided clarification of methods of PREMIER 2003 and REASON 2001 and the protocol of BENEDICT‐A 2004. Figure 2 shows the 'Risk of bias' summary of included studies.
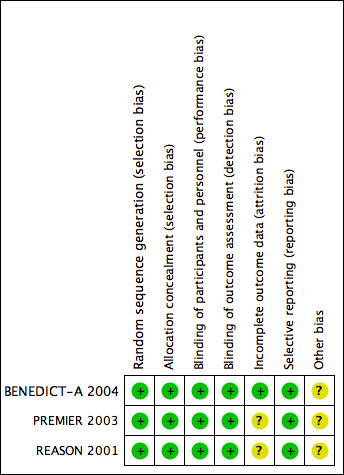
Risk of bias summary: review authors' judgements about each risk of bias item for each included study.
Allocation
All three included studies used a computer‐generated randomization list. The allocation was performed centrally and study centres received blinded treatments and randomization numbers. We judged the risk of allocation bias to be low for all included studies.
Blinding
All three included studies were double‐blind, and stated that capsules of identical appearance were used. REASON 2001 and BENEDICT‐A 2004 stated that evaluators were blinded to treatment. We judge the risk of performance and detection bias to be low in all studies.
Incomplete outcome data
In REASON 2001, there were 21 withdrawals for which reasons were not provided. In PREMIER 2003, there were more withdrawals due to lack of efficacy in the monotherapy group (six with monotherapy versus zero with monotherapy). It is unclear if those circumstances can lead to differences in endpoints.
Selective reporting
We sent our protocol to investigators asking for outcomes of interest for this review in the subgroup of participants naive to antihypertensive drugs. Study authors provided data as aggregate data for REASON 2001 and PREMIER 2003; and as individual participant data for BENEDICT‐A 2004; so we judged selective reporting bias to be low.
Other potential sources of bias
In BENEDICT‐A 2004, inclusion criteria were changed during the trial (from untreated blood pressure 140/90 mmHg or greater to 130/85 mmHg or greater. Blood pressure targets were also changed during the trial from 130/85 mmHg to 120/80 mmHg (protocol amendment 3; 27 May 1999).
All data came from subgroups of participants not predefined in the original studies. Outcomes of our review were not the primary outcome in any included trial.
Effects of interventions
The number of participants included in our review and hence the number of events was clearly insufficient for reach any conclusion about the differential effect of initiating treatment with combination therapy versus monotherapy on important outcomes.
At the end of one year, there were no statistically significant differences in change of blood pressure between having started with monotherapy or with combination therapy. However, CIs included differences larger than 5 mmHg for systolic blood pressure.
The large heterogeneity precluded aggregating results of 'Reaching target blood pressure'. Separating in subgroups by blood pressure target did not address it. Differences in how trials were conducted can provide some explanation. In REASON 2001, the dose was doubled after three months if blood pressure remained above 160/90 mmHg, whereas in PREMIER 2003, the dose was doubled after three months if blood pressure remained above 140/90 mmHg. Despite this, in data provided by investigators, target blood pressure was defined as less than 140/90 mmHg in both trials. Another factor may be that REASON 2001 used atenolol as monotherapy but it was not included in the combination therapy.
Only BENEDICT‐A 2004 provided data for separate results in men and women. The scarcity of events for mortality, cardiovascular mortality, cardiovascular events and reaching blood pressure target precluded subgroup analysis for these outcomes. There was no indication of a differential effect in serious adverse events, withdrawals due to adverse effects or changes in blood pressure at one year. However, there were too few women to make any conclusions. BENEDICT‐A 2004 also provided individual data of the age of participants. But as it only included 17 people aged 75 years or older, there were not enough data to provide results of this subgroup.
Discussion
Summary of main results
The number of participants and hence the number of events were too small to draw any conclusions.
Overall completeness and applicability of evidence
Despite the huge number of clinical trials with antihypertensive drug combinations, our search was almost fruitless. The reasons for excluding studies merit consideration.
-
No naive participants: clinical trials are not addressing questions that doctors face in every‐day practice. The inclusion of participants with and without previous antihypertensive treatment facilitates recruitment but it impairs the interpretation and applicability of results. Clinical practice guidelines address the question but recommendations are based, at best, on indirect evidence.
-
Follow‐up less than 12 months: there are numerous trials of short duration (eight to 12 weeks) that mostly respond to regulatory requirements for pharmaceutical companies. Those follow‐ups are not enough for having results of hard clinical outcomes in a chronic condition like hypertension.
The dangers of relying only on theoretical or pharmacological considerations are well illustrated with the case of combinations of drugs targeting the renin‐angiotensin system. Some authors have recommended them because they act at different levels of the physiological pathway and could have synergic actions. However, when those combinations were compared with monotherapy in large clinical trials with hard endpoints, the results were more adverse effects (including hypotension, hyperkalaemia and renal failure), with no benefits in people without heart failure, despite greater reductions in blood pressure (ONTARGET 2008; ALTITUDE 2012; Makani 2013). Those results led regulatory agencies to amend product information to say that combined use of ACEIs, ARBs or aliskiren is not recommended (EMA/294911/2014; FDA 2014).
Quality of the evidence
Although included trials were of fair quality, overall certainty of evidence was very low due to the scarcity of data, and for using a subgroup that was not defined in advance.
Potential biases in the review process
As stated, one potential bias introduced is that we could not use the whole population of the trials but only a subgroup.
We excluded MRC‐O 1992 as it was not double blind. It is arguable that it can provide evidence that may be as uncertain as that from the small subgroups of participant of the included trials. In the discussions for designing the protocol, we decided to limit the inclusion criteria to double‐blind trials because we believed there was a high risk of differential care or co‐interventions if doctors judged that participants were receiving treatments of different intensity.
Agreements and disagreements with other studies or reviews
In one large clinical trial that focused on people who were not taking antihypertensive drugs (MRC‐O 1992), there were better results in terms of cardiovascular morbidity and mortality with a combination therapy than with monotherapy. There were no statistically significant differences in all‐cause mortality. Drugs compared in the trial were hydrochlorothiazide/amiloride versus a beta‐blocker (atenolol) (see Excluded studies). It is unclear if differences could have arisen from the different classes of drugs used. However, one systematic review did not find differences between diuretics and beta‐blockers in those outcomes (Wiysonge 2012), so the utilization of a combination of two diuretics with different mechanisms of action could have influenced the results. We did not include this trial because it was not double blind.
One systematic review included 42 clinical trials of factorial designs with durations ranging between four and 12 weeks (Wald 2009). One review included 354 trials (50 studying combination therapy) (Law 2003a; Law 2003b). The median duration was four weeks (range two to 15 weeks). They did not find any trials of sufficient duration to meet our inclusion criteria. They concluded that combination therapy is the preferred initial strategy in the treatment of hypertension, but this statement was not based on results of hard clinical endpoints with combination therapy but on indirect evidence. They based their conclusions on the larger reduction of blood pressure obtained with combination therapy. However, we found no differences in blood pressure reductions attained after one year.
The JNC 8 2014 guideline supports both strategies: start with monotherapy, and begin with two drugs either as separate tablets or as a single tablet combination. The evidence review found no randomized controlled trials that compared monotherapy versus combination therapy and assessed important health outcomes. The guideline acknowledges that it is unknown if one of the strategies results in improved cardiovascular outcomes, cerebrovascular outcomes, kidney outcomes or mortality compared with the alternative strategy. Our review confirms the lack of evidence about this question. In addition, the possibility of increasing cost without evidence of benefit has to be considered, especially in low‐income environments.

Study flow diagram.

Risk of bias summary: review authors' judgements about each risk of bias item for each included study.
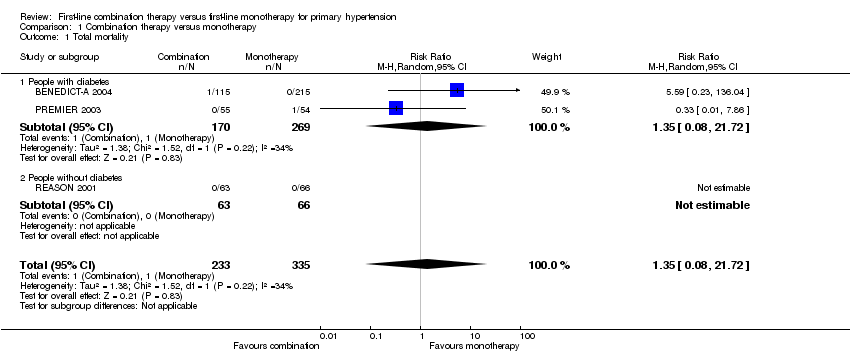
Comparison 1 Combination therapy versus monotherapy, Outcome 1 Total mortality.
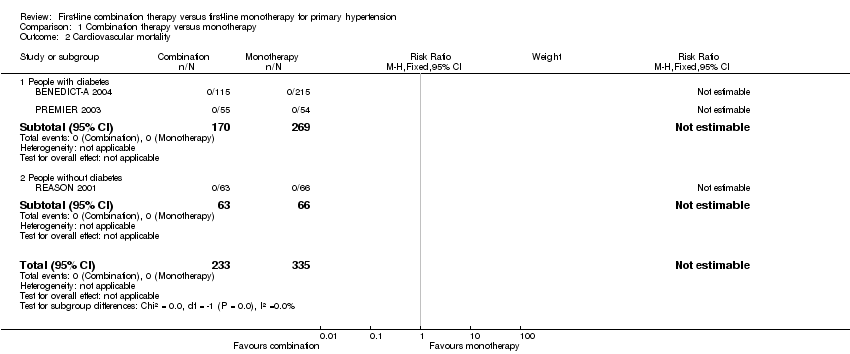
Comparison 1 Combination therapy versus monotherapy, Outcome 2 Cardiovascular mortality.

Comparison 1 Combination therapy versus monotherapy, Outcome 3 Cardiovascular events.
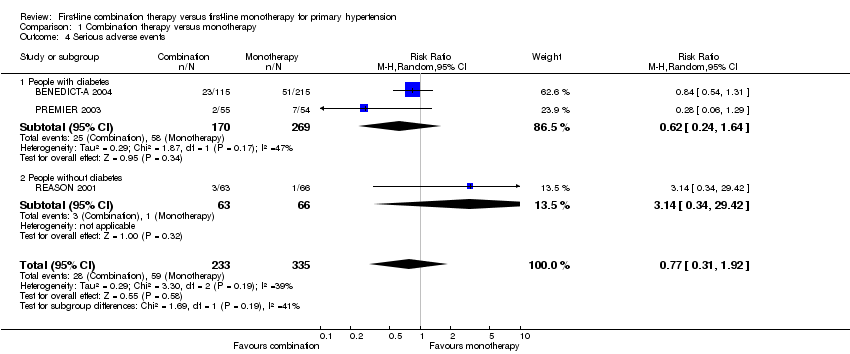
Comparison 1 Combination therapy versus monotherapy, Outcome 4 Serious adverse events.
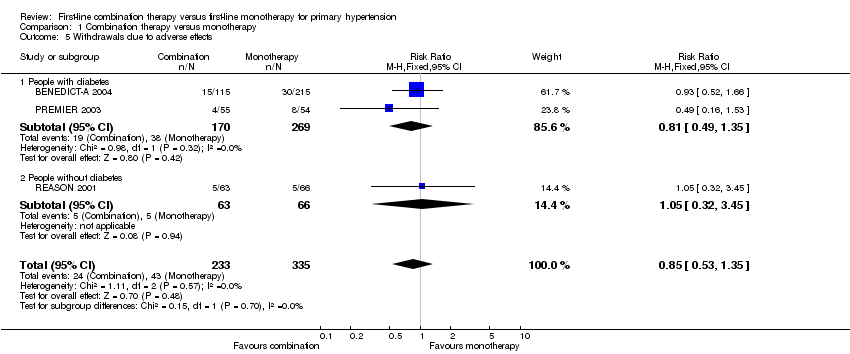
Comparison 1 Combination therapy versus monotherapy, Outcome 5 Withdrawals due to adverse effects.

Comparison 1 Combination therapy versus monotherapy, Outcome 6 Reaching target blood pressure at 1 year.

Comparison 1 Combination therapy versus monotherapy, Outcome 7 Systolic blood pressure change from baseline at end of 1 year.
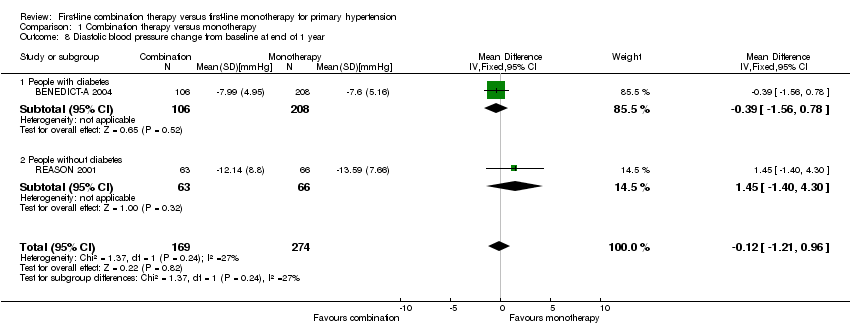
Comparison 1 Combination therapy versus monotherapy, Outcome 8 Diastolic blood pressure change from baseline at end of 1 year.

Comparison 2 Combination therapy versus monotherapy (men versus women), Outcome 1 Serious adverse events.

Comparison 2 Combination therapy versus monotherapy (men versus women), Outcome 2 Withdrawals due to adverse effects.
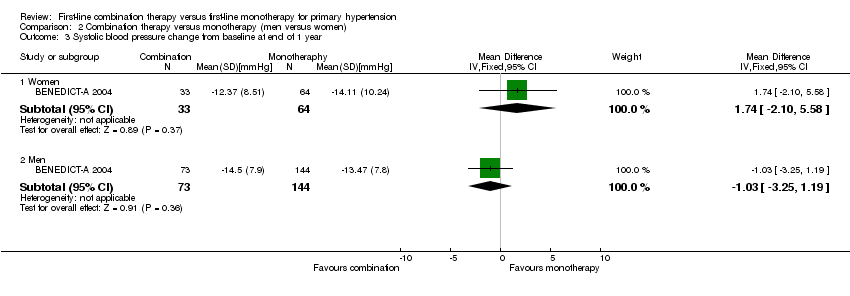
Comparison 2 Combination therapy versus monotherapy (men versus women), Outcome 3 Systolic blood pressure change from baseline at end of 1 year.

Comparison 2 Combination therapy versus monotherapy (men versus women), Outcome 4 Diastolic blood pressure change from baseline at end of 1 year.
| Combination therapy versus monotherapy for primary hypertension | ||||||
| Patient or population: people with primary hypertension | ||||||
| Outcomes | Illustrative comparative risks* (95% CI) | Relative effect | No of participants | Certainty of the evidence | Comments | |
| Assumed risk | Corresponding risk | |||||
| Monotherapy | Combination therapy | |||||
| Total mortality | 3 per 1000 | 4 per 1000 | RR 1.35 | 568 | ⊕⊝⊝⊝ | ‐ |
| Cardiovascular mortality | See footnote4 | See footnote4 | Not estimable | 568 | ⊕⊝⊝⊝ | ‐ |
| Cardiovascular events | 9 per 1000 | 9 per 1000 | RR 0.98 | 568 | ⊕⊝⊝⊝ | ‐ |
| Serious adverse events | 176 per 1000 | 136 per 1000 | RR 0.77 | 568 | ⊕⊝⊝⊝ | ‐ |
| Withdrawals due to adverse effects | 128 per 1000 | 109 per 1000 | RR 0.85 | 568 | ⊕⊝⊝⊝ | ‐ |
| *The basis for the assumed is the mean monotherapy group risk across studies. The corresponding risk (and its 95% confidence interval) is based on the assumed risk in the combination group and the relative effect of the intervention (and its 95% CI). | ||||||
| GRADE Working Group grades of evidence | ||||||
| 1 All data come from subgroups of participants not predefined in the original studies. Outcomes of our review were not the primary outcome in any included trial. | ||||||
| Characteristic | Treatment | Mean (standard deviation) | ||
| Number of participants | Combination | 115 | 55 | 63 |
| Monotherapy | 215 | 54 | 66 | |
| Total participants included in the trial (%) | Combination | 38.08% | 22.78% | 28.09% |
| Monotherapy | 35.54% | 22.54% | 25.82% | |
| Age (years) | Combination | 60.98 (7.62) | 57.27 (8.53) | 52.49 (12.68) |
| Monotherapy | 60.62 (8.36) | 59.93 (8.75) | 50.38 (10.57) | |
| Sex (% men) | Combination | 67.83% | 74.55% | 71.43% |
| Monotherapy | 69.30% | 77.78% | 62.12% | |
| Ethnicity (% white people) | Combination | 100.00% | 96.36% | 98.41% |
| Monotherapy | 100.00% | 88.89% | 93.94% | |
| Body mass index (kg/m2) | Combination | 28.68 (5.19) | 28.23 (3.18) | 26.85 (3.11) |
| Monotherapy | 28.34 (4.42) | 29.22 (3.51) | 26.99 (2.38) | |
| Systolic blood pressure (mm Hg) | Combination | 151.61 (9.70) | 154.56 (9.86) | 162.56 (11.24) |
| Monotherapy | 152.11 (11.57) | 154.04 (11.67) | 158.74 (12.84) | |
| Diastolic blood pressure (mm Hg) | Combination | 88.72 (7.17) | 90.98 (8.43) | 97.65 (6.89) |
| Monotherapy | 89.54 (6.32) | 91.00 (8.26) | 98.94 (5.07) | |
| Outcome or subgroup title | No. of studies | No. of participants | Statistical method | Effect size |
| 1 Total mortality Show forest plot | 3 | 568 | Risk Ratio (M‐H, Random, 95% CI) | 1.35 [0.08, 21.72] |
| 1.1 People with diabetes | 2 | 439 | Risk Ratio (M‐H, Random, 95% CI) | 1.35 [0.08, 21.72] |
| 1.2 People without diabetes | 1 | 129 | Risk Ratio (M‐H, Random, 95% CI) | 0.0 [0.0, 0.0] |
| 2 Cardiovascular mortality Show forest plot | 3 | 568 | Risk Ratio (M‐H, Fixed, 95% CI) | 0.0 [0.0, 0.0] |
| 2.1 People with diabetes | 2 | 439 | Risk Ratio (M‐H, Fixed, 95% CI) | 0.0 [0.0, 0.0] |
| 2.2 People without diabetes | 1 | 129 | Risk Ratio (M‐H, Fixed, 95% CI) | 0.0 [0.0, 0.0] |
| 3 Cardiovascular events Show forest plot | 3 | 568 | Risk Ratio (M‐H, Fixed, 95% CI) | 0.98 [0.22, 4.41] |
| 3.1 People with diabetes | 2 | 439 | Risk Ratio (M‐H, Fixed, 95% CI) | 0.62 [0.10, 3.95] |
| 3.2 People without diabetes | 1 | 129 | Risk Ratio (M‐H, Fixed, 95% CI) | 3.14 [0.13, 75.69] |
| 4 Serious adverse events Show forest plot | 3 | 568 | Risk Ratio (M‐H, Random, 95% CI) | 0.77 [0.31, 1.92] |
| 4.1 People with diabetes | 2 | 439 | Risk Ratio (M‐H, Random, 95% CI) | 0.62 [0.24, 1.64] |
| 4.2 People without diabetes | 1 | 129 | Risk Ratio (M‐H, Random, 95% CI) | 3.14 [0.34, 29.42] |
| 5 Withdrawals due to adverse effects Show forest plot | 3 | 568 | Risk Ratio (M‐H, Fixed, 95% CI) | 0.85 [0.53, 1.35] |
| 5.1 People with diabetes | 2 | 439 | Risk Ratio (M‐H, Fixed, 95% CI) | 0.81 [0.49, 1.35] |
| 5.2 People without diabetes | 1 | 129 | Risk Ratio (M‐H, Fixed, 95% CI) | 1.05 [0.32, 3.45] |
| 6 Reaching target blood pressure at 1 year Show forest plot | 3 | 548 | Risk Ratio (M‐H, Random, 95% CI) | 1.15 [0.52, 2.54] |
| 6.1 People with diabetes, target ≤ 120/80 mmHg | 1 | 314 | Risk Ratio (M‐H, Random, 95% CI) | 0.18 [0.01, 3.18] |
| 6.2 People with diabetes, target ≤ 140/90 mmHg | 1 | 105 | Risk Ratio (M‐H, Random, 95% CI) | 2.0 [1.24, 3.22] |
| 6.3 People without diabetes, target ≤ 140/90 mmHg | 1 | 129 | Risk Ratio (M‐H, Random, 95% CI) | 0.89 [0.62, 1.28] |
| 7 Systolic blood pressure change from baseline at end of 1 year Show forest plot | 3 | 548 | Mean Difference (IV, Random, 95% CI) | ‐2.06 [‐5.39, 1.27] |
| 7.1 People with diabetes | 2 | 419 | Mean Difference (IV, Random, 95% CI) | ‐2.54 [‐8.27, 3.19] |
| 7.2 People without diabetes | 1 | 129 | Mean Difference (IV, Random, 95% CI) | ‐2.33 [‐7.28, 2.62] |
| 8 Diastolic blood pressure change from baseline at end of 1 year Show forest plot | 2 | 443 | Mean Difference (IV, Fixed, 95% CI) | ‐0.12 [‐1.21, 0.96] |
| 8.1 People with diabetes | 1 | 314 | Mean Difference (IV, Fixed, 95% CI) | ‐0.39 [‐1.56, 0.78] |
| 8.2 People without diabetes | 1 | 129 | Mean Difference (IV, Fixed, 95% CI) | 1.45 [‐1.40, 4.30] |
| Outcome or subgroup title | No. of studies | No. of participants | Statistical method | Effect size |
| 1 Serious adverse events Show forest plot | 1 | Risk Ratio (M‐H, Fixed, 95% CI) | Subtotals only | |
| 1.1 Women | 1 | 103 | Risk Ratio (M‐H, Fixed, 95% CI) | 1.25 [0.52, 3.00] |
| 1.2 Men | 1 | 227 | Risk Ratio (M‐H, Fixed, 95% CI) | 0.75 [0.45, 1.24] |
| 2 Withdrawals due to adverse effects Show forest plot | 1 | Risk Ratio (M‐H, Fixed, 95% CI) | Subtotals only | |
| 2.1 Women | 1 | 103 | Risk Ratio (M‐H, Fixed, 95% CI) | 1.27 [0.43, 3.73] |
| 2.2 Men | 1 | 227 | Risk Ratio (M‐H, Fixed, 95% CI) | 0.83 [0.42, 1.66] |
| 3 Systolic blood pressure change from baseline at end of 1 year Show forest plot | 1 | Mean Difference (IV, Fixed, 95% CI) | Subtotals only | |
| 3.1 Women | 1 | 97 | Mean Difference (IV, Fixed, 95% CI) | 1.74 [‐2.10, 5.58] |
| 3.2 Men | 1 | 217 | Mean Difference (IV, Fixed, 95% CI) | ‐1.03 [‐3.25, 1.19] |
| 4 Diastolic blood pressure change from baseline at end of 1 year Show forest plot | 1 | Mean Difference (IV, Fixed, 95% CI) | Subtotals only | |
| 4.1 Women | 1 | 97 | Mean Difference (IV, Fixed, 95% CI) | 0.47 [‐1.96, 2.90] |
| 4.2 Men | 1 | 217 | Mean Difference (IV, Fixed, 95% CI) | ‐0.77 [‐2.08, 0.54] |