Scolaris Content Display Scolaris Content Display

Results of the search.
Figuras y tablas -
Figure 1

Results of the search.

Risk of bias summary: review authors' judgements about each risk of bias item for each included study.
Figuras y tablas -
Figure 2

Risk of bias summary: review authors' judgements about each risk of bias item for each included study.

Forest plot of comparison: 1 Lower versus standard, outcome: 1.1 Total mortality.
Figuras y tablas -
Figure 3

Forest plot of comparison: 1 Lower versus standard, outcome: 1.1 Total mortality.

Forest plot of comparison: 1 Lower versus standard, outcome: 1.2 Serious adverse events.
Figuras y tablas -
Figure 4

Forest plot of comparison: 1 Lower versus standard, outcome: 1.2 Serious adverse events.

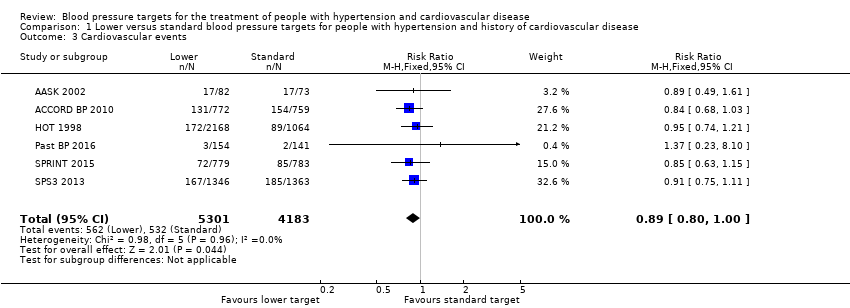
Forest plot of comparison: 1 Lower versus standard, outcome: 1.3 Cardiovascular events.
Figuras y tablas -
Figure 5

Forest plot of comparison: 1 Lower versus standard, outcome: 1.3 Cardiovascular events.

Forest plot of comparison: 1 Lower versus standard, outcome: 1.4 Cardiovascular mortality.
Figuras y tablas -
Figure 6

Forest plot of comparison: 1 Lower versus standard, outcome: 1.4 Cardiovascular mortality.

Comparison 1 Lower versus standard blood pressure targets for people with hypertension and history of cardiovascular disease, Outcome 1 Total mortality.
Figuras y tablas -
Analysis 1.1

Comparison 1 Lower versus standard blood pressure targets for people with hypertension and history of cardiovascular disease, Outcome 1 Total mortality.

Comparison 1 Lower versus standard blood pressure targets for people with hypertension and history of cardiovascular disease, Outcome 2 Serious adverse events.
Figuras y tablas -
Analysis 1.2

Comparison 1 Lower versus standard blood pressure targets for people with hypertension and history of cardiovascular disease, Outcome 2 Serious adverse events.

Comparison 1 Lower versus standard blood pressure targets for people with hypertension and history of cardiovascular disease, Outcome 3 Cardiovascular events.
Figuras y tablas -
Analysis 1.3

Comparison 1 Lower versus standard blood pressure targets for people with hypertension and history of cardiovascular disease, Outcome 3 Cardiovascular events.

Comparison 1 Lower versus standard blood pressure targets for people with hypertension and history of cardiovascular disease, Outcome 4 Cardiovascular mortality.
Figuras y tablas -
Analysis 1.4

Comparison 1 Lower versus standard blood pressure targets for people with hypertension and history of cardiovascular disease, Outcome 4 Cardiovascular mortality.

Comparison 1 Lower versus standard blood pressure targets for people with hypertension and history of cardiovascular disease, Outcome 5 Withdrawals due to adverse effects.
Figuras y tablas -
Analysis 1.5

Comparison 1 Lower versus standard blood pressure targets for people with hypertension and history of cardiovascular disease, Outcome 5 Withdrawals due to adverse effects.

Comparison 1 Lower versus standard blood pressure targets for people with hypertension and history of cardiovascular disease, Outcome 6 Blood pressure target achieved at 1 year.
Figuras y tablas -
Analysis 1.6

Comparison 1 Lower versus standard blood pressure targets for people with hypertension and history of cardiovascular disease, Outcome 6 Blood pressure target achieved at 1 year.

Comparison 1 Lower versus standard blood pressure targets for people with hypertension and history of cardiovascular disease, Outcome 7 Systolic blood pressure change from baseline at end of 1 year.
Figuras y tablas -
Analysis 1.7

Comparison 1 Lower versus standard blood pressure targets for people with hypertension and history of cardiovascular disease, Outcome 7 Systolic blood pressure change from baseline at end of 1 year.

Comparison 1 Lower versus standard blood pressure targets for people with hypertension and history of cardiovascular disease, Outcome 8 Diastolic blood pressure change from baseline at end of 1 year.
Figuras y tablas -
Analysis 1.8

Comparison 1 Lower versus standard blood pressure targets for people with hypertension and history of cardiovascular disease, Outcome 8 Diastolic blood pressure change from baseline at end of 1 year.

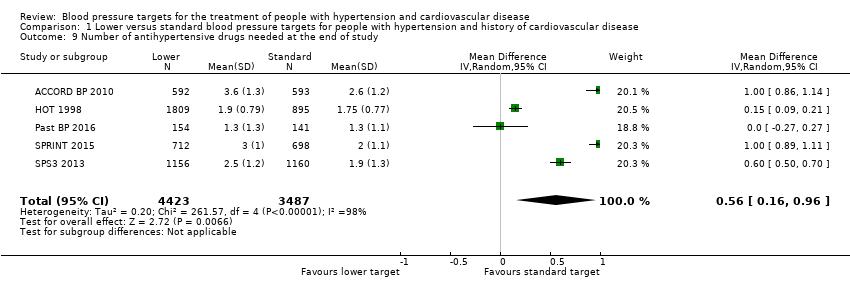
Comparison 1 Lower versus standard blood pressure targets for people with hypertension and history of cardiovascular disease, Outcome 9 Number of antihypertensive drugs needed at the end of study.
Figuras y tablas -
Analysis 1.9

Comparison 1 Lower versus standard blood pressure targets for people with hypertension and history of cardiovascular disease, Outcome 9 Number of antihypertensive drugs needed at the end of study.

Summary of findings for the main comparison. Lower blood pressure targets compared with standard blood pressure targets for mortality and morbidity

Lower blood pressure targets compared with standard blood pressure targets for mortality and morbidity

Patient or population: cardiovascular disease with high blood pressure
Setting: outpatients (average duration of trials 4 years)
Intervention: lower blood pressure targets (≤ 135/85 mmHg)
Comparison: standard blood pressure targets (≤ 140 to 160/90 to 100 mmHg)

Outcomes

Anticipated absolute effects* (95% CI)

Relative effect
(95% CI)

Number of participants
(studies)

Quality of the evidence
(GRADE)

Comments

Risk with standard blood pressure target

Risk with lower blood pressure target

Total mortality

Study population

RR 1.06
(0.91 to 1.23)

9484
(6 RCTs)

⊕⊕⊕⊝
MODERATEa

68 per 1000

72 per 1000
(62 to 84)

Serious adverse events

Study population

RR 1.01
(0.94 to 1.08)

9484
(6 RCTs)

⊕⊕⊝⊝
LOWa,b

252 per 1000

255 per 1000
(237 to 272)

Total cardiovascular events

Study population

RR 0.89
(0.80 to 1.00)

9484
(6 RCTs)

⊕⊕⊝⊝
LOWa,c

127 per 1000

113 per 1000
(102 to 127)

Cardiovascular mortality

Study population

RR 1.03

(0.82 to 1.29)

9484

(6 RCTs)

⊕⊕⊕⊝
MODERATEa

31 per 1000

32 per 1000

(25 to 40)

Withdrawals due to

adverse effects

Study population

RR 8.16
(2.06 to 32.28)

690
(2 RCT)

⊕⊝⊝⊝
VERY LOWa,d

7 per 1000

60 per 1000
(15 to 239)

*The risk in the intervention group (and its 95% confidence interval) is based on the assumed risk in the comparison group and the relative effect of the intervention (and its 95% CI).

CI: confidence interval; RCT: randomized controlled trial; RR: risk ratio.

GRADE Working Group grades of evidence.
High quality: we are very confident that the true effect lies close to that of the estimate of the effect
Moderate quality: we are moderately confident in the effect estimate: the true effect is likely to be close to the estimate of the effect, but there is a possibility that it is substantially different
Low quality: our confidence in the effect estimate is limited: the true effect may be substantially different from the estimate of the effect
Very low quality: we have very little confidence in the effect estimate: the true effect is likely to be substantially different from the estimate of effect

aDowngraded one level owing to serious imprecision (95% CI is wider than the minimal important difference).

bDowngraded one level owing to incomplete available data.

cDowngraded one level owing to high risk of bias.

dDowngraded two levels because only two of the smaller studies reported this outcome.

Figuras y tablas -
Summary of findings for the main comparison. Lower blood pressure targets compared with standard blood pressure targets for mortality and morbidity
Table 1. Baseline characteristics of included study participants

Mean (SD) unless otherwise stated

AASK 2002

ACCORD BP 2010

HOT 1998

Past BP 2016

SPRINT 2015

SPS3 2013

Number of participants

155

1531

3232

295

1562

2709

Sex (% male)

68%

63%

53%

64%

76%

62%

Age in years

57 (9)

62 (8)

62 (‐)

71 (9)

70 (9)

63 (11)

Ethnic group (% Caucasian)

0%

62%

92%

98%

71%

53%

Diabetes

0%

100%

12%

10%

0%

36%

Current smoker

31%

13%

16%

13%

14%

20%

Systolic blood pressure

149 (28)

138 (16)

174 (15)

143 (14)

138 (16)

146 (18)

Diastolic blood pressure

93 (16)

74 (11)

106 (3)

80 (10)

74 (12)

79 (11)

Ischemic heart disease (IHD)

25%

86%

95%

22%

‐‐‐

11%

Stroke

69%

20%

7%

85%

0%

99%

Peripheral vascular disease

23%

‐‐‐

‐‐‐

7%

‐‐‐

‐‐‐

Thiazides

‐‐‐

51%

‐‐‐

35%

‐‐‐

35%

ACEI/ARB

‐‐‐

84%

‐‐‐

65%

‐‐‐

71%

Calcium channel blocker

‐‐‐

26%

‐‐‐

43%

‐‐‐

28%

Beta blocker

‐‐‐

57%

‐‐‐

20%

‐‐‐

27%

Other antihypertensive drugs

‐‐‐

28%

‐‐‐

11%

‐‐‐

8%

Number of antihypertensive drugs

‐‐‐

3.0 (1.4)

1.0 (‐‐)

1.1 (0.8)

2.1 (1.0)

1.7 (1.1)

(‐‐) no information is available. Ischemic heart disease, stroke, and peripheral vascular disease percentages are totally independent of each other because participants can have more than one cardiovascular event at the same time. A similar explanation can be offered with respect to percentages in the different classes of antihypertensive drugs.

Abbreviations: ACEI: angiotensin‐converting enzyme inhibitor; ARB: angiotensin receptor blocker; IHD: ischemic heart disease; SD: standard deviation.

Figuras y tablas -
Table 1. Baseline characteristics of included study participants
Table 2. Lower versus standard blood pressure target; people with diabetes, difference in targets ≥ 10 mmHg

Outcome

Studies

Participants

Statistical Method

Effect Estimate

Total mortality

ACCORD BP 2010, HOT 1998, SPS3 2013

2773

Risk Ratio (M‐H, Fixed, 95% CI)

1.15 [0.91,1.45]

Cardiovascular mortality

ACCORD BP 2010, HOT 1998, SPS3 2013

2773

Risk Ratio (M‐H, Fixed, 95% CI)

0.98 [0.69,1.39]

Cardiovascular events

ACCORD BP 2010, HOT 1998, SPS3 2013

2773

Risk Ratio (M‐H, Fixed, 95% CI)

0.88 [0.74,1.03]

Serious adverse events

ACCORD BP 2010, HOT 1998, SPS3 2013

2773

Risk Ratio (M‐H, Fixed, 95% CI)

1.01 [0.88,1.15]

Figuras y tablas -
Table 2. Lower versus standard blood pressure target; people with diabetes, difference in targets ≥ 10 mmHg
Comparison 1. Lower versus standard blood pressure targets for people with hypertension and history of cardiovascular disease

Outcome or subgroup title

No. of studies

No. of participants

Statistical method

Effect size

1 Total mortality Show forest plot

6

9484

Risk Ratio (M‐H, Fixed, 95% CI)

1.06 [0.91, 1.23]

2 Serious adverse events Show forest plot

6

9484

Risk Ratio (M‐H, Fixed, 95% CI)

1.01 [0.94, 1.08]

2.1 Total serious adverse events

1

1562

Risk Ratio (M‐H, Fixed, 95% CI)

1.00 [0.91, 1.09]

2.2 Subset of total serious adverse events

5

7922

Risk Ratio (M‐H, Fixed, 95% CI)

1.01 [0.92, 1.11]

3 Cardiovascular events Show forest plot

6

9484

Risk Ratio (M‐H, Fixed, 95% CI)

0.89 [0.80, 1.00]

4 Cardiovascular mortality Show forest plot

6

9484

Risk Ratio (M‐H, Fixed, 95% CI)

1.03 [0.82, 1.29]

5 Withdrawals due to adverse effects Show forest plot

2

690

Risk Ratio (M‐H, Fixed, 95% CI)

8.16 [2.06, 32.28]

6 Blood pressure target achieved at 1 year Show forest plot

6

8588

Risk Ratio (M‐H, Fixed, 95% CI)

1.21 [1.17, 1.24]

7 Systolic blood pressure change from baseline at end of 1 year Show forest plot

6

8546

Mean Difference (IV, Random, 95% CI)

‐8.90 [‐13.24, ‐4.56]

8 Diastolic blood pressure change from baseline at end of 1 year Show forest plot

6

8546

Mean Difference (IV, Random, 95% CI)

‐4.50 [‐6.35, ‐2.65]

9 Number of antihypertensive drugs needed at the end of study Show forest plot

5

7910

Mean Difference (IV, Random, 95% CI)

0.56 [0.16, 0.96]

Figuras y tablas -
Comparison 1. Lower versus standard blood pressure targets for people with hypertension and history of cardiovascular disease