Rosuvastatina para la reducción del nivel de lípidos
Información
- DOI:
- https://doi.org/10.1002/14651858.CD010254.pub2Copiar DOI

- Base de datos:
-
- Cochrane Database of Systematic Reviews
- Versión publicada:
-
- 21 noviembre 2014see what's new
- Tipo:
-
- Intervention
- Etapa:
-
- Review
- Grupo Editorial Cochrane:
-
Grupo Cochrane de Hipertensión
- Copyright:
-
- Copyright © 2017 The Cochrane Collaboration. Published by John Wiley & Sons, Ltd.
Cifras del artículo
Altmetric:
Citado por:
Autores
Contributions of authors
*Both JMW and SA contributed to the design of the protocol.
*Both SA and SS extracted the data.
Sources of support
Internal sources
-
University of British Columbia, Canada.
External sources
-
None, Canada.
Declarations of interest
None known.
Acknowledgements
The authors would like to acknowledge the assistance provided by Gavin Wong, Dr Benji Heran, Dr David Godin and Alexandra Laugerotte who assisted with the validation of the data from the included studies.
Version history
| Published | Title | Stage | Authors | Version |
| 2014 Nov 21 | Rosuvastatin for lowering lipids | Review | Stephen P Adams, Sarpreet S Sekhon, James M Wright | |
| 2012 Dec 12 | Lipid lowering efficacy of rosuvastatin | Protocol | Stephen P Adams, James M Wright | |
Differences between protocol and review
A subgroup analysis comparing AstraZeneca‐funded versus non‐AstraZeneca‐funded trials was added to the review.
Keywords
MeSH
Medical Subject Headings (MeSH) Keywords
- Cardiovascular Diseases [blood];
- Cholesterol [blood];
- Cholesterol, HDL [blood];
- Cholesterol, LDL [blood];
- Dose‐Response Relationship, Drug;
- Drug Administration Schedule;
- Fluorobenzenes [*administration & dosage];
- Hydroxymethylglutaryl‐CoA Reductase Inhibitors [*administration & dosage];
- Hyperlipidemias [blood, *drug therapy];
- Lipids [*blood];
- Pyrimidines [*administration & dosage];
- Randomized Controlled Trials as Topic;
- Rosuvastatin Calcium;
- Sulfonamides [*administration & dosage];
- Triglycerides [blood];
Medical Subject Headings Check Words
Humans;
PICO


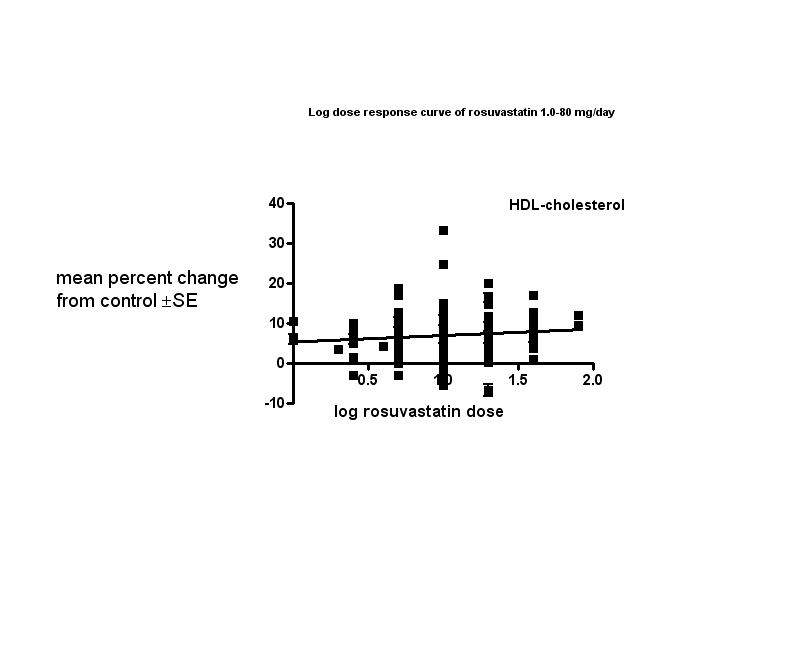
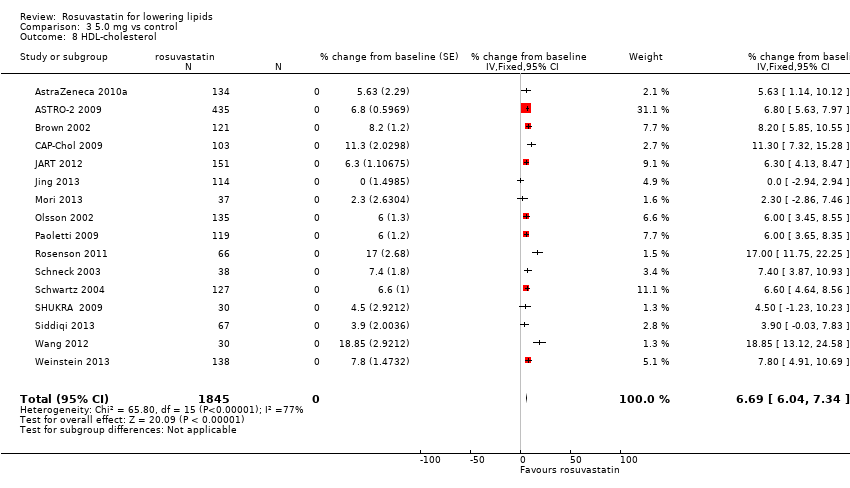
Values represent the results of each trial for each dose comparison.
The standard error bars cannot be seen because they all lie within the points.

Values represent the results of each trial for each dose comparison.
The standard error bars cannot be seen because they all lie within the points.
Values represent the results of each trial for each dose comparison.
The standard error bars cannot be seen because they all lie within the points.

Values represent the results of each trial for each dose comparison.
The standard error bars cannot be seen because they all lie within the points.

Values represent the results of each trial for each dose comparison.
The standard error bars cannot be seen because they all lie within the points.

'Risk of bias' graph: review authors' judgements about each risk of bias item presented as percentages across all included studies.

Comparison 1 1.0 mg vs control, Outcome 1 Total cholesterol.

Comparison 1 1.0 mg vs control, Outcome 2 LDL‐cholesterol.

Comparison 1 1.0 mg vs control, Outcome 3 HDL‐cholesterol.

Comparison 1 1.0 mg vs control, Outcome 4 non‐HDL‐cholesterol.

Comparison 1 1.0 mg vs control, Outcome 5 Triglycerides.
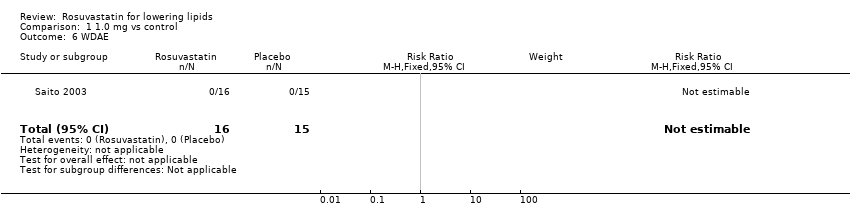
Comparison 1 1.0 mg vs control, Outcome 6 WDAE.
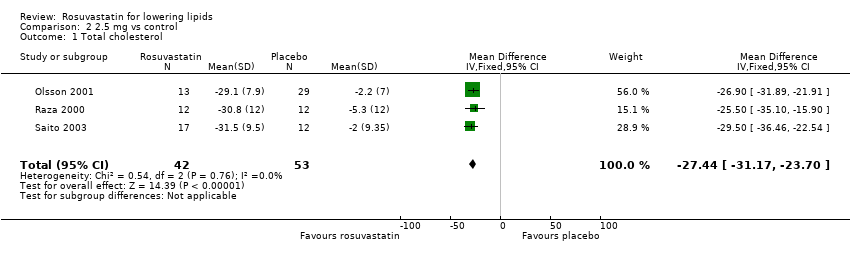
Comparison 2 2.5 mg vs control, Outcome 1 Total cholesterol.

Comparison 2 2.5 mg vs control, Outcome 2 LDL‐cholesterol.

Comparison 2 2.5 mg vs control, Outcome 3 HDL‐cholesterol.

Comparison 2 2.5 mg vs control, Outcome 4 non‐HDL‐cholesterol.
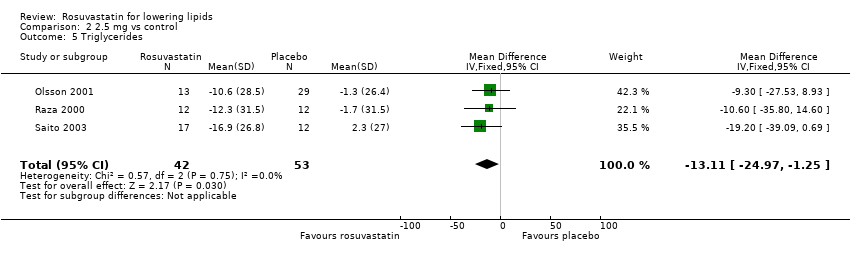
Comparison 2 2.5 mg vs control, Outcome 5 Triglycerides.

Comparison 2 2.5 mg vs control, Outcome 6 Total cholesterol.

Comparison 2 2.5 mg vs control, Outcome 7 LDL‐cholesterol.

Comparison 2 2.5 mg vs control, Outcome 8 HDL‐cholesterol.

Comparison 2 2.5 mg vs control, Outcome 9 non‐HDL‐cholesterol.

Comparison 2 2.5 mg vs control, Outcome 10 Triglycerides.
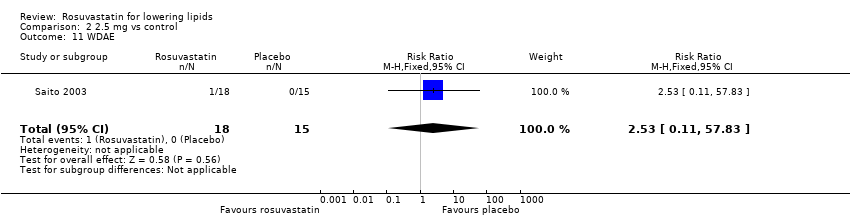
Comparison 2 2.5 mg vs control, Outcome 11 WDAE.

Comparison 3 5.0 mg vs control, Outcome 1 Total cholesterol.

Comparison 3 5.0 mg vs control, Outcome 2 LDL‐cholesterol.

Comparison 3 5.0 mg vs control, Outcome 3 HDL‐cholesterol.

Comparison 3 5.0 mg vs control, Outcome 4 non‐HDL‐cholesterol.

Comparison 3 5.0 mg vs control, Outcome 5 Triglycerides.

Comparison 3 5.0 mg vs control, Outcome 6 Total cholesterol.

Comparison 3 5.0 mg vs control, Outcome 7 LDL‐cholesterol.
Comparison 3 5.0 mg vs control, Outcome 8 HDL‐cholesterol.

Comparison 3 5.0 mg vs control, Outcome 9 non‐HDL‐cholesterol.

Comparison 3 5.0 mg vs control, Outcome 10 Triglycerides.

Comparison 3 5.0 mg vs control, Outcome 11 WDAE.

Comparison 4 10 mg vs control, Outcome 1 Total cholesterol.

Comparison 4 10 mg vs control, Outcome 2 LDL‐cholesterol.

Comparison 4 10 mg vs control, Outcome 3 HDL‐cholesterol.

Comparison 4 10 mg vs control, Outcome 4 non‐HDL‐cholesterol.

Comparison 4 10 mg vs control, Outcome 5 Triglycerides.

Comparison 4 10 mg vs control, Outcome 6 Total cholesterol.

Comparison 4 10 mg vs control, Outcome 7 LDL‐cholesterol.

Comparison 4 10 mg vs control, Outcome 8 HDL‐cholesterol.

Comparison 4 10 mg vs control, Outcome 9 non‐HDL‐cholesterol.

Comparison 4 10 mg vs control, Outcome 10 Triglycerides.

Comparison 4 10 mg vs control, Outcome 11 WDAE.

Comparison 5 20 mg vs control, Outcome 1 Total cholesterol.

Comparison 5 20 mg vs control, Outcome 2 LDL‐cholesterol.

Comparison 5 20 mg vs control, Outcome 3 HDL‐cholesterol.
Comparison 5 20 mg vs control, Outcome 4 non‐HDL‐cholesterol.
Comparison 5 20 mg vs control, Outcome 5 Triglycerides.
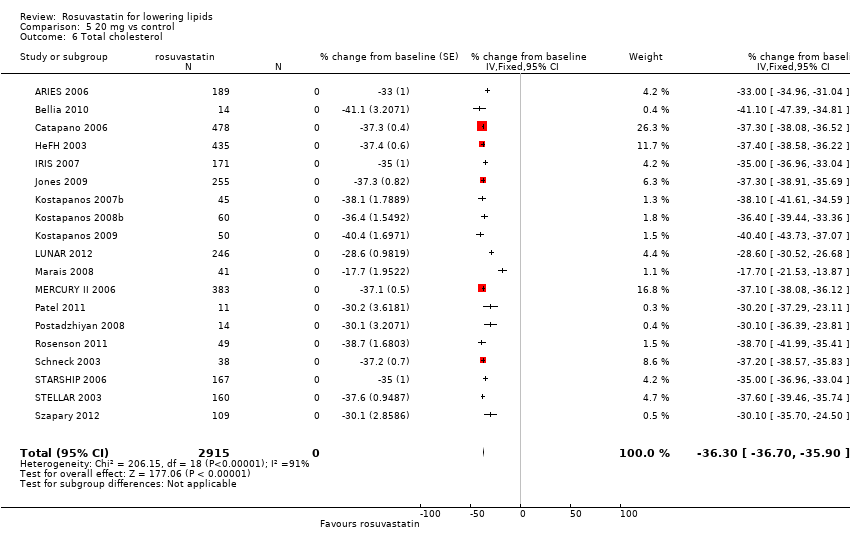
Comparison 5 20 mg vs control, Outcome 6 Total cholesterol.

Comparison 5 20 mg vs control, Outcome 7 LDL‐cholesterol.

Comparison 5 20 mg vs control, Outcome 8 HDL‐cholesterol.

Comparison 5 20 mg vs control, Outcome 9 non‐HDL‐cholesterol.
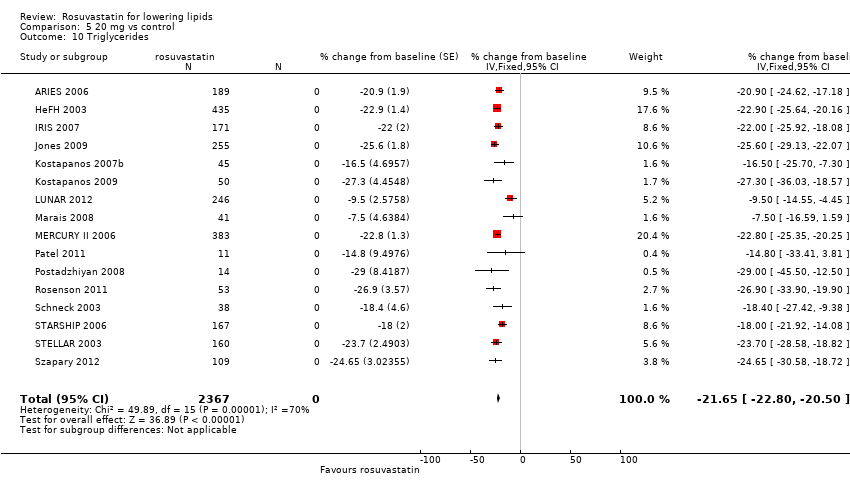
Comparison 5 20 mg vs control, Outcome 10 Triglycerides.
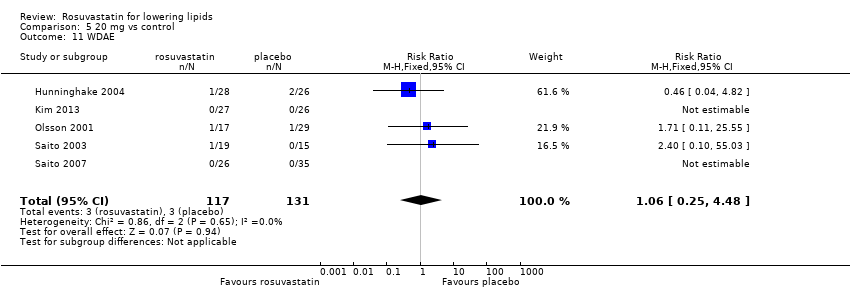
Comparison 5 20 mg vs control, Outcome 11 WDAE.
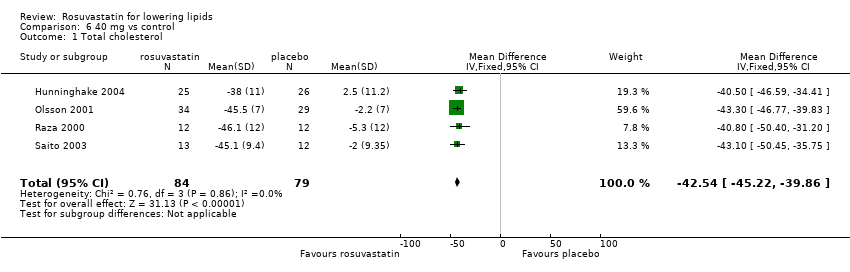
Comparison 6 40 mg vs control, Outcome 1 Total cholesterol.

Comparison 6 40 mg vs control, Outcome 2 LDL‐cholesterol.

Comparison 6 40 mg vs control, Outcome 3 HDL‐cholesterol.
Comparison 6 40 mg vs control, Outcome 4 non‐HDL‐cholesterol.
Comparison 6 40 mg vs control, Outcome 5 Triglycerides.
Comparison 6 40 mg vs control, Outcome 6 Total cholesterol.
Comparison 6 40 mg vs control, Outcome 7 LDL‐cholesterol.
Comparison 6 40 mg vs control, Outcome 8 HDL‐cholesterol.

Comparison 6 40 mg vs control, Outcome 9 non‐HDL‐cholesterol.
Comparison 6 40 mg vs control, Outcome 10 Triglycerides.

Comparison 6 40 mg vs control, Outcome 11 WDAE.

Comparison 7 80 mg vs control, Outcome 1 Total cholesterol.

Comparison 7 80 mg vs control, Outcome 2 LDL‐cholesterol.

Comparison 7 80 mg vs control, Outcome 3 HDL‐cholesterol.
Comparison 7 80 mg vs control, Outcome 4 non‐HDL‐cholesterol.

Comparison 7 80 mg vs control, Outcome 5 Triglycerides.

Comparison 7 80 mg vs control, Outcome 6 Total cholesterol.

Comparison 7 80 mg vs control, Outcome 7 LDL‐cholesterol.

Comparison 7 80 mg vs control, Outcome 8 HDL‐cholesterol.

Comparison 7 80 mg vs control, Outcome 9 non‐HDL‐cholesterol.

Comparison 7 80 mg vs control, Outcome 10 Triglycerides.
Comparison 7 80 mg vs control, Outcome 11 WDAE.

Comparison 8 all doses vs control, Outcome 1 WDAEs.
| LDL‐cholesterol lowering efficacy of rosuvastatin | |||||
| Patient or population: participantswith normal or abnormal lipid profiles Settings: clinics of hospitals Intervention: rosuvastatin Comparison: LDL‐Cholesterol per cent change from baseline for all trials Comparison: WDAEs rosuvastatin versus placebo | |||||
| Outcomes | Mean % reduction (95% CI)1 | No of Participants | Quality of the evidence | Comments | |
| LDL‐Cholesterol rosuvastatin 2.5 mg/day | ‐39.1 (‐40.6 to ‐37.6) | 450 (11) | low4 ⊕⊕⊝⊝ | Likely an overestimate of the effect; effect predicted from log dose response equation is ‐36.9% | |
| LDL‐Cholesterol rosuvastatin 5 mg/day | ‐41.3 (‐42.0 to ‐40.7) | 2602 (25) | ⊕⊕⊕⊕ | Effect predicted from log dose response equation is ‐41.4%. | |
| LDL‐Cholesterol rosuvastatin 10 mg/day | ‐45.6 (‐46.0 to ‐45.3) | 9855 (74) | ⊕⊕⊕⊕ | Effect predicted from log dose response equation is ‐45.8%. | |
| LDL‐Cholesterol rosuvastatin 20 mg/day | ‐49.9 (‐50.4 to ‐49.4) | 3675 (28) | ⊕⊕⊕⊕ | Effect predicted from log dose response equation is ‐50.2%. | |
| LDL‐Cholesterol rosuvastatin 40 mg/day | ‐54.9 (‐55.4 to ‐54.4) | 3512 (18) | ⊕⊕⊕⊕ | Effect predicted from log dose response equation is ‐54.6%. | |
| WDAE2 all doses | RR3 (0.84) (0.48 to 1.47) | 1330 | ⊕⊝⊝⊝ very low6 | Only 10 out of 18 placebo‐controlled trials reported withdrawals due to adverse effects. | |
| GRADE Working Group grades of evidence | |||||
| 1. CI: confidence interval. 2. WDAE: withdrawal due to adverse effects. 3. RR: risk ratio. 4. Small number of studies and participants with relatively wide confidence intervals and high risk of publication bias. 5. Narrow confidence intervals. 6. High risk of selective reporting bias and wide confidence interval. | |||||
| Rosuvastatin dose mg/day | 1 | 2.5 | 5 | 10 | 20 | 40 | 80 |
| Mean per cent change from control of total cholesterol | ‐22.1 | ‐26.6 | ‐29.1 | ‐32.8 | ‐36.2 | ‐40.5 | ‐44.8 |
| 95% CI1 | (‐24.9 to ‐19.3) | (‐27.9 to ‐25.3) | (‐29.6 to ‐28.6) | (‐33.1 to ‐32.6) | (‐36.6 to ‐35.8) | (‐40.9 to ‐40.1) | (‐46.6 to ‐43.1) |
| Mean per cent change from control of LDL‐C2 | ‐31.2 | ‐39.1 | ‐41.3 | ‐45.6 | ‐49.9 | ‐54.9 | ‐61.2 |
| 95% CI1 | (‐34.5 to ‐27.9) | (‐40.6 to ‐37.6) | (‐42.0 to ‐40.7) | (‐45.95 to ‐45.3) | (‐50.4 to ‐49.4) | (‐55.4 to ‐54.4) | (‐63.6 to ‐58.9) |
| Mean per cent change from control of non‐HDL‐C3 | ‐28.9 | ‐35.4 | ‐37.6 | ‐41.9 | ‐45.5 | ‐50.8 | ‐56.7 |
| 95% CI1 | (‐34.1 to ‐23.7) | (‐37.2 to ‐33.5) | (‐38.4 to ‐36.9) | (‐42.3 to ‐41.6) | (‐46.1 to ‐45.0) | (‐51.3 to ‐50.2 ) | (‐59.0 to ‐54.4) |
| Mean per cent change from control of triglycerides | ‐14.4 | ‐13.4 | ‐17.7 | ‐19.7 | ‐21.7 | ‐26.7 | ‐26.6 |
| 95% CI1 | (‐22.1 to ‐6.8) | (‐16.5 to ‐10.2) | (‐19.0 to ‐16.4) | (‐20.4 to ‐19.1) | (‐22.8 to ‐20.6) | (‐27.9 to ‐25.4) | (‐32.9 to ‐20.4) |
| 1. CI: confidence interval 2. LDL‐C: low‐density lipoprotein cholesterol 3. non‐HDL‐C: non high‐density lipoprotein cholesterol | |||||||
| Outcome or subgroup title | No. of studies | No. of participants | Statistical method | Effect size |
| 1 Total cholesterol Show forest plot | 3 | 93 | Mean Difference (IV, Fixed, 95% CI) | ‐21.83 [‐25.59, ‐18.08] |
| 2 LDL‐cholesterol Show forest plot | 3 | 93 | Mean Difference (IV, Fixed, 95% CI) | ‐31.17 [‐35.32, ‐27.02] |
| 3 HDL‐cholesterol Show forest plot | 3 | 93 | Mean Difference (IV, Fixed, 95% CI) | 8.16 [2.93, 13.38] |
| 4 non‐HDL‐cholesterol Show forest plot | 2 | 69 | Mean Difference (IV, Fixed, 95% CI) | ‐30.13 [‐38.06, ‐22.20] |
| 5 Triglycerides Show forest plot | 3 | 93 | Mean Difference (IV, Fixed, 95% CI) | ‐20.77 [‐32.73, ‐8.80] |
| 6 WDAE Show forest plot | 1 | 31 | Risk Ratio (M‐H, Fixed, 95% CI) | 0.0 [0.0, 0.0] |
| Outcome or subgroup title | No. of studies | No. of participants | Statistical method | Effect size |
| 1 Total cholesterol Show forest plot | 3 | 95 | Mean Difference (IV, Fixed, 95% CI) | ‐27.44 [‐31.17, ‐23.70] |
| 2 LDL‐cholesterol Show forest plot | 3 | 95 | Mean Difference (IV, Fixed, 95% CI) | ‐38.27 [‐42.79, ‐33.75] |
| 3 HDL‐cholesterol Show forest plot | 3 | 95 | Mean Difference (IV, Fixed, 95% CI) | 6.02 [0.88, 11.16] |
| 4 non‐HDL‐cholesterol Show forest plot | 2 | 71 | Mean Difference (IV, Fixed, 95% CI) | ‐36.47 [‐44.30, ‐28.63] |
| 5 Triglycerides Show forest plot | 3 | 95 | Mean Difference (IV, Fixed, 95% CI) | ‐13.11 [‐24.97, ‐1.25] |
| 6 Total cholesterol Show forest plot | 6 | 286 | % change from baseline (Fixed, 95% CI) | ‐26.52 [‐27.90, ‐25.13] |
| 7 LDL‐cholesterol Show forest plot | 8 | 355 | % change from baseline (Fixed, 95% CI) | ‐39.21 [‐40.76, ‐37.65] |
| 8 HDL‐cholesterol Show forest plot | 8 | 355 | % change from baseline (Fixed, 95% CI) | 4.20 [2.54, 5.85] |
| 9 non‐HDL‐cholesterol Show forest plot | 6 | 286 | Mean Difference (Fixed, 95% CI) | ‐35.27 [‐37.13, ‐33.41] |
| 10 Triglycerides Show forest plot | 8 | 355 | % change from baseline (Fixed, 95% CI) | ‐13.70 [‐16.97, ‐10.43] |
| 11 WDAE Show forest plot | 1 | 33 | Risk Ratio (M‐H, Fixed, 95% CI) | 2.53 [0.11, 57.83] |
| Outcome or subgroup title | No. of studies | No. of participants | Statistical method | Effect size |
| 1 Total cholesterol Show forest plot | 9 | 762 | Mean Difference (IV, Fixed, 95% CI) | ‐29.13 [‐30.56, ‐27.70] |
| 2 LDL‐cholesterol Show forest plot | 9 | 762 | Mean Difference (IV, Fixed, 95% CI) | ‐39.12 [‐41.11, ‐37.12] |
| 3 HDL‐cholesterol Show forest plot | 9 | 762 | Mean Difference (IV, Fixed, 95% CI) | 8.64 [6.93, 10.35] |
| 4 non‐HDL‐cholesterol Show forest plot | 8 | 738 | Mean Difference (IV, Fixed, 95% CI) | ‐36.79 [‐38.85, ‐34.72] |
| 5 Triglycerides Show forest plot | 8 | 674 | Mean Difference (IV, Fixed, 95% CI) | ‐23.08 [‐26.97, ‐19.19] |
| 6 Total cholesterol Show forest plot | 15 | 1411 | % change from baseline (Fixed, 95% CI) | ‐29.11 [‐29.69, ‐28.53] |
| 7 LDL‐cholesterol Show forest plot | 16 | 1840 | % change from baseline (Fixed, 95% CI) | ‐41.57 [‐42.22, ‐40.92] |
| 8 HDL‐cholesterol Show forest plot | 16 | 1845 | % change from baseline (Fixed, 95% CI) | 6.69 [6.04, 7.34] |
| 9 non‐HDL‐cholesterol Show forest plot | 14 | 1307 | % change from baseline (Fixed, 95% CI) | ‐37.77 [‐38.53, ‐37.01] |
| 10 Triglycerides Show forest plot | 14 | 1678 | % change from baseline (Fixed, 95% CI) | ‐16.96 [‐18.33, ‐15.60] |
| 11 WDAE Show forest plot | 5 | 561 | Risk Ratio (M‐H, Fixed, 95% CI) | 1.38 [0.70, 2.72] |
| Outcome or subgroup title | No. of studies | No. of participants | Statistical method | Effect size |
| 1 Total cholesterol Show forest plot | 15 | 1442 | Mean Difference (IV, Fixed, 95% CI) | ‐31.34 [‐32.45, ‐30.23] |
| 2 LDL‐cholesterol Show forest plot | 15 | 1442 | Mean Difference (IV, Fixed, 95% CI) | ‐42.80 [‐44.26, ‐41.35] |
| 3 HDL‐cholesterol Show forest plot | 15 | 1442 | Mean Difference (IV, Fixed, 95% CI) | 10.46 [9.40, 11.52] |
| 4 non‐HDL‐cholesterol Show forest plot | 14 | 1418 | Mean Difference (IV, Fixed, 95% CI) | ‐39.28 [‐40.82, ‐37.74] |
| 5 Triglycerides Show forest plot | 13 | 1313 | Mean Difference (IV, Fixed, 95% CI) | ‐19.97 [‐22.81, ‐17.12] |
| 6 Total cholesterol Show forest plot | 55 | 8100 | % change from baseline (Fixed, 95% CI) | ‐32.89 [‐33.14, ‐32.64] |
| 7 LDL‐cholesterol Show forest plot | 59 | 8413 | % change from baseline (Fixed, 95% CI) | ‐45.77 [‐46.09, ‐45.46] |
| 8 HDL‐cholesterol Show forest plot | 55 | 8085 | % change from baseline (Fixed, 95% CI) | 6.25 [5.93, 6.58] |
| 9 non‐HDL‐cholesterol Show forest plot | 53 | 7405 | % change from baseline (Fixed, 95% CI) | ‐42.06 [‐42.39, ‐41.72] |
| 10 Triglycerides Show forest plot | 51 | 7524 | % change from baseline (Fixed, 95% CI) | ‐19.72 [‐20.38, ‐19.07] |
| 11 WDAE Show forest plot | 6 | 724 | Risk Ratio (M‐H, Fixed, 95% CI) | 0.63 [0.29, 1.39] |
| Outcome or subgroup title | No. of studies | No. of participants | Statistical method | Effect size |
| 1 Total cholesterol Show forest plot | 8 | 576 | Mean Difference (IV, Fixed, 95% CI) | ‐33.58 [‐35.41, ‐31.75] |
| 2 LDL‐cholesterol Show forest plot | 8 | 576 | Mean Difference (IV, Fixed, 95% CI) | ‐45.83 [‐48.22, ‐43.44] |
| 3 HDL‐cholesterol Show forest plot | 8 | 576 | Mean Difference (IV, Fixed, 95% CI) | 6.82 [4.42, 9.21] |
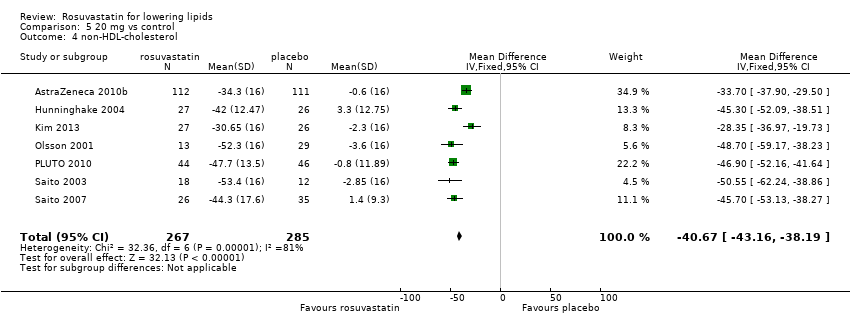
| 4 non‐HDL‐cholesterol Show forest plot | 7 | 552 | Mean Difference (IV, Fixed, 95% CI) | ‐40.67 [‐43.16, ‐38.19] |
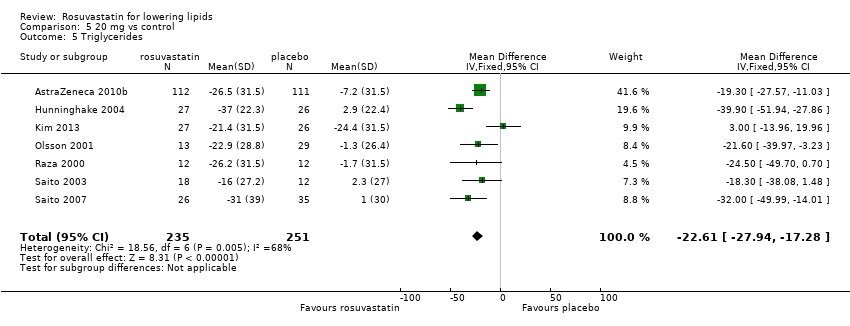
| 5 Triglycerides Show forest plot | 7 | 486 | Mean Difference (IV, Fixed, 95% CI) | ‐22.61 [‐27.94, ‐17.28] |
| 6 Total cholesterol Show forest plot | 19 | 2915 | % change from baseline (Fixed, 95% CI) | ‐36.30 [‐36.70, ‐35.90] |
| 7 LDL‐cholesterol Show forest plot | 20 | 3099 | % change from baseline (Fixed, 95% CI) | ‐50.07 [‐50.55, ‐49.58] |
| 8 HDL‐cholesterol Show forest plot | 19 | 2896 | % change from baseline (Fixed, 95% CI) | 8.03 [7.51, 8.55] |
| 9 non‐HDL‐cholesterol Show forest plot | 18 | 2461 | % change from baseline (Fixed, 95% CI) | ‐45.77 [‐46.31, ‐45.24] |
| 10 Triglycerides Show forest plot | 16 | 2367 | % change from baseline (Fixed, 95% CI) | ‐21.65 [‐22.80, ‐20.50] |
| 11 WDAE Show forest plot | 5 | 248 | Risk Ratio (M‐H, Fixed, 95% CI) | 1.06 [0.25, 4.48] |
| Outcome or subgroup title | No. of studies | No. of participants | Statistical method | Effect size |
| 1 Total cholesterol Show forest plot | 4 | 163 | Mean Difference (IV, Fixed, 95% CI) | ‐42.54 [‐45.22, ‐39.86] |
| 2 LDL‐cholesterol Show forest plot | 6 | 472 | Mean Difference (IV, Fixed, 95% CI) | ‐55.85 [‐58.31, ‐53.40] |
| 3 HDL‐cholesterol Show forest plot | 6 | 472 | Mean Difference (IV, Fixed, 95% CI) | 6.85 [4.29, 9.40] |
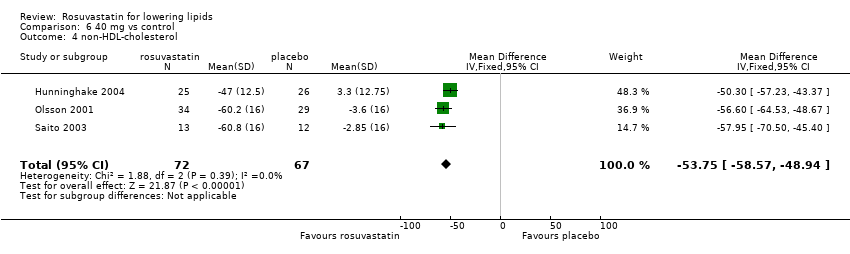
| 4 non‐HDL‐cholesterol Show forest plot | 3 | 139 | Mean Difference (IV, Fixed, 95% CI) | ‐53.75 [‐58.57, ‐48.94] |
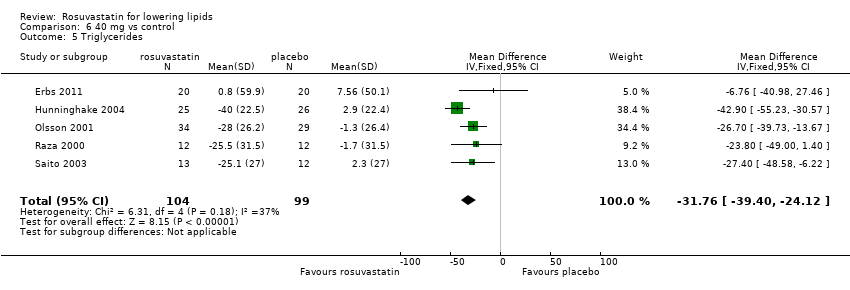
| 5 Triglycerides Show forest plot | 5 | 203 | Mean Difference (IV, Fixed, 95% CI) | ‐31.76 [‐39.40, ‐24.12] |
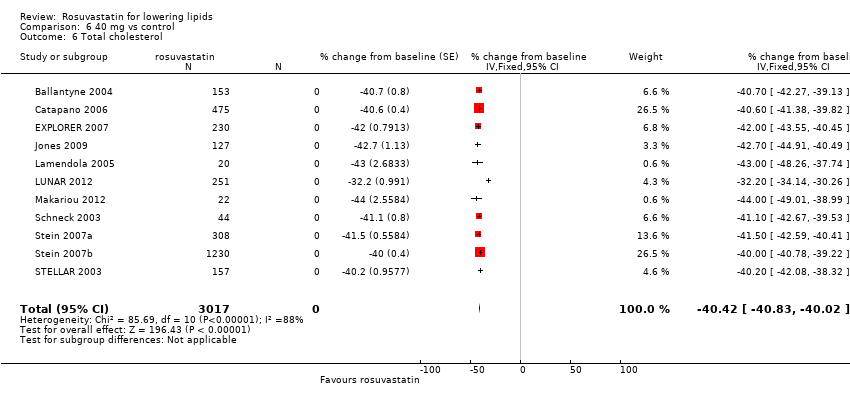
| 6 Total cholesterol Show forest plot | 11 | 3017 | % change from baseline (Fixed, 95% CI) | ‐40.42 [‐40.83, ‐40.02] |
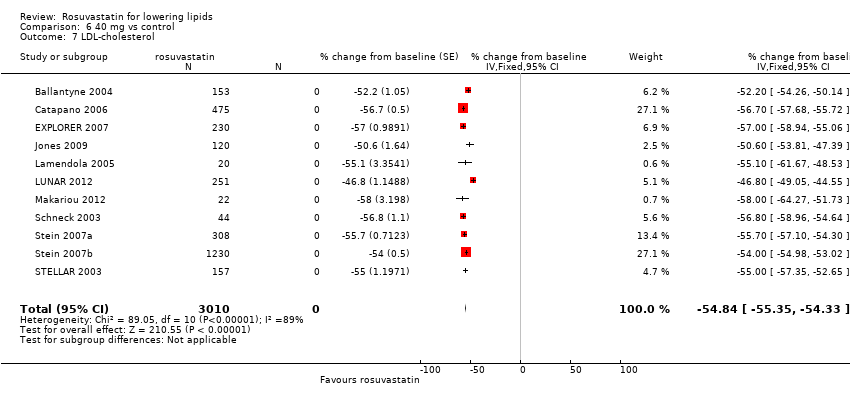
| 7 LDL‐cholesterol Show forest plot | 11 | 3010 | % change from baseline (Fixed, 95% CI) | ‐54.84 [‐55.35, ‐54.33] |
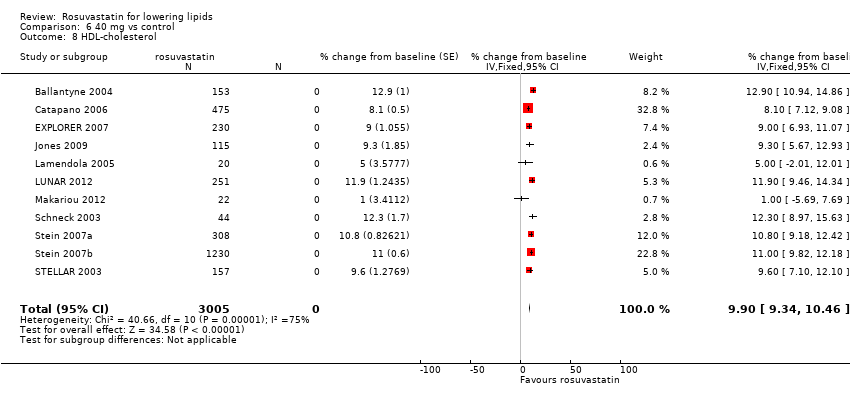
| 8 HDL‐cholesterol Show forest plot | 11 | 3005 | % change from baseline (Fixed, 95% CI) | 9.90 [9.34, 10.46] |
| 9 non‐HDL‐cholesterol Show forest plot | 11 | 3005 | % change from baseline (Fixed, 95% CI) | ‐50.69 [‐51.22, ‐50.16] |
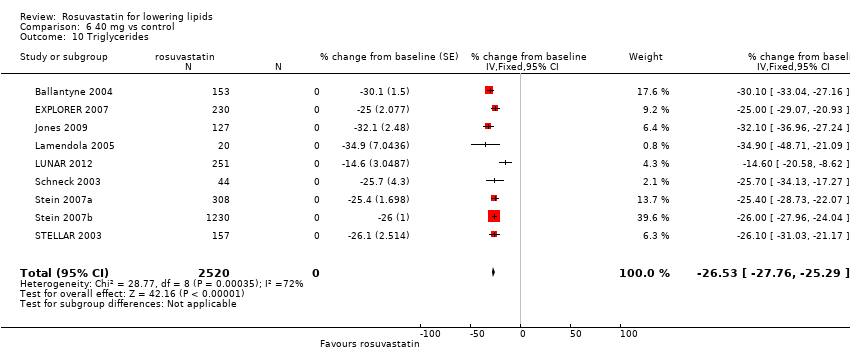
| 10 Triglycerides Show forest plot | 9 | 2520 | % change from baseline (Fixed, 95% CI) | ‐26.53 [‐27.76, ‐25.29] |
| 11 WDAE Show forest plot | 1 | 29 | Risk Ratio (M‐H, Fixed, 95% CI) | 0.0 [0.0, 0.0] |
| Outcome or subgroup title | No. of studies | No. of participants | Statistical method | Effect size |
| 1 Total cholesterol Show forest plot | 2 | 113 | Mean Difference (IV, Fixed, 95% CI) | ‐44.5 [‐47.84, ‐41.16] |
| 2 LDL‐cholesterol Show forest plot | 2 | 113 | Mean Difference (IV, Fixed, 95% CI) | ‐59.47 [‐64.15, ‐54.79] |
| 3 HDL‐cholesterol Show forest plot | 2 | 113 | Mean Difference (IV, Fixed, 95% CI) | 10.68 [5.92, 15.44] |
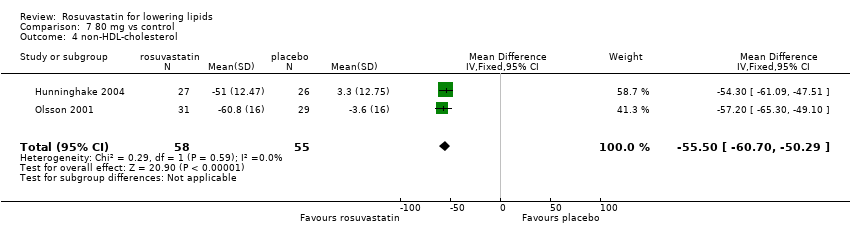
| 4 non‐HDL‐cholesterol Show forest plot | 2 | 113 | Mean Difference (IV, Fixed, 95% CI) | ‐55.50 [‐60.70, ‐50.29] |
| 5 Triglycerides Show forest plot | 2 | 113 | Mean Difference (IV, Fixed, 95% CI) | ‐34.49 [‐43.89, ‐25.10] |
| 6 Total cholesterol Show forest plot | 1 | 42 | % change from baseline (Fixed, 95% CI) | ‐43.00 [‐47.16, ‐42.84] |
| 7 LDL‐cholesterol Show forest plot | 1 | 42 | % change from baseline (Fixed, 95% CI) | ‐61.9 [‐64.64, ‐59.16] |
| 8 HDL‐cholesterol Show forest plot | 1 | 42 | % change from baseline (Fixed, 95% CI) | 9.6 [6.27, 12.93] |
| 9 non‐HDL‐cholesterol Show forest plot | 1 | 42 | % change from baseline (Fixed, 95% CI) | ‐57.0 [‐59.55, ‐54.45] |
| 10 Triglycerides Show forest plot | 1 | 42 | % change from baseline (Fixed, 95% CI) | ‐19.7 [‐28.32, ‐11.08] |
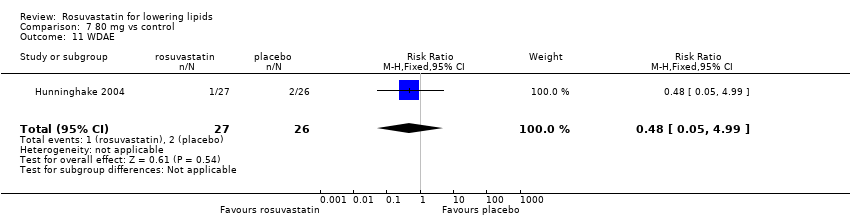
| 11 WDAE Show forest plot | 1 | 53 | Risk Ratio (M‐H, Fixed, 95% CI) | 0.48 [0.05, 4.99] |
| Outcome or subgroup title | No. of studies | No. of participants | Statistical method | Effect size |
| 1 WDAEs Show forest plot | 10 | 1330 | Risk Ratio (M‐H, Fixed, 95% CI) | 0.84 [0.48, 1.47] |