Rosuvastatina para la reducción del nivel de lípidos
Resumen
Antecedentes
La rosuvastatina es una de las estatinas más potentes y actualmente es de amplia prescripción. Por lo tanto, es importante conocer la magnitud del efecto relacionado con la dosis de la rosuvastatina sobre el nivel de lípidos en sangre.
Objetivos
Objetivo primario
Cuantificar los efectos de diversas dosis de rosuvastatina sobre el colesterol total sérico, el colesterol de lipoproteínas de baja densidad (LDL, por sus siglas en inglés), el colesterol de lipoproteínas de alta densidad (HDL, por sus siglas en inglés), el colesterol no HDL y los triglicéridos en participantes con y sinevidencia de enfermedad cardiovascular.
Objetivos secundarios
Cuantificar la variabilidad del efecto de diversas dosis de rosuvastatina.
Cuantificar los retiros debido a los efectos adversos (RDEA) en los ensayos aleatorios controlados con placebo.
Métodos de búsqueda
Se hicieron búsquedas en el Registro Cochrane Central de Ensayos Controlados (Cochrane Central Register of Controlled Trials, CENTRAL), número 10 de 12, 2014 en The Cochrane Library, MEDLINE (1946 hasta octubre, semana 5, 2014), EMBASE (1980 hasta 2014, semana 44), Web of Science Core Collection (1970 hasta 5 noviembre 2014) y BIOSIS Citation Index (1969 hasta 31 octubre 2014). No se aplicaron restricciones de idioma.
Criterios de selección
Ensayos controlados aleatorios y no controlados de antes y después que evaluaran la dosis‐respuesta de diferentes dosis fijas de rosuvastatina en el nivel de lípidos en sangre durante un periodo de tres a 12 semanas.
Obtención y análisis de los datos
Dos autores de la revisión evaluaron de forma independiente los criterios de elegibilidad para los estudios a ser incluidos y extrajeron los datos. Se obtuvo información de los ensayos controlados con placebo acerca de los retiros debidos a efectos adversos.
Resultados principales
En total, 108 ensayos (18 controlados con placebo y 90 de antes y después) evaluaron la eficacia relacionada con la dosis de rosuvastatina en 19 596 participantes. La rosuvastatina de 10 a 40 mg/día causó disminuciones en el colesterol LDL de un 46% a un 55%, cuando se combinaron todos los ensayos mediante el método de la varianza inversa genérica. La calidad de la evidencia para estos efectos es alta. Los datos del log dosis‐respuesta sobre las dosis de 1 a 80 mg, revelaron efectos lineales fuertes relacionados con la dosis sobre el colesterol total sanguíneo, el colesterol LDL y el colesterol no HDL. En comparación con atorvastatina, la rosuvastatina fue cerca de tres veces más potente para reducir el colesterol LDL. No hubo ningún efecto relacionado con la dosis de rosuvastatina en el colesterol HDL sanguíneo, aunque en términos generales, la rosuvastatina aumentó el colesterol HDL en un 7%. Existe un riesgo alto de sesgo para los ensayos de esta revisión, que podría afectar los RDEA, aunque es poco probable que afectara las mediciones de los lípidos. Los RDEA no fueron estadísticamente diferentes entre la rosuvastatina y el placebo en 10 de 18 para estos ensayos a corto plazo (cociente de riesgos 0,84; intervalo de confianza del 95%: 0,48 a 1,47).
Conclusiones de los autores
El efecto de la rosuvastatina en la reducción del nivel de colesterol total sanguíneo, el colesterol LDL y el colesterol no HDL fue linealmente dependiente de la dosis. Los datos del log dosis‐respuesta para la rosuvastatina fueron lineales en el rango de dosis prescrito habitualmente. Basado en una comparación informal con atorvastatina, estos datos representan una potencia tres veces mayor. La revisión no proporcionó una buena estimación de la incidencia de los daños asociados con la rosuvastatina debido a la corta duración de los ensayos y a la falta de información sobre los efectos adversos en el 44% de los ensayos controlados con placebo.
PICOs
Resumen en términos sencillos
Efecto de la rosuvastatina sobre el colesterol
La rosuvastatina (Crestor) es una de las estatinas más potentes y actualmente es de amplia prescripción. Por lo tanto, es importante saber cuánto reduce la rosuvastatina el nivel de colesterol. Se realizaron búsquedas de todas la evidencia de ensayos de tres a 12 semanas de duración que informaban el efecto de la rosuvastatina sobre el colesterol. Se encontraron 108 ensayos con 19 596 participantes. Basado en una comparación informal con atorvastatina, se necesitan dosis tres veces menores de rosuvastatina para reducir el colesterol en la misma cantidad. Esta revisión no puede utilizarse para evaluar los efectos perjudiciales de la rosuvastatina, debido a la corta duración de estos ensayos y el alto riesgo de sesgo para este resultado; sólo se informaron efectos adversos en 10 de los 18 ensayos que se pudieron utilizar para evaluar los daños.
Authors' conclusions
Summary of findings
| LDL‐cholesterol lowering efficacy of rosuvastatin | |||||
| Patient or population: participantswith normal or abnormal lipid profiles Settings: clinics of hospitals Intervention: rosuvastatin Comparison: LDL‐Cholesterol per cent change from baseline for all trials Comparison: WDAEs rosuvastatin versus placebo | |||||
| Outcomes | Mean % reduction (95% CI)1 | No of Participants | Quality of the evidence | Comments | |
| LDL‐Cholesterol rosuvastatin 2.5 mg/day | ‐39.1 (‐40.6 to ‐37.6) | 450 (11) | low4 ⊕⊕⊝⊝ | Likely an overestimate of the effect; effect predicted from log dose response equation is ‐36.9% | |
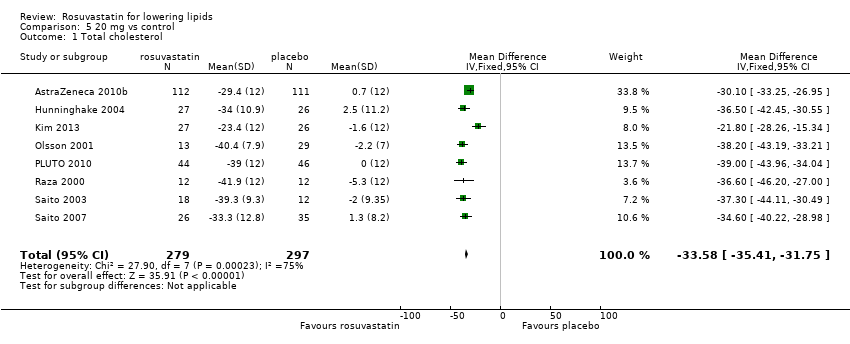
| LDL‐Cholesterol rosuvastatin 5 mg/day | ‐41.3 (‐42.0 to ‐40.7) | 2602 (25) | ⊕⊕⊕⊕ | Effect predicted from log dose response equation is ‐41.4%. | |
| LDL‐Cholesterol rosuvastatin 10 mg/day | ‐45.6 (‐46.0 to ‐45.3) | 9855 (74) | ⊕⊕⊕⊕ | Effect predicted from log dose response equation is ‐45.8%. | |
| LDL‐Cholesterol rosuvastatin 20 mg/day | ‐49.9 (‐50.4 to ‐49.4) | 3675 (28) | ⊕⊕⊕⊕ | Effect predicted from log dose response equation is ‐50.2%. | |
| LDL‐Cholesterol rosuvastatin 40 mg/day | ‐54.9 (‐55.4 to ‐54.4) | 3512 (18) | ⊕⊕⊕⊕ | Effect predicted from log dose response equation is ‐54.6%. | |
| WDAE2 all doses | RR3 (0.84) (0.48 to 1.47) | 1330 | ⊕⊝⊝⊝ very low6 | Only 10 out of 18 placebo‐controlled trials reported withdrawals due to adverse effects. | |
| GRADE Working Group grades of evidence | |||||
| 1. CI: confidence interval. 2. WDAE: withdrawal due to adverse effects. 3. RR: risk ratio. 4. Small number of studies and participants with relatively wide confidence intervals and high risk of publication bias. 5. Narrow confidence intervals. 6. High risk of selective reporting bias and wide confidence interval. | |||||
Background
Description of the condition
Cardiovascular disease is the major cause of death and disability in the developed world accounting for more than one‐third of total deaths (Kreatsoulas 2010). In the United States, cardiovascular disease causes one in three deaths reported each year (CDC 2011; Roger 2011). Existing evidence shows a weak association between adverse cardiovascular events and blood concentrations of low‐density lipoprotein (LDL)‐cholesterol in adults (Grundy 2004). The current recommended treatment for secondary prevention of adverse cardiovascular events in addition to diet and lifestyle changes is drug therapy with the drug class widely known as "statins".
Description of the intervention
Rosuvastatin is on of the most potent statins and is currently widely prescribed. Rosuvastatin and the six other marketed statins are prescribed to prevent adverse cardiovascular events and to lower total cholesterol and LDL‐cholesterol (Law 2003). Rosuvastatin is rapidly absorbed, reaching peak plasma concentration within three hours. The lipid‐lowering effect of rosuvastatin is not influenced by the time‐of‐day the drug is administered. This is probably due to the relatively long half‐life of 20 hours (Goodman 2011). Rosuvastatin and statins as a class have been shown in individual randomized controlled trials (RCTs), systematic reviews, and meta‐analyses of RCTs to reduce major vascular events in people with and without occlusive vascular disease (CTT 2005; Mills 2008; Taylor 2013). The effect of statins on morbidity and mortality, however, is not the subject of this systematic review, which is to learn more about the pharmacology of rosuvastatin by characterizing its dose‐related effect on the surrogate markers: total cholesterol, LDL‐cholesterol, high‐density lipoprotein (HDL)‐cholesterol and triglycerides. This information will be useful on its own, and will also allow comparison of rosuvastatin with the other statins that are used clinically.
How the intervention might work
Rosuvastatin acts in the liver by inhibiting an enzyme early in the pathway for cholesterol synthesis, 3‐hydroxy‐3‐methyl‐glutaryl‐coenzyme A reductase (HMG‐CoA reductase). This enzyme irreversibly converts 3‐hydroxy‐3‐methylglutaryl CoA to mevalonate (Moghadasian 1999). This reaction is the third step in a sequence of reactions resulting in the production of many compounds including cholesterol and its circulating blood derivatives, LDL‐cholesterol and very low‐density (VLDL)‐cholesterol (Gaw 2000). The prevailing hypothesis is that statins reduce mortality and morbidity in patients with occlusive vascular disease by reducing the liver production of cholesterol resulting in a reduction in blood LDL‐cholesterol and a decrease in atherogenesis. The HMG Co‐A reductase enzyme however is also responsible for the production of ubiquinone (coenzyme Q10), heme A, vitamin D, steroid hormones, and many other compounds. It remains possible that the beneficial effects of statins are due to actions other than the reduction of cholesterol. These effects are commonly referred to as the pleiotropic effects of statins (Liao 2005). Independent of how the drug works, it is important to know the average per cent reduction in the lipid parameters associated with the common doses taken by patients.
The magnitude of effect of the statin is expressed as the per cent reduction from baseline because the per cent reduction is independent of the unit of measurement and of the baseline lipid parameter. Furthermore, the per cent reduction from baseline in blood LDL‐cholesterol at the present time represents the best available pharmacological marker of the magnitude of the effect of statins on HMG Co‐A reductase.
Most importantly for this review is the fact that a fasting blood lipid profile, consisting of total cholesterol, LDL‐cholesterol, non‐HDL‐cholesterol, HDL‐cholesterol, and triglycerides, is used clinically to monitor the magnitude of the effect of a prescribed statin. Therefore, the observed per cent reduction in the five blood lipids constitutes the best available pharmacological markers of the magnitude of the statin effect, and represents the amount by which the HMG Co‐A reductase enzyme is inhibited.
Why it is important to do this review
Statins are the most widely prescribed class of drugs in the world. Prescribing of statins is increasing, as are average prescribed doses. At the present time, clinicians have an approximate sense of the different potency of the different statins, but a systematic assessment of the potency, dose‐response relationship, and variability of effect has not been completed for any of the statins except for our previous review of atorvastatin (Adams 2012a). It is possible that, in addition to differences in potency, the dose‐response relationship or the variability of response differs between different statins. A small number of previous systematic reviews have assessed the effect of statins on serum lipids (Bandolier 2004; Edwards 2003; Law 2003; Ward 2007). They have demonstrated that different statins have different potencies in terms of lipid lowering and that higher doses of statins cause greater lowering of serum lipids than lower doses (Kellick 1997; Schaefer 2004; Schectman 1996). None, however, of these systematic reviews has calculated the slope of the dose response or the variability of effect, and none of them is up‐to‐date. The most comprehensive systematic review to date is limited in that it presents the data based on the average absolute reduction in LDL concentration rather than on the per cent reduction from baseline (Law 2003). Reporting in this way can be misleading, as the absolute reduction in LDL is dependent on the baseline LDL concentration, in addition to the dose of statin. The purpose of this second systematic review is to build on Law's work.
Since rosuvastatin is the most potent widely‐prescribed statin in the world, we have chosen rosuvastatin as the second drug to study in this class. We use the surrogate marker measure of the pharmacological effect of statins, the per cent reduction from baseline, to describe the dose‐response relationship of the effect of rosuvastatin on total cholesterol, LDL‐cholesterol, HDL‐cholesterol, triglycerides and non‐HDL‐cholesterol (Boekholdt 2012). We have used the results of this review to compare rosuvastatin with atorvastatin (Adams 2012a). Subsequent reviews of other drugs in the class (i.e. cerivastatin, fluvastatin, lovastatin, pravastatin, simvastatin, and pitavastatin) will also be done, in order to compare the results with rosuvastatin and atorvastatin. The protocol for this review was published in 2012 (Adams 2012b).
Objectives
Primary objective
To quantify the effects of various doses of rosuvastatin on serum total cholesterol, LDL‐cholesterol, HDL‐cholesterol, non‐HDL‐cholesterol and triglycerides in people with, and without, evidence of cardiovascular disease.
Secondary objectives
To quantify the variability of the effect of various doses of rosuvastatin.
To quantify withdrawals due to adverse effects (WDAEs) in the randomized placebo‐controlled trials.
Methods
Criteria for considering studies for this review
Types of studies
Randomized placebo‐controlled trials (RCTs) as well as uncontrolled before‐and after‐trials. Before‐and after‐trials were included because it has been shown that there is no placebo effect of statins on lipid parameters and that a placebo control for these outcomes is not essential (Tsang 2002). Cross‐over trials were included if the outcomes were reported for the parallel arms prior to the cross‐over.
Types of participants
Participants could be of any age with, and without, evidence of cardiovascular disease. Participants could can have normal lipid parameters or any type of hyperlipidaemia or dyslipidaemia (conditions involving high levels of lipids in the blood).
We also allowed the inclusion of participants with various co‐morbid conditions including type 2 diabetes mellitus, hypertension, metabolic syndrome (combination of medical disorders that increase risk for cardiovascular disease and diabetes), chronic renal failure or cardiovascular disease.
Types of interventions
Rosuvastatin had to be administered at a constant daily dose compared with placebo, or alone for a period of three to 12 weeks. This administration period was chosen to allow at least three weeks for a steady‐state effect of rosuvastatin to occur, and to be short enough to minimize participant drop outs. Data from studies where rosuvastatin was administered in the morning, or evening, or where it was not specified were accepted. Trials required a washout baseline dietary stabilization period of at least three weeks where all previous lipid‐altering medication was withdrawn. This baseline phase ensures that participants follow a standard lipid‐regulating diet, and helps to stabilize baseline lipid values prior to treatment. Baseline dietary stabilization periods were not required in trials where participants were not receiving lipid‐altering medications or dietary supplements before receiving the test drug.
Types of outcome measures
Primary outcomes
-
Placebo‐controlled RCTs: mean per cent change of LDL‐cholesterol from baseline of different doses of rosuvastatin minus per cent change from baseline with placebo.
-
Placebo‐controlled RCTs: mean per cent change of non‐HDL‐cholesterol from baseline of different doses of rosuvastatin minus per cent change from baseline with placebo.
-
Before‐and‐after trials: mean per cent change of LDL‐cholesterol from baseline of different doses of rosuvastatin.
-
Before‐and‐after trials: mean per cent change of non‐HDL‐cholesterol from baseline of different doses of rosuvastatin.
Secondary outcomes
-
Placebo‐controlled RCTs: mean per cent change of total cholesterol from baseline of different doses of rosuvastatin minus mean per cent change from baseline with placebo.
-
Before‐and‐after trials: mean per cent change from baseline of total cholesterol of different doses of rosuvastatin. It is recognized that effects on total cholesterol are primarily due to effects on LDL‐cholesterol, which is the reason that this is a secondary outcome.
-
Placebo‐controlled RCTs: mean per cent change of HDL‐cholesterol from baseline of different doses of rosuvastatin minus mean per cent change from baseline with placebo.
-
Before‐and‐after trials: mean per cent change from baseline of HDL‐cholesterol of different doses of rosuvastatin.
-
Placebo‐controlled RCTs: mean per cent change of triglycerides from baseline of different doses of rosuvastatin minus mean per cent change from baseline with placebo.
-
Before‐and‐after trials: mean per cent change from baseline of triglycerides of different doses of rosuvastatin.
-
End of treatment variability (standard deviation) and coefficient of variation of LDL‐cholesterol measurements for each dose of rosuvastatin. It was important to know whether rosuvastatin has an effect on the variability of lipid measures and ultimately to compare this with the effect of other statins.
-
Placebo‐controlled RCTs: withdrawals due to adverse effects (WDAEs). This is an important measure of harm that can only be assessed in the placebo‐controlled trials.
Search methods for identification of studies
Electronic searches
Relevant trials of rosuvastatin were identified through searches of the Cochrane Central Register of Controlled Trials (CENTRAL) Issue 10 of 12, 2014 in The Cochrane Library, MEDLINE (Ovid, 1946 to October week 5 2014), EMBASE (Ovid, 1980 to 2014 week 44), Web of Science Core Collection (Thomson Reuters, 1970 to 5 November 2014) and BIOSIS Citation Index (Thomson Reuters, 1969 to 31 October 2014). Bibliographies of included studies were checked. Please see Appendix 1 for the search strategies.
There were no language restrictions.
Searching other resources
In cases of incomplete reports, further searches were carried out for connected papers. Previously published meta‐analysis on the efficacy of HMG‐CoA reductase inhibitors were used to help identify references to trials (CTT 2005; Edwards 2003; Law 2003). A Grey literature search (date up to November week 1 2014) was included by searching other resources.
-
SciFinder Scholar (scifinder.cas.org/scifinder/view/scifinder/scifinderExplore.jsf)
-
ClinicalTrials.gov (www.clinicaltrials.gov/)
-
International Pharmaceutical Abstracts database (EBSCO)
-
ProQuest Dissertations and Theses (search.proquest.com/pqdtft/advanced?accountid=14656)
-
AstraZeneca (www.astrazenecaclinicaltrials.com/)
-
US Food and Drug Administration (www.fda.gov/)
-
European Patent Office (worldwide.espacenet.com).
-
the metaRegister of controlled trials (mRCT) (www.controlled‐trials.com/mrct)
-
the World Health Organization (WHO) International Clinical Trials Registry Platform (ICTRP) (apps.who.int/trialsearch/)
Data collection and analysis
Selection of studies
Initial selection of trials involved reading the titles and abstracts from the electronic searches and excluding those that were obviously irrelevant. We obtained the full text of potentially relevant trials. Two review authors (SA, SS) analyzed the full‐text papers independently to decide which trials to include. Disagreements were resolved by a third party (JMW). A PRISMA flow diagram documenting this process is provided (Figure 1).

Data extraction and management
Two authors (SA, SS) extracted the mean per cent change directly from the data or calculated it from the baseline and endpoint values. If there was a disagreement for a value, consensus was reached by data recalculation to determine the correct value. We also extracted standard deviations and standard errors from the report, or calculated them, when possible. We entered data from placebo‐controlled and uncontrolled before‐and‐after trials into RevMan 5.3 as continuous and generic inverse variance data, respectively.
Assessment of risk of bias in included studies
We assessed all trials for risk of bias using the Cochrane 'Risk of bias' tool for the following items: adequate sequence generation, allocation concealment, blinding, incomplete outcome data, selective reporting, and other biases. We used ‘Risk of bias' tables in RevMan 5.3 for assessing the risk of bias in the included studies (Higgins 2011). We used the GRADE method to define the Quality of the evidence in the 'Summary of findings' table as discussed in the Cochrane Handbook for Systematic Reviews of Interventions, Section 12.2 (Higgins 2011).
Measures of treatment effect
Initially, we analyzed the treatment effects for each dose of rosuvastatin in the placebo‐controlled RCTs, and the before‐and‐after uncontrolled trials, separately. After determining that the mean effects from the two trial designs were not statistically different, we reanalyzed all efficacy study data using the generic inverse variance fixed‐effect model to determine the overall weighted treatment effects and their 95% confidence intervals (CI) for serum total cholesterol, LDL‐cholesterol, HDL‐cholesterol, non‐HDL‐cholesterol and triglycerides.
Unit of analysis issues
There were no unit of analysis issues for this review.
Dealing with missing data
We requested missing data from the authors. The most common type of data that was not reported was standard deviation of the change. For studies where standard deviations were not provided, we imputed them. The imputed value used was the average weighted standard deviation of the change from other trials in the review (Furukawa 2006).
Assessment of heterogeneity
Use of the Chi2 test to identify heterogeneity is not appropriate because it has low power when there are few studies, but has excessive power to detect clinically unimportant heterogeneity when there are many studies. A better statistic used in this review is I2, which is the between‐study variance divided by the between‐study variance plus the within‐study variance (i.e. between‐study variance/(between‐study variance + within‐study variance)). This measures the proportion of total variation in the estimate of the treatment effect that is due to heterogeneity between studies. This statistic is also independent of the number of studies in the analysis (Higgins 2002). If the I2 was greater than or equal to 50%, we used the random‐effects model to assess whether the pooled effect is statistically significant and to conservatively estimate the measure of the effect.
Assessment of reporting biases
We assessed for publication bias and other reporting biases by creating funnel plots for the primary outcomes. Asymmetry in funnel plots may indicate publication bias. Publication bias occurs as a result of the publication of positive trials and corresponding reduced likelihood that small negative trials were submitted or accepted for publication in peer‐reviewed journals (Sterne 2011).
Data synthesis
We entered all placebo‐controlled studies into RevMan 5.2 as mean difference (MD) fixed‐effect model data to determine the weighted treatment effect and 95% CI for serum total cholesterol, LDL‐cholesterol, HDL‐cholesterol, non‐HDL‐cholesterol and triglycerides. We entered all uncontrolled before‐and‐after studies as generic inverse variance fixed‐effect model data to determine the weighted treatment effect. Because the effect in the placebo‐controlled trials was not statistically significantly different from the before‐and‐after trials, we entered the data for all trials and each dose as generic inverse variance to determine the best overall weighted treatment effect for each dose.
We entered the trial data of each study and dose into GraphPad Prism 4 to yield a weighted least squares analyses based on the inverse of the square of the standard error for each lipid parameter to generate weighted log dose‐response curves. We also entered the number of participants from placebo‐controlled trials who prematurely withdrew due to at least one adverse effect into Revman 5.2 as dichotomous data for each dose and all combined doses of rosuvastatin.
Subgroup analysis and investigation of heterogeneity
The main subgroup analyses were the different doses of rosuvastatin. We assessed heterogeneity within the doses using I2 (Higgins 2002). If there was significant heterogeneity, we attempted to identify possible causes for this by carrying out a number of planned subgroup analyses, provided there were sufficient numbers of trials (see below).
Subgroups based on the following factors were analyzed when possible.
-
Placebo‐controlled trials versus before‐and‐after trials (described above).
-
Male participants versus female participants.
-
Morning administration time versus evening administration time analysis was not done because there were no trials that reported morning dosing.
-
AstraZeneca‐funded versus non‐AstraZeneca‐funded trials.
Sensitivity analysis
We conducted sensitivity analyses to assess the effect of different co‐morbidities, such as familial hyperlipidaemia, on the treatment effect.
Results
Description of studies
This review included 108 trials involving 19,596 participants. There were 90 before‐and‐after trials, 15 randomized double‐blind placebo‐controlled trials, two randomized single‐blind placebo‐controlled trials and one randomized open‐label placebo‐controlled trial. The number of placebo participants and rosuvastatin participants were 918 and 18,678 respectively. The number of male and female participants reported in 100 of the 108 trials were 9529 and 8656 respectively. Participants could be of any age. There were six familial hypercholesterolaemia trials and 102 non‐familial hypercholesterolaemia trials.
Results of the search
Database searching identified 18,377 citations and 577 other resource citations giving a total of 18,954 records. After irrelevant records and duplicates were removed, 9228 records remained. From these remaining records 278 were obtained as full‐text articles assessed for eligibility and 30 articles are awaiting classification (Figure 1).
Included studies
Two‐hundred and sixteen citations to 108 trials met the inclusion criteria and had extractable data to evaluate the dose‐related blood lipid‐lowering effect of rosuvastatin from these 265 full‐text articles. Each included study is summarized in the Characteristics of included studies table. The publication languages of the 108 included studies were 98 (91%) English, two (1.8%) Russian, five (4.6%) Chinese, two (1.8%) Japanese and one (0.9%) Hungarian.
Of the 18 placebo‐controlled trials, 15 (83.3%) were double‐blind, two (11.1%) were single‐blind, and one (5.6%) was an open‐label trial. Trials evaluating the lipid‐altering efficacy of rosuvastatin were first published in 2000. Between 2000 and 2013 the number of available studies increased and then decreased. The year with the most available studies was 2009 (Figure 2).

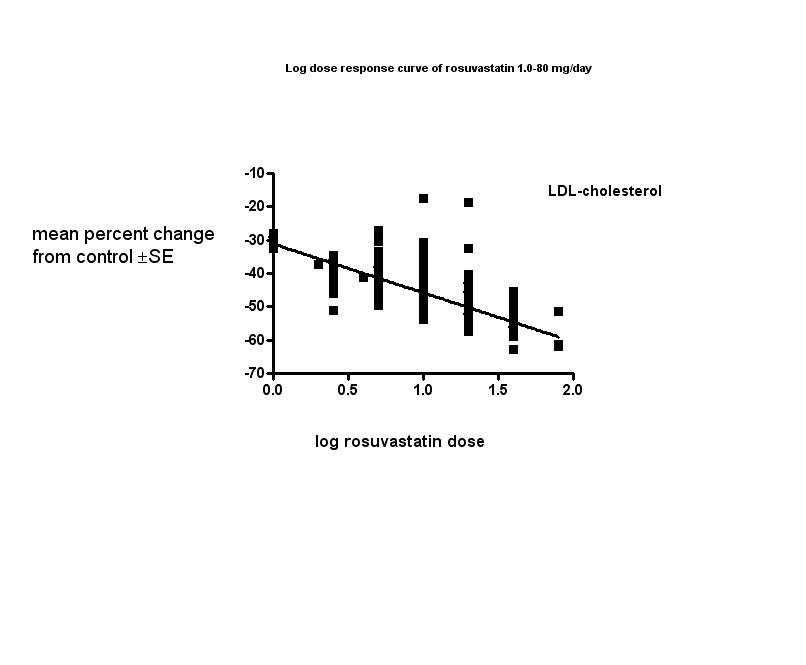
The baseline mean (range) lipid parameters were as follows: total cholesterol, 6.9 (4.5 to 15.0) mmol/L, 265 (175 to 580) mg/dL; LDL‐cholesterol, 4.6 (2.5 to 13.3) mmol/L, 178 (96 to 514) mg/dL; HDL‐cholesterol 1.26 (0.75 to 1.71) mmol/L, 48.6 (29.0 to 66.1) mg/dL; non‐HDL‐C 5.6 (3.1 to 14.1) mmol/L, 217 (121 to 544) mg/dL and triglycerides, 2.1 (0.8 to 5.8) mmol/L,189 (71 to 511) mg/dL. Trials were available over the dose range of rosuvastatin from 1 to 80 mg daily and were sufficient to generate dose‐response regression lines for each of these lipid parameters (Figure 3; Figure 4; Figure 5; Figure 6; Figure 7).

Values represent the results of each trial for each dose comparison.
The standard error bars cannot be seen because they all lie within the points.
Values represent the results of each trial for each dose comparison.
The standard error bars cannot be seen because they all lie within the points.

Values represent the results of each trial for each dose comparison.
The standard error bars cannot be seen because they all lie within the points.

Values represent the results of each trial for each dose comparison.
The standard error bars cannot be seen because they all lie within the points.

Values represent the results of each trial for each dose comparison.
The standard error bars cannot be seen because they all lie within the points.
Excluded studies
Thirty‐one studies were excluded because they did not meet the inclusion criteria. Reasons for exclusion included failure to report the number of participants, confounding, sequential data, inappropriate dosing, pooled data, attrition bias, and inadequate dietary baseline stabilization period. The reasons for excluding each trial are listed in the Characteristics of excluded studies table.
Risk of bias in included studies
Sequence generation could not be applied to the 90 before‐and‐after trials and one open‐label placebo‐controlled trial. Of the 15 double‐blind randomized placebo‐controlled trials, two (13.3%) reported adequate sequence generation. This suggests a high risk of bias for sequence generation.
Allocation
Allocation concealment could not be applied to the 90 before‐and‐after trials and one open‐label placebo‐controlled trial. Of the 15 double‐blind randomized placebo‐controlled trials, two (13.3%) reported adequate allocation concealment. This suggests a high risk of bias for allocation concealment.
Blinding
There was a high risk of blinding bias for all the before‐and‐after trials plus the open‐label placebo‐controlled trial RCT. However, lack of blinding probably had little effect on the primary outcomes, which were laboratory measurements of lipid parameters. Lack of blinding is likely to have had an effect on the ascertainment of withdrawals due to adverse effects (WDAEs).
Incomplete outcome data
Incomplete outcome reporting leading to attrition bias was not a problem in this review as few participants were lost to follow‐up and 96% of the participants completed the treatment.
Selective reporting
Out of 108 trials, 78 (72.2%) reported all relevant lipid parameters and WDAEs, thus selection bias was a potential source of bias for all outcomes. (Figure 8).

'Risk of bias' graph: review authors' judgements about each risk of bias item presented as percentages across all included studies.
Other potential sources of bias
The main other potential source of bias is industry funding. Out of the 108 trials, 57 (52.8%) reported funding by industry, 24 (22.2%) reported no industry funding and in 27 (25%) trials, source of funding was not reported. Out of the 57 industry‐funded trials 54 (94.7%) were funded by AstraZeneca, the manufacturer of rosuvastatin and three (5.6%) were funded by other pharmaceutical companies. The AstraZeneca‐funded trials might be biased in favour of rosuvastatin and would be expected to overestimate the treatment effect while trials funded by rival pharmaceutical companies might be biased against rosuvastatin and be expected to underestimate the treatment effect. In trials where the source of funding was not reported, bias could be for or against the drug.
AstraZeneca‐funded versus non‐AstraZeneca‐funded LDL‐cholesterol efficacy data were available for the doses, 5, 10, 20, 40 mg/day. These data were analyzed separately using the generic inverse variance fixed‐effect model in RevMan 5. This sensitivity analysis revealed that the lipid‐lowering efficacy of rosuvastatin in AstraZeneca‐funded versus non‐AstraZeneca‐funded trials showed statistically significant differences, but they were not consistently in one direction. The LDL‐lowering effect (AstraZeneca versus non‐AstraZeneca) was 5 mg/day (‐39.88 versus ‐45.29) P < 0.00001; 10 mg/day (‐46.44 versus ‐45.14) P < 0.00001; 20 mg/day (‐49.46 versus ‐51.02) P = 0.004; 40 mg/day (‐54.34 versus ‐56.30) P = 0.0004. These results show that AstraZeneca‐funded trials are not necessarily biased towards a greater effect of rosuvastatin.
Assessment for publication bias was done by reviewing the funnel plots for all lipid outcomes with 10 or more trials. None of these funnel plots showed significant asymmetry
Effects of interventions
Overall efficacy of rosuvastatin
Doses of 2 and 4 mg had only one trial each so the data are not shown in the Data and analyses section. The trials were included in calculating the log dose‐response curve equations. Values from all data describing the efficacy of rosuvastatin to lower the lipid parameters from placebo and before‐and‐after trials were entered as generic inverse variance data separately into GraphPad Prism 4 to yield log dose‐response curves for placebo and before‐and‐after trials. To compare slope results of placebo versus before‐and‐after trials t‐tests were performed from the slopes and standard errors of the curves for total cholesterol, LDL‐cholesterol, non‐HDL‐cholesterol and triglycerides. The results showed that there were no statistical differences between placebo trials and before‐and‐after trials for all the lipid parameters studied P > 0.5. This demonstrates that the two trial designs provide similar estimates of the lipid‐lowering efficacy of rosuvastatin. In addition, two‐tailed one sample t‐tests were performed from the placebo‐controlled trials to test for the difference between placebo mean effects and zero. HDL‐cholesterol data were not analyzed because there was no dose response for this parameter. The results of these tests demonstrated the placebo means were not statistically different from zero: total cholesterol: 0.37 (95% CI ‐1.47 to 2.21) P > 0.5, LDL‐cholesterol: ‐1.16 (95% CI ‐3.12 to 0.81) 0.2 < P < 0.5, non‐HDL‐C: ‐0.74 (95% CI ‐2.205 to 0.73) 0.2 < P < 0.5 and triglycerides: 0.72 (95% CI ‐3.84 to 5.28) P > 0.5. The evidence of lack of a placebo effect provided further justification for combining all the trials to determine the overall efficacy. This was done by entering all data into the RevMan 5 using the generic inverse variance model outside of this review (data and analysis are not shown). The mean parameters from this analysis are summarized in Table 1.
| Rosuvastatin dose mg/day | 1 | 2.5 | 5 | 10 | 20 | 40 | 80 |
| Mean per cent change from control of total cholesterol | ‐22.1 | ‐26.6 | ‐29.1 | ‐32.8 | ‐36.2 | ‐40.5 | ‐44.8 |
| 95% CI1 | (‐24.9 to ‐19.3) | (‐27.9 to ‐25.3) | (‐29.6 to ‐28.6) | (‐33.1 to ‐32.6) | (‐36.6 to ‐35.8) | (‐40.9 to ‐40.1) | (‐46.6 to ‐43.1) |
| Mean per cent change from control of LDL‐C2 | ‐31.2 | ‐39.1 | ‐41.3 | ‐45.6 | ‐49.9 | ‐54.9 | ‐61.2 |
| 95% CI1 | (‐34.5 to ‐27.9) | (‐40.6 to ‐37.6) | (‐42.0 to ‐40.7) | (‐45.95 to ‐45.3) | (‐50.4 to ‐49.4) | (‐55.4 to ‐54.4) | (‐63.6 to ‐58.9) |
| Mean per cent change from control of non‐HDL‐C3 | ‐28.9 | ‐35.4 | ‐37.6 | ‐41.9 | ‐45.5 | ‐50.8 | ‐56.7 |
| 95% CI1 | (‐34.1 to ‐23.7) | (‐37.2 to ‐33.5) | (‐38.4 to ‐36.9) | (‐42.3 to ‐41.6) | (‐46.1 to ‐45.0) | (‐51.3 to ‐50.2 ) | (‐59.0 to ‐54.4) |
| Mean per cent change from control of triglycerides | ‐14.4 | ‐13.4 | ‐17.7 | ‐19.7 | ‐21.7 | ‐26.7 | ‐26.6 |
| 95% CI1 | (‐22.1 to ‐6.8) | (‐16.5 to ‐10.2) | (‐19.0 to ‐16.4) | (‐20.4 to ‐19.1) | (‐22.8 to ‐20.6) | (‐27.9 to ‐25.4) | (‐32.9 to ‐20.4) |
1. CI: confidence interval
2. LDL‐C: low‐density lipoprotein cholesterol
3. non‐HDL‐C: non high‐density lipoprotein cholesterol
Dose‐ranging effects of rosuvastatin on blood lipids as calculated from the slopes of the log dose‐response curve equations
Data from all trials were also entered into GraphPad Prism 4 to yield a weighted least squares analysis based on the inverse of the square of the standard error for each lipid parameter in order to generate weighted log dose‐response curves for each of the lipid parameters below (Figure 3; Figure 4; Figure 5; Figure 6: Figure 7).
Total cholesterol
The effect of different doses of rosuvastatin on total cholesterol are shown in the Data and analysis section (Analysis 1.1; Analysis 2.1; Analysis 2.6; Analysis 3.1; Analysis 3.6; Analysis 4.1; Analysis 4.6; Analysis 5.1; Analysis 5.6; Analysis 6.1; Analysis 6.6; Analysis 7.1; Analysis 7.6). The analysis for total cholesterol yielded the log dose‐response straight‐line equation, y = ‐12.32 log(x) ‐20.46. This equation provides the best estimate of the mean reductions in blood total cholesterol from baseline for rosuvastatin doses ranging from 1 mg/day to 80 mg/day as it uses all the available data. Using this formula the calculated reductions in total blood cholesterol for the recommended doses of 5 to 40 mg per day was from 29% to 40%. For every two‐fold dose increase there was a 3.7% (95% CI 3.3 to 4.1) per cent decrease in blood total cholesterol (Figure 3).
LDL‐cholesterol
The effect of different doses of rosuvastatin on LDL‐cholesterol are shown in the Data and analysis section (Analysis 1.2; Analysis 2.2; Analysis 2.7; Analysis 3.2; Analysis 3.7; Analysis 4.2; Analysis 4.7; Analysis 5.2; Analysis 5.7; Analysis 6.2; Analysis 6.7; Analysis 7.2; Analysis 7.7). The analysis for LDL‐cholesterol yielded the log dose‐response straight‐line equation, y = ‐14.67 log(x) ‐31.11. This equation provides the best estimate of the mean reductions in blood LDL‐cholesterol from baseline for rosuvastatin doses ranging from 1 mg/day to 80 mg/day as it uses all the available data. Using this formula the calculated reductions in total blood LDL‐cholesterol for the recommended doses of 5 to 40 mg per day was from 41% to 55%. For every two‐fold dose increase there was a 4.42% (95% CI 3.85 to 4.99) per cent decrease in blood LDL‐cholesterol (Figure 4).
HDL‐cholesterol
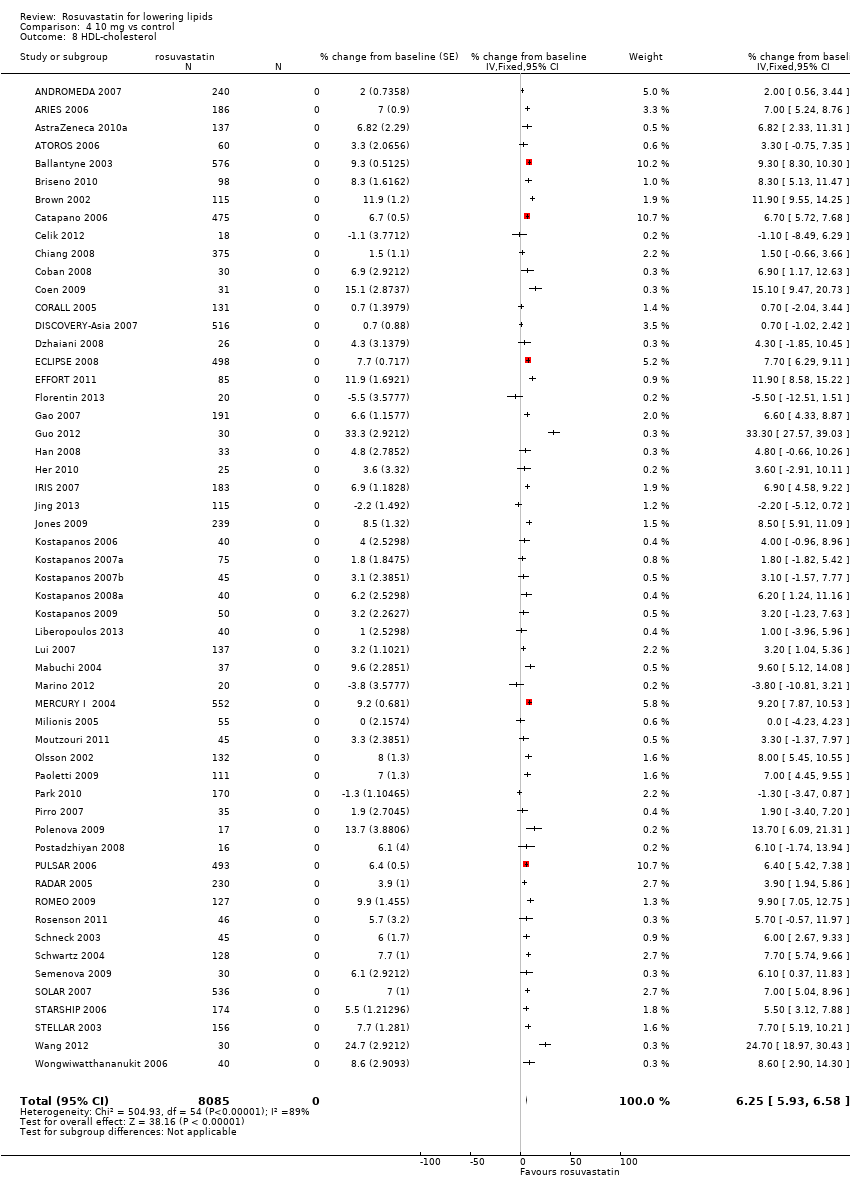
The GraphPad Prism 4 analysis showed that rosuvastatin doses ranging from 1 mg/day to 80 mg/day had no dose related effect on blood HDL‐cholesterol (Figure 5). All doses of rosuvastatin caused a small increase in HDL. When all trials and doses were pooled using generic inverse variance the magnitude of the increase was 7.3% [95% CI 7.1, 7.6].
Non‐HDL‐cholesterol
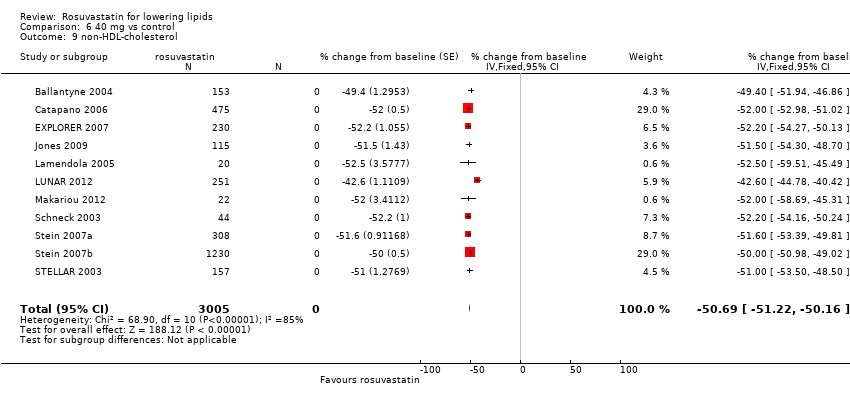
The effect of different doses of rosuvastatin on non‐HDL‐cholesterol are shown in the Data and analysis section (Analysis 1.4; Analysis 2.4; Analysis 2.9; Analysis 3.4; Analysis 3.9; Analysis 4.4; Analysis 4.9; Analysis 5.4; Analysis 5.9; Analysis 6.4; Analysis 6.9; Analysis 7.4; Analysis 7.9). The analysis for non‐HDL‐cholesterol yielded the log dose‐response straight‐line equation, y = ‐14.11 log(x) ‐27.81. This equation provides the best estimate of the mean reductions in blood non‐HDL‐cholesterol from baseline for rosuvastatin doses ranging from 1 mg/day to 80 mg/day as it uses all the available data. Using this formula the calculated reductions in non‐HDL‐cholesterol for the recommended doses of 5 to 40 mg per day ranged from 38% to 50%. For every two‐fold dose increase there was a 4.25% (95% CI 3.68 to 4.81) per cent decrease in blood non‐HDL‐cholesterol (Figure 6).
Triglycerides
The effect of different doses of rosuvastatin on triglycerides are shown in the Data and analysis section (Analysis 1.5; Analysis 2.5; Analysis 2.10; Analysis 3.5; Analysis 3.10; Analysis 4.5; Analysis 4.10; Analysis 5.5; Analysis 5.10; Analysis 6.5; Analysis 6.10; Analysis 7.5; Analysis 7.10). The analysis for triglycerides demonstrated that there was a very weak but statistically significant relationship between dose and reduction in triglycerides (Figure 7). The data summarized in the Additional Table 1 shows that the reduction in triglycerides over the recommended dose range of 5 to 40 mg per day was 18% to 27% (Table 1).
End of treatment variability
In nine of the 18 placebo‐controlled trials it was possible to compare the end of treatment variability expressed as coefficient of variation of rosuvastatin for doses of 1, 2.5, 5, 10, 20, 40 and 80 mg/day with placebo. The Kruskal‐Wallis test showed no statistically significant difference compared with placebo for end of treatment variability for total cholesterol, LDL‐cholesterol, HDL‐cholesterol, and triglycerides at all doses of rosuvastatin. There was not enough data to analyze non‐HDL‐cholesterol.
Withdrawal data
Ten (55.6%) of the 18 placebo‐controlled trials reported WDAEs during the three‐ to 12‐week treatment period. In two trials no participant discontinued treatment due to adverse effects or died during the study, therefore risk reduction was not estimable. There was no rosuvastatin dose‐response relationship for WDAEs. A pooled estimate for all doses compared to placebo showed an risk ratio (RR) of 0.84 (95% CI 0.48 to 1.47) suggesting no effect of rosuvastatin on WDAEs in these short‐term trials (Analysis 8.1).
Overall completeness and applicability of evidence
Male versus female participant data were available for the 10 mg/day dose. These data were analyzed separately for LDL‐cholesterol‐lowering efficacy using the generic inverse variance fixed‐effect model in RevMan 5 outside of this review. The subgroup analysis revealed that the efficacy in male participants was less than in female participants. The efficacy (male versus female participant) was: (‐45.07, ‐49.42) P = 0.02.
Familial versus non‐familial participant data were available for the doses 5, 10, 20 and 40 mg/day. These data were analyzed separately for LDL‐cholesterol‐lowering efficacy using the generic inverse variance fixed‐effect model in RevMan 5. The per cent reductions in familial patients versus non‐familial were not consistently in one direction: 5 mg/day (‐37.00, ‐41.37) P = 0.17; 10 mg/day (‐48.54, ‐45.64) P = 0.001; 20 mg/day (‐44.67, ‐50.66) P < 0.00001; and 40 mg/day (‐55.70, ‐54.75) P = 0.21.
Discussion
Summary of main results
Long‐term, daily rosuvastatin intake is highly effective at lowering blood LDL‐cholesterol concentrations and does so in a predictable dose‐related manner. The summary of findings Table for the main comparison documents the effect of rosuvastatin on LDL‐cholesterol over the dose range of 2.5 to 40 mg/day, which is also the range for which this systematic review has the most data. Over this range, LDL‐cholesterol is decreased by 39% to 55% (summary of findings Table for the main comparison). These large reductions reflect a reduction in synthesis of cholesterol by the liver and indicate that liver HMG CoA reductase is being inhibited by approximately one half over this dose range. This has significant implications beyond circulating LDL‐cholesterol, as LDL‐cholesterol is only one of many important biochemical products that are produced by the HMG CoA reductase pathway. Those other products, including co‐enzyme Q10, heme A, vitamin D, steroid hormones and many other compounds are also likely to be reduced by about one half over this dose range. It is important to recognize that the long‐term consequences of reduction of these products is presently unknown.
In the data and analysis section it can be seen that there are more trials and data with the before‐and‐after design than from placebo‐controlled trials. For the doses where there is a large number of trials and participants, it can be seen that estimates of the effect of rosuvastatin on the lipid parameters are similar with the two different trial designs. This, plus the demonstration that the placebo effect was not different from zero, justified using generic inverse variance and displaying the combined estimates in Table 1. In addition all trial data were entered into GraphPad Prism 4 to calculate the regression lines shown in Figure 3; Figure 4; Figure 5; Figure 6; and Figure 7. The overall efficacy results from GraphPad Prism 4 provide the best estimate of the treatment effect, because it is based on a regression line calculated from all the data for all the doses. The estimates of the average treatment effect from the regression lines are similar to those shown in Table 1.
In this review we have reported on a number of outcomes: total cholesterol (HDL‐cholesterol, LDL‐cholesterol and triglycerides), non‐HDL‐cholesterol (LDL‐cholesterol and triglycerides), and the individual components: HDL‐cholesterol, LDL‐cholesterol and triglycerides. In the review of atorvastatin non‐HDL‐cholesterol was not included. Adding non‐HDL‐cholesterol as an outcome in the rosuvastatin review was a considerable amount of additional work, but did not add any additional value. It would thus not be worth including in future reviews of other statins.
In this review it was established using regression analysis that there was a correlation between the baseline value and rosuvastatin effect on LDL‐cholesterol when the effect was expressed as absolute change from baseline (P < 0.0001). There was no correlation between the baseline value and the rosuvastatin effect when the effect was expressed as per cent reduction from baseline (P = 0.92). This finding provides strong support for the fact that systematic reviews reporting the effect of statins on absolute changes in lipid parameters are problematic and misleading.
What is the effect of rosuvastatin on the end of treatment variability?
The end of treatment variabilities of rosuvastatin and placebo were compared in order to determine the effect of rosuvastatin on variability of blood lipids when expressed as coefficient of variation. Compared with placebo, rosuvastatin did not increase the coefficient of variation of blood total cholesterol, LDL‐cholesterol, HDL‐cholesterol and triglycerides. This suggests that variability in lipid parameters is not increased or decreased by rosuvastatin, however it was based on a relatively small number of comparisons because the end of treatment standard deviation was often not reported.
Does rosuvastatin increase withdrawals due to adverse effects?
Ten of the 18 placebo‐controlled trials (55.6%) reported withdrawals due to adverse effects (WDAEs). This analysis only represented 1330 participants, 873 who received rosuvastatin and 457 who received placebo. The results did not show a dose‐response relationship of rosuvastatin for WDAE and the pooled estimate for all doses was a RR of 0.84 (95% CI 0.48 to 1.47), demonstrating uncertainty, but the possibility of a reduction or increase in risk remains. Since eight (44.4%) out of 18 placebo‐controlled trials did not report WDAEs, there is a high risk of selective reporting bias for this outcome and the null effect may be a result of that bias. Furthermore, this analysis was limited to trials of three to 12 weeks' duration and thus does not reflect the adverse effects of rosuvastatin occurring after longer durations of intake. Furthermore, there is probably a high risk of patient selection bias in these trials as many of the patients studied were likely known to tolerate statins at baseline. Since the trials do not report on this it cannot be specifically assessed.
Overall completeness and applicability of evidence
This review included 108 trials with 19,596 participants. As such it provided us with robust evidence of the dose‐related lipid‐lowering effects of rosuvastatin. Practitioners can use this evidence to calculate the expected effect of doses of rosuvastatin commonly utilized in society. It is unlikely that further research will change these estimates appreciably. However, there was a fair amount of heterogeneity in many of the estimates and it is possible that this was due to differences in the populations being studied (e.g. gender or genetic differences) (Thompson 2005). To explore this, we compared in the trials where it was possible, the lipid‐lowering efficacy of rosuvastatin between male and female participants plus between patients with familial and non‐familial hypercholesterolaemia.
The subgroup analysis in male and female participants was limited to the 10 mg dose but showed that the effect in female participants was greater than in male participants. This may be real and would be important to confirm. If it is real, it could be due to the fact that on average women weigh less than men and thus the dose per kilogram is greater in women than men. This demonstrates why it is important for authors to report data separately by sex. If this had been done in most or all of the trials in this review it would have been possible to be more certain whether a sex difference in effect is real.
In a paper by (Choumerianou 2005), statins were less efficacious in lowering LDL‐cholesterol in familial hypercholesterolaemia patients than in non‐familial hypercholesterolaemia patients. This could have been a possible explanation for some of the heterogeneity found in the review. We we carried out a subgroup analysis comparing the efficacy of rosuvastatin in patients with familial and non‐familial hypercholesterolaemia and we found no consistent differences between the two patient groups. More research is needed to determine whether the lipid‐lowering efficacy is different in patients with familial hypercholesterolaemia compared to the rest of the population.
The profound and relatively consistent effect of rosuvastatin on lipid parameters shown in this review is well known to clinicians who treat patients with these drugs. This has implications to statin trials as whether a patient is taking a statin or not is most likely evident to investigators and patients involved in placebo‐controlled RCTs. Thus knowledge of the lipid parameters almost certainly leads to loss of blinding in statin RCTs. The present review calls attention to that problem and future statin RCTs must be designed to prevent this loss of blinding bias.
Quality of the evidence
The summary of all 'Risk of bias' tools for the lipid effects suggests a high risk of bias for this review (Figure 8). However the lipid parameter outcomes, because they are performed in a laboratory separate from the conduct of the trial, are probably relatively free of bias. If anything, bias would lead to an overestimate of the lipid‐lowering effects rather than an underestimate. However, because of the objectivity of the lipid measurements we think that the effect estimates are reasonably accurate. This view is strengthened by the fact that we could not show evidence of funding bias and review of funnel plots did not suggest evidence of publication bias.
That is not true for the outcome assessing harm and withdrawals due to adverse effects (WDAE). This could only be assessed in the placebo‐controlled trials and this outcome was not reported in eight (44.4%) of the 18 placebo‐controlled trials. There is therefore a high risk of selective reporting bias and this combined with the high risk of other biases means that we cannot be confident that the finding of no increase in WDAEs is correct (see summary of findings Table for the main comparison).
The most likely place to find evidence of funding bias was by comparing AstraZeneca‐funded trials where an overestimate of the effect might be expected and non‐AstraZeneca‐funded trials where a bias towards underestimating the effect of rosuvastatin may be expected. The fact that this comparison did not show a consistent effect one way or the other suggests that lipid measurements are relatively resistant to bias.
Potential biases in the review process
One limitation of this review is that many trials did not report standard deviations for the lipid‐lowering effects. In those trials the standard deviation of the per cent change from baseline of the blood lipid parameters were imputed as the average of this parameter from trials that reported it. These values were determined by the method of (Furukawa 2006). Such imputation might weight some studies more or less; however, this has been shown in other reviews not to have much effect on the estimate of the effect size (Heran 2008). Another limitation is that in this review few studies were available to demonstrate the effect of rosuvastatin at very low and very high doses.
Agreements and disagreements with other studies or reviews
The best estimate of the mean per cent reduction in blood LDL‐cholesterol for any dose of rosuvastatin can be calculated from our log dose‐response equation. Using this equation y = ‐14.67 log(x) ‐31.11, a rosuvastatin dose of 40 mg/day reduces LDL‐cholesterol by an average of 54.3%. This is within the range of 53.6% to 58.8% reduction in LDL‐cholesterol from the five comparative trials from the Drug Effectiveness Review Project (DERP) (Smith 2009), but significantly lower than the manufacturers prescribing information estimate of 63% (Crestor Prescribing Information 2015).
Comparison of the effect with other statins
The greatest value in doing this type of review is the ability to compare rosuvastatin to other statins. At present we can only compare it to atorvastatin, which has been reviewed using the same protocol. When this comparison is done, the slope of the dose‐response relationship for total cholesterol is similar for atorvastatin (‐12.75) and rosuvastatin (‐12.32). This is consistent with the two drugs acting by a similar mechanism. However, rosuvastatin is more potent than atorvastatin meaning that the same reduction in total cholesterol requires less drug for rosuvastatin than atorvastatin. For example, rosuvastatin at a dose of 10 mg day reduces total cholesterol by 33%; the dose of atorvastatin to achieve the same reduction in cholesterol is 29 mg. Making the same comparison for LDL‐cholesterol rosuvastatin 10 mg reduces it on average by 46%; the dose of atorvastatin to achieve the same reduction is 30 mg. Therefore, in terms of reduction in LDL‐cholesterol, rosuvastatin is three‐fold more potent. The dose‐response slope for atorvastatin for LDL‐cholesterol (‐18.13) was statistically greater than rosuvastatin (‐14.67), however, in view of the similar slope for total cholesterol, we think that this does not reflect a difference in the mechanism whereby these 2 drugs lower cholesterol in humans.
The three‐fold difference in potency between rosuvastatin and atorvastatin shown in this review is greater than the common thinking that rosuvastatin is two‐fold more potent than atorvastatin and that 5 to 40 mg of rosuvastatin is approximately equipotent to 10 to 80 mg of atorvastatin.
In contrast to the three‐fold greater potency of rosuvastatin on LDL‐cholesterol, there is very little difference in potency between the two drugs when it comes to the effect on triglycerides: 10 to 20 mg of rosuvastatin and atorvastatin reduce triglycerides by 21% and 19% respectively, whereas 40 to 80 mg of rosuvastatin and atorvastatin reduce triglycerides by 27% and 30% respectively (Table 1).
When comparing the effect of the two drugs on HDL‐cholesterol both rosuvastatin and atorvastatin do not show a dose‐related effect and both increase HDL by a small amount. The effect of rosuvastatin on HDL, 7.3% (95%CI 7.1 to 7.6) is significantly greater than the effect of atorvastatin on HDL, 4.1% (95%CI 3.9 to 4.2).
At the present time there is nothing to suggest that one statin is different than another statin in terms of the benefit in reduction of atherosclerotic‐related events: myocardial infarction and ischaemic stroke (Taylor 2013). Therefore there is no reason to suggest that the differences demonstrated in this review between atorvastatin and rosuvastatin on surrogate outcomes, would lead to any advantages in terms of the use of statins clinically. It will be useful to complete the reviews of the other statins to know how they compare in terms of the effects on the lipid surrogate outcomes.
Values represent the results of each trial for each dose comparison.
The standard error bars cannot be seen because they all lie within the points.
Values represent the results of each trial for each dose comparison.
The standard error bars cannot be seen because they all lie within the points.
Values represent the results of each trial for each dose comparison.
The standard error bars cannot be seen because they all lie within the points.
Values represent the results of each trial for each dose comparison.
The standard error bars cannot be seen because they all lie within the points.
Values represent the results of each trial for each dose comparison.
The standard error bars cannot be seen because they all lie within the points.
'Risk of bias' graph: review authors' judgements about each risk of bias item presented as percentages across all included studies.

Comparison 1 1.0 mg vs control, Outcome 1 Total cholesterol.

Comparison 1 1.0 mg vs control, Outcome 2 LDL‐cholesterol.

Comparison 1 1.0 mg vs control, Outcome 3 HDL‐cholesterol.
Comparison 1 1.0 mg vs control, Outcome 4 non‐HDL‐cholesterol.

Comparison 1 1.0 mg vs control, Outcome 5 Triglycerides.

Comparison 1 1.0 mg vs control, Outcome 6 WDAE.

Comparison 2 2.5 mg vs control, Outcome 1 Total cholesterol.

Comparison 2 2.5 mg vs control, Outcome 2 LDL‐cholesterol.

Comparison 2 2.5 mg vs control, Outcome 3 HDL‐cholesterol.

Comparison 2 2.5 mg vs control, Outcome 4 non‐HDL‐cholesterol.

Comparison 2 2.5 mg vs control, Outcome 5 Triglycerides.

Comparison 2 2.5 mg vs control, Outcome 6 Total cholesterol.
Comparison 2 2.5 mg vs control, Outcome 7 LDL‐cholesterol.

Comparison 2 2.5 mg vs control, Outcome 8 HDL‐cholesterol.

Comparison 2 2.5 mg vs control, Outcome 9 non‐HDL‐cholesterol.

Comparison 2 2.5 mg vs control, Outcome 10 Triglycerides.
Comparison 2 2.5 mg vs control, Outcome 11 WDAE.

Comparison 3 5.0 mg vs control, Outcome 1 Total cholesterol.

Comparison 3 5.0 mg vs control, Outcome 2 LDL‐cholesterol.
Comparison 3 5.0 mg vs control, Outcome 3 HDL‐cholesterol.

Comparison 3 5.0 mg vs control, Outcome 4 non‐HDL‐cholesterol.

Comparison 3 5.0 mg vs control, Outcome 5 Triglycerides.

Comparison 3 5.0 mg vs control, Outcome 6 Total cholesterol.

Comparison 3 5.0 mg vs control, Outcome 7 LDL‐cholesterol.

Comparison 3 5.0 mg vs control, Outcome 8 HDL‐cholesterol.
Comparison 3 5.0 mg vs control, Outcome 9 non‐HDL‐cholesterol.

Comparison 3 5.0 mg vs control, Outcome 10 Triglycerides.
Comparison 3 5.0 mg vs control, Outcome 11 WDAE.

Comparison 4 10 mg vs control, Outcome 1 Total cholesterol.
Comparison 4 10 mg vs control, Outcome 2 LDL‐cholesterol.

Comparison 4 10 mg vs control, Outcome 3 HDL‐cholesterol.

Comparison 4 10 mg vs control, Outcome 4 non‐HDL‐cholesterol.

Comparison 4 10 mg vs control, Outcome 5 Triglycerides.

Comparison 4 10 mg vs control, Outcome 6 Total cholesterol.

Comparison 4 10 mg vs control, Outcome 7 LDL‐cholesterol.
Comparison 4 10 mg vs control, Outcome 8 HDL‐cholesterol.

Comparison 4 10 mg vs control, Outcome 9 non‐HDL‐cholesterol.

Comparison 4 10 mg vs control, Outcome 10 Triglycerides.

Comparison 4 10 mg vs control, Outcome 11 WDAE.
Comparison 5 20 mg vs control, Outcome 1 Total cholesterol.

Comparison 5 20 mg vs control, Outcome 2 LDL‐cholesterol.

Comparison 5 20 mg vs control, Outcome 3 HDL‐cholesterol.

Comparison 5 20 mg vs control, Outcome 4 non‐HDL‐cholesterol.

Comparison 5 20 mg vs control, Outcome 5 Triglycerides.

Comparison 5 20 mg vs control, Outcome 6 Total cholesterol.

Comparison 5 20 mg vs control, Outcome 7 LDL‐cholesterol.

Comparison 5 20 mg vs control, Outcome 8 HDL‐cholesterol.

Comparison 5 20 mg vs control, Outcome 9 non‐HDL‐cholesterol.

Comparison 5 20 mg vs control, Outcome 10 Triglycerides.

Comparison 5 20 mg vs control, Outcome 11 WDAE.

Comparison 6 40 mg vs control, Outcome 1 Total cholesterol.

Comparison 6 40 mg vs control, Outcome 2 LDL‐cholesterol.

Comparison 6 40 mg vs control, Outcome 3 HDL‐cholesterol.

Comparison 6 40 mg vs control, Outcome 4 non‐HDL‐cholesterol.

Comparison 6 40 mg vs control, Outcome 5 Triglycerides.

Comparison 6 40 mg vs control, Outcome 6 Total cholesterol.

Comparison 6 40 mg vs control, Outcome 7 LDL‐cholesterol.

Comparison 6 40 mg vs control, Outcome 8 HDL‐cholesterol.
Comparison 6 40 mg vs control, Outcome 9 non‐HDL‐cholesterol.

Comparison 6 40 mg vs control, Outcome 10 Triglycerides.
Comparison 6 40 mg vs control, Outcome 11 WDAE.

Comparison 7 80 mg vs control, Outcome 1 Total cholesterol.

Comparison 7 80 mg vs control, Outcome 2 LDL‐cholesterol.

Comparison 7 80 mg vs control, Outcome 3 HDL‐cholesterol.
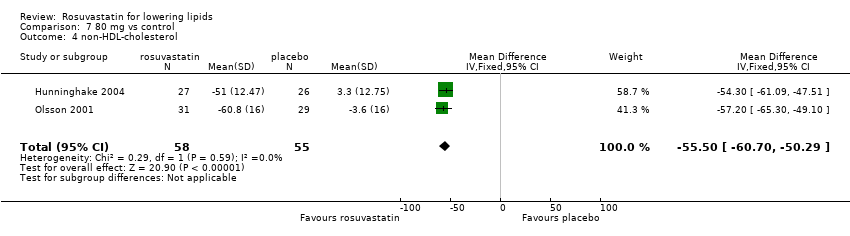
Comparison 7 80 mg vs control, Outcome 4 non‐HDL‐cholesterol.

Comparison 7 80 mg vs control, Outcome 5 Triglycerides.

Comparison 7 80 mg vs control, Outcome 6 Total cholesterol.

Comparison 7 80 mg vs control, Outcome 7 LDL‐cholesterol.
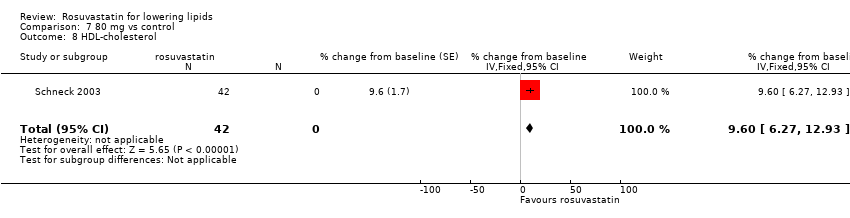
Comparison 7 80 mg vs control, Outcome 8 HDL‐cholesterol.

Comparison 7 80 mg vs control, Outcome 9 non‐HDL‐cholesterol.
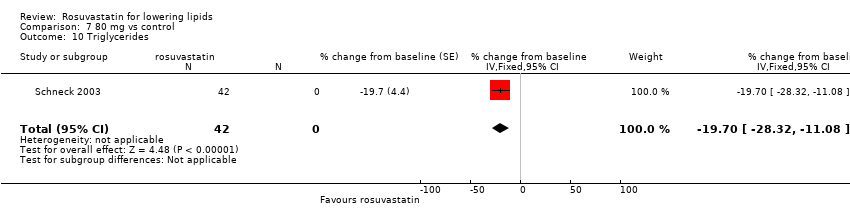
Comparison 7 80 mg vs control, Outcome 10 Triglycerides.

Comparison 7 80 mg vs control, Outcome 11 WDAE.

Comparison 8 all doses vs control, Outcome 1 WDAEs.
| LDL‐cholesterol lowering efficacy of rosuvastatin | |||||
| Patient or population: participantswith normal or abnormal lipid profiles Settings: clinics of hospitals Intervention: rosuvastatin Comparison: LDL‐Cholesterol per cent change from baseline for all trials Comparison: WDAEs rosuvastatin versus placebo | |||||
| Outcomes | Mean % reduction (95% CI)1 | No of Participants | Quality of the evidence | Comments | |
| LDL‐Cholesterol rosuvastatin 2.5 mg/day | ‐39.1 (‐40.6 to ‐37.6) | 450 (11) | low4 ⊕⊕⊝⊝ | Likely an overestimate of the effect; effect predicted from log dose response equation is ‐36.9% | |
| LDL‐Cholesterol rosuvastatin 5 mg/day | ‐41.3 (‐42.0 to ‐40.7) | 2602 (25) | ⊕⊕⊕⊕ | Effect predicted from log dose response equation is ‐41.4%. | |
| LDL‐Cholesterol rosuvastatin 10 mg/day | ‐45.6 (‐46.0 to ‐45.3) | 9855 (74) | ⊕⊕⊕⊕ | Effect predicted from log dose response equation is ‐45.8%. | |
| LDL‐Cholesterol rosuvastatin 20 mg/day | ‐49.9 (‐50.4 to ‐49.4) | 3675 (28) | ⊕⊕⊕⊕ | Effect predicted from log dose response equation is ‐50.2%. | |
| LDL‐Cholesterol rosuvastatin 40 mg/day | ‐54.9 (‐55.4 to ‐54.4) | 3512 (18) | ⊕⊕⊕⊕ | Effect predicted from log dose response equation is ‐54.6%. | |
| WDAE2 all doses | RR3 (0.84) (0.48 to 1.47) | 1330 | ⊕⊝⊝⊝ very low6 | Only 10 out of 18 placebo‐controlled trials reported withdrawals due to adverse effects. | |
| GRADE Working Group grades of evidence | |||||
| 1. CI: confidence interval. 2. WDAE: withdrawal due to adverse effects. 3. RR: risk ratio. 4. Small number of studies and participants with relatively wide confidence intervals and high risk of publication bias. 5. Narrow confidence intervals. 6. High risk of selective reporting bias and wide confidence interval. | |||||
| Rosuvastatin dose mg/day | 1 | 2.5 | 5 | 10 | 20 | 40 | 80 |
| Mean per cent change from control of total cholesterol | ‐22.1 | ‐26.6 | ‐29.1 | ‐32.8 | ‐36.2 | ‐40.5 | ‐44.8 |
| 95% CI1 | (‐24.9 to ‐19.3) | (‐27.9 to ‐25.3) | (‐29.6 to ‐28.6) | (‐33.1 to ‐32.6) | (‐36.6 to ‐35.8) | (‐40.9 to ‐40.1) | (‐46.6 to ‐43.1) |
| Mean per cent change from control of LDL‐C2 | ‐31.2 | ‐39.1 | ‐41.3 | ‐45.6 | ‐49.9 | ‐54.9 | ‐61.2 |
| 95% CI1 | (‐34.5 to ‐27.9) | (‐40.6 to ‐37.6) | (‐42.0 to ‐40.7) | (‐45.95 to ‐45.3) | (‐50.4 to ‐49.4) | (‐55.4 to ‐54.4) | (‐63.6 to ‐58.9) |
| Mean per cent change from control of non‐HDL‐C3 | ‐28.9 | ‐35.4 | ‐37.6 | ‐41.9 | ‐45.5 | ‐50.8 | ‐56.7 |
| 95% CI1 | (‐34.1 to ‐23.7) | (‐37.2 to ‐33.5) | (‐38.4 to ‐36.9) | (‐42.3 to ‐41.6) | (‐46.1 to ‐45.0) | (‐51.3 to ‐50.2 ) | (‐59.0 to ‐54.4) |
| Mean per cent change from control of triglycerides | ‐14.4 | ‐13.4 | ‐17.7 | ‐19.7 | ‐21.7 | ‐26.7 | ‐26.6 |
| 95% CI1 | (‐22.1 to ‐6.8) | (‐16.5 to ‐10.2) | (‐19.0 to ‐16.4) | (‐20.4 to ‐19.1) | (‐22.8 to ‐20.6) | (‐27.9 to ‐25.4) | (‐32.9 to ‐20.4) |
| 1. CI: confidence interval 2. LDL‐C: low‐density lipoprotein cholesterol 3. non‐HDL‐C: non high‐density lipoprotein cholesterol | |||||||
| Outcome or subgroup title | No. of studies | No. of participants | Statistical method | Effect size |
| 1 Total cholesterol Show forest plot | 3 | 93 | Mean Difference (IV, Fixed, 95% CI) | ‐21.83 [‐25.59, ‐18.08] |
| 2 LDL‐cholesterol Show forest plot | 3 | 93 | Mean Difference (IV, Fixed, 95% CI) | ‐31.17 [‐35.32, ‐27.02] |
| 3 HDL‐cholesterol Show forest plot | 3 | 93 | Mean Difference (IV, Fixed, 95% CI) | 8.16 [2.93, 13.38] |
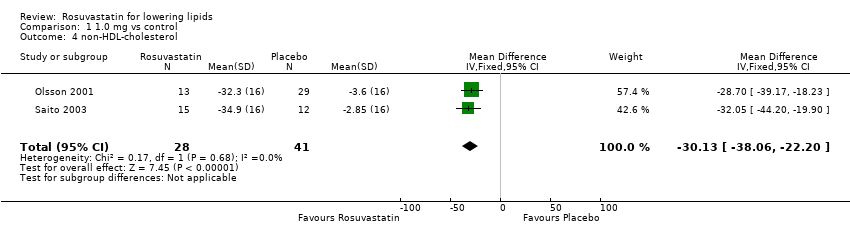
| 4 non‐HDL‐cholesterol Show forest plot | 2 | 69 | Mean Difference (IV, Fixed, 95% CI) | ‐30.13 [‐38.06, ‐22.20] |
| 5 Triglycerides Show forest plot | 3 | 93 | Mean Difference (IV, Fixed, 95% CI) | ‐20.77 [‐32.73, ‐8.80] |
| 6 WDAE Show forest plot | 1 | 31 | Risk Ratio (M‐H, Fixed, 95% CI) | 0.0 [0.0, 0.0] |
| Outcome or subgroup title | No. of studies | No. of participants | Statistical method | Effect size |
| 1 Total cholesterol Show forest plot | 3 | 95 | Mean Difference (IV, Fixed, 95% CI) | ‐27.44 [‐31.17, ‐23.70] |
| 2 LDL‐cholesterol Show forest plot | 3 | 95 | Mean Difference (IV, Fixed, 95% CI) | ‐38.27 [‐42.79, ‐33.75] |
| 3 HDL‐cholesterol Show forest plot | 3 | 95 | Mean Difference (IV, Fixed, 95% CI) | 6.02 [0.88, 11.16] |
| 4 non‐HDL‐cholesterol Show forest plot | 2 | 71 | Mean Difference (IV, Fixed, 95% CI) | ‐36.47 [‐44.30, ‐28.63] |
| 5 Triglycerides Show forest plot | 3 | 95 | Mean Difference (IV, Fixed, 95% CI) | ‐13.11 [‐24.97, ‐1.25] |
| 6 Total cholesterol Show forest plot | 6 | 286 | % change from baseline (Fixed, 95% CI) | ‐26.52 [‐27.90, ‐25.13] |
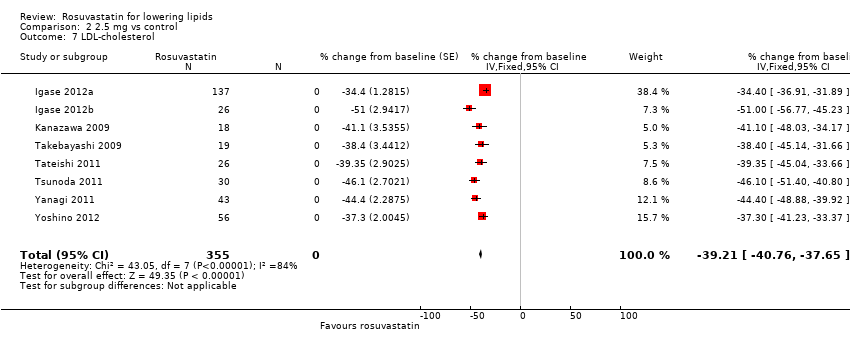
| 7 LDL‐cholesterol Show forest plot | 8 | 355 | % change from baseline (Fixed, 95% CI) | ‐39.21 [‐40.76, ‐37.65] |
| 8 HDL‐cholesterol Show forest plot | 8 | 355 | % change from baseline (Fixed, 95% CI) | 4.20 [2.54, 5.85] |
| 9 non‐HDL‐cholesterol Show forest plot | 6 | 286 | Mean Difference (Fixed, 95% CI) | ‐35.27 [‐37.13, ‐33.41] |
| 10 Triglycerides Show forest plot | 8 | 355 | % change from baseline (Fixed, 95% CI) | ‐13.70 [‐16.97, ‐10.43] |
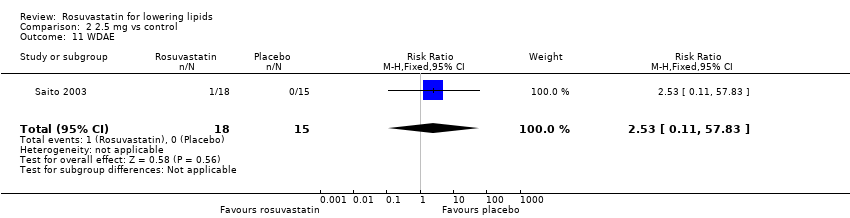
| 11 WDAE Show forest plot | 1 | 33 | Risk Ratio (M‐H, Fixed, 95% CI) | 2.53 [0.11, 57.83] |
| Outcome or subgroup title | No. of studies | No. of participants | Statistical method | Effect size |
| 1 Total cholesterol Show forest plot | 9 | 762 | Mean Difference (IV, Fixed, 95% CI) | ‐29.13 [‐30.56, ‐27.70] |
| 2 LDL‐cholesterol Show forest plot | 9 | 762 | Mean Difference (IV, Fixed, 95% CI) | ‐39.12 [‐41.11, ‐37.12] |
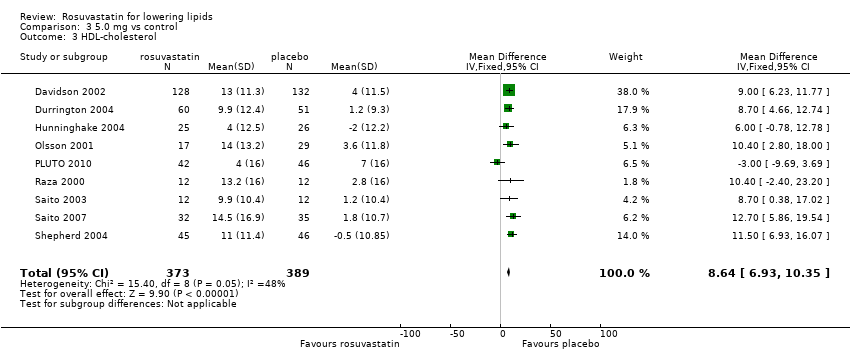
| 3 HDL‐cholesterol Show forest plot | 9 | 762 | Mean Difference (IV, Fixed, 95% CI) | 8.64 [6.93, 10.35] |
| 4 non‐HDL‐cholesterol Show forest plot | 8 | 738 | Mean Difference (IV, Fixed, 95% CI) | ‐36.79 [‐38.85, ‐34.72] |
| 5 Triglycerides Show forest plot | 8 | 674 | Mean Difference (IV, Fixed, 95% CI) | ‐23.08 [‐26.97, ‐19.19] |
| 6 Total cholesterol Show forest plot | 15 | 1411 | % change from baseline (Fixed, 95% CI) | ‐29.11 [‐29.69, ‐28.53] |
| 7 LDL‐cholesterol Show forest plot | 16 | 1840 | % change from baseline (Fixed, 95% CI) | ‐41.57 [‐42.22, ‐40.92] |
| 8 HDL‐cholesterol Show forest plot | 16 | 1845 | % change from baseline (Fixed, 95% CI) | 6.69 [6.04, 7.34] |
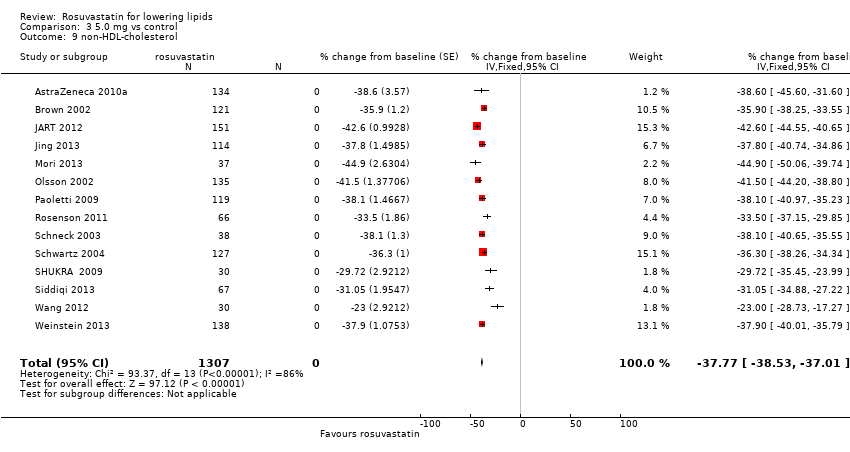
| 9 non‐HDL‐cholesterol Show forest plot | 14 | 1307 | % change from baseline (Fixed, 95% CI) | ‐37.77 [‐38.53, ‐37.01] |
| 10 Triglycerides Show forest plot | 14 | 1678 | % change from baseline (Fixed, 95% CI) | ‐16.96 [‐18.33, ‐15.60] |
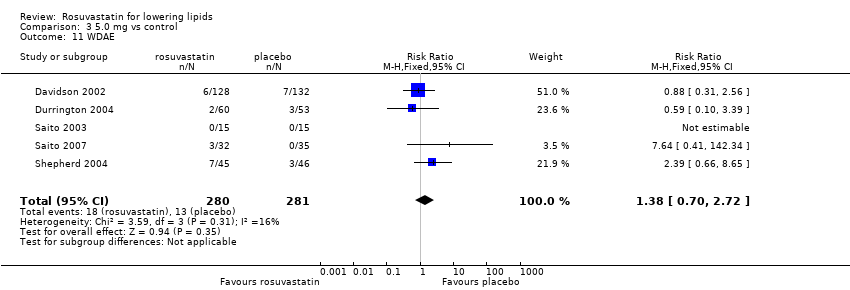
| 11 WDAE Show forest plot | 5 | 561 | Risk Ratio (M‐H, Fixed, 95% CI) | 1.38 [0.70, 2.72] |
| Outcome or subgroup title | No. of studies | No. of participants | Statistical method | Effect size |
| 1 Total cholesterol Show forest plot | 15 | 1442 | Mean Difference (IV, Fixed, 95% CI) | ‐31.34 [‐32.45, ‐30.23] |
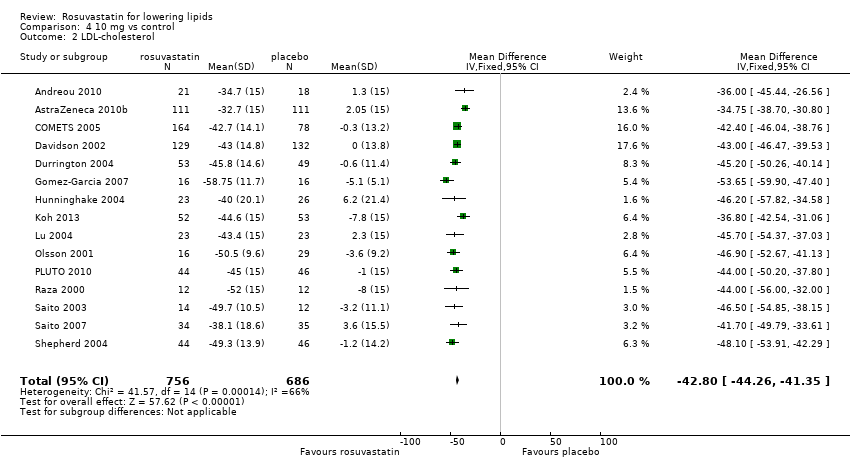
| 2 LDL‐cholesterol Show forest plot | 15 | 1442 | Mean Difference (IV, Fixed, 95% CI) | ‐42.80 [‐44.26, ‐41.35] |
| 3 HDL‐cholesterol Show forest plot | 15 | 1442 | Mean Difference (IV, Fixed, 95% CI) | 10.46 [9.40, 11.52] |
| 4 non‐HDL‐cholesterol Show forest plot | 14 | 1418 | Mean Difference (IV, Fixed, 95% CI) | ‐39.28 [‐40.82, ‐37.74] |
| 5 Triglycerides Show forest plot | 13 | 1313 | Mean Difference (IV, Fixed, 95% CI) | ‐19.97 [‐22.81, ‐17.12] |
| 6 Total cholesterol Show forest plot | 55 | 8100 | % change from baseline (Fixed, 95% CI) | ‐32.89 [‐33.14, ‐32.64] |
| 7 LDL‐cholesterol Show forest plot | 59 | 8413 | % change from baseline (Fixed, 95% CI) | ‐45.77 [‐46.09, ‐45.46] |
| 8 HDL‐cholesterol Show forest plot | 55 | 8085 | % change from baseline (Fixed, 95% CI) | 6.25 [5.93, 6.58] |
| 9 non‐HDL‐cholesterol Show forest plot | 53 | 7405 | % change from baseline (Fixed, 95% CI) | ‐42.06 [‐42.39, ‐41.72] |
| 10 Triglycerides Show forest plot | 51 | 7524 | % change from baseline (Fixed, 95% CI) | ‐19.72 [‐20.38, ‐19.07] |
| 11 WDAE Show forest plot | 6 | 724 | Risk Ratio (M‐H, Fixed, 95% CI) | 0.63 [0.29, 1.39] |
| Outcome or subgroup title | No. of studies | No. of participants | Statistical method | Effect size |
| 1 Total cholesterol Show forest plot | 8 | 576 | Mean Difference (IV, Fixed, 95% CI) | ‐33.58 [‐35.41, ‐31.75] |
| 2 LDL‐cholesterol Show forest plot | 8 | 576 | Mean Difference (IV, Fixed, 95% CI) | ‐45.83 [‐48.22, ‐43.44] |
| 3 HDL‐cholesterol Show forest plot | 8 | 576 | Mean Difference (IV, Fixed, 95% CI) | 6.82 [4.42, 9.21] |
| 4 non‐HDL‐cholesterol Show forest plot | 7 | 552 | Mean Difference (IV, Fixed, 95% CI) | ‐40.67 [‐43.16, ‐38.19] |
| 5 Triglycerides Show forest plot | 7 | 486 | Mean Difference (IV, Fixed, 95% CI) | ‐22.61 [‐27.94, ‐17.28] |
| 6 Total cholesterol Show forest plot | 19 | 2915 | % change from baseline (Fixed, 95% CI) | ‐36.30 [‐36.70, ‐35.90] |
| 7 LDL‐cholesterol Show forest plot | 20 | 3099 | % change from baseline (Fixed, 95% CI) | ‐50.07 [‐50.55, ‐49.58] |
| 8 HDL‐cholesterol Show forest plot | 19 | 2896 | % change from baseline (Fixed, 95% CI) | 8.03 [7.51, 8.55] |
| 9 non‐HDL‐cholesterol Show forest plot | 18 | 2461 | % change from baseline (Fixed, 95% CI) | ‐45.77 [‐46.31, ‐45.24] |
| 10 Triglycerides Show forest plot | 16 | 2367 | % change from baseline (Fixed, 95% CI) | ‐21.65 [‐22.80, ‐20.50] |
| 11 WDAE Show forest plot | 5 | 248 | Risk Ratio (M‐H, Fixed, 95% CI) | 1.06 [0.25, 4.48] |
| Outcome or subgroup title | No. of studies | No. of participants | Statistical method | Effect size |
| 1 Total cholesterol Show forest plot | 4 | 163 | Mean Difference (IV, Fixed, 95% CI) | ‐42.54 [‐45.22, ‐39.86] |
| 2 LDL‐cholesterol Show forest plot | 6 | 472 | Mean Difference (IV, Fixed, 95% CI) | ‐55.85 [‐58.31, ‐53.40] |
| 3 HDL‐cholesterol Show forest plot | 6 | 472 | Mean Difference (IV, Fixed, 95% CI) | 6.85 [4.29, 9.40] |
| 4 non‐HDL‐cholesterol Show forest plot | 3 | 139 | Mean Difference (IV, Fixed, 95% CI) | ‐53.75 [‐58.57, ‐48.94] |
| 5 Triglycerides Show forest plot | 5 | 203 | Mean Difference (IV, Fixed, 95% CI) | ‐31.76 [‐39.40, ‐24.12] |
| 6 Total cholesterol Show forest plot | 11 | 3017 | % change from baseline (Fixed, 95% CI) | ‐40.42 [‐40.83, ‐40.02] |
| 7 LDL‐cholesterol Show forest plot | 11 | 3010 | % change from baseline (Fixed, 95% CI) | ‐54.84 [‐55.35, ‐54.33] |
| 8 HDL‐cholesterol Show forest plot | 11 | 3005 | % change from baseline (Fixed, 95% CI) | 9.90 [9.34, 10.46] |
| 9 non‐HDL‐cholesterol Show forest plot | 11 | 3005 | % change from baseline (Fixed, 95% CI) | ‐50.69 [‐51.22, ‐50.16] |
| 10 Triglycerides Show forest plot | 9 | 2520 | % change from baseline (Fixed, 95% CI) | ‐26.53 [‐27.76, ‐25.29] |
| 11 WDAE Show forest plot | 1 | 29 | Risk Ratio (M‐H, Fixed, 95% CI) | 0.0 [0.0, 0.0] |
| Outcome or subgroup title | No. of studies | No. of participants | Statistical method | Effect size |
| 1 Total cholesterol Show forest plot | 2 | 113 | Mean Difference (IV, Fixed, 95% CI) | ‐44.5 [‐47.84, ‐41.16] |
| 2 LDL‐cholesterol Show forest plot | 2 | 113 | Mean Difference (IV, Fixed, 95% CI) | ‐59.47 [‐64.15, ‐54.79] |
| 3 HDL‐cholesterol Show forest plot | 2 | 113 | Mean Difference (IV, Fixed, 95% CI) | 10.68 [5.92, 15.44] |
| 4 non‐HDL‐cholesterol Show forest plot | 2 | 113 | Mean Difference (IV, Fixed, 95% CI) | ‐55.50 [‐60.70, ‐50.29] |
| 5 Triglycerides Show forest plot | 2 | 113 | Mean Difference (IV, Fixed, 95% CI) | ‐34.49 [‐43.89, ‐25.10] |
| 6 Total cholesterol Show forest plot | 1 | 42 | % change from baseline (Fixed, 95% CI) | ‐43.00 [‐47.16, ‐42.84] |
| 7 LDL‐cholesterol Show forest plot | 1 | 42 | % change from baseline (Fixed, 95% CI) | ‐61.9 [‐64.64, ‐59.16] |
| 8 HDL‐cholesterol Show forest plot | 1 | 42 | % change from baseline (Fixed, 95% CI) | 9.6 [6.27, 12.93] |
| 9 non‐HDL‐cholesterol Show forest plot | 1 | 42 | % change from baseline (Fixed, 95% CI) | ‐57.0 [‐59.55, ‐54.45] |
| 10 Triglycerides Show forest plot | 1 | 42 | % change from baseline (Fixed, 95% CI) | ‐19.7 [‐28.32, ‐11.08] |
| 11 WDAE Show forest plot | 1 | 53 | Risk Ratio (M‐H, Fixed, 95% CI) | 0.48 [0.05, 4.99] |
| Outcome or subgroup title | No. of studies | No. of participants | Statistical method | Effect size |
| 1 WDAEs Show forest plot | 10 | 1330 | Risk Ratio (M‐H, Fixed, 95% CI) | 0.84 [0.48, 1.47] |