Fortification of rice with vitamins and minerals for addressing micronutrient malnutrition
Abstract
This is a protocol for a Cochrane Review (Intervention). The objectives are as follows:
To determine the benefits and harms of rice fortification with vitamins and minerals (iron, vitamin A, zinc or folic acid) on micronutrient status and health‐related outcomes.
Background
Description of the condition
Adequate vitamin and mineral nutrition is required for optimal growth and development of children and for the maintenance of adequate health and nutrition of adult populations. Vitamin and mineral deficiencies may result in conditions such as anaemia, blindness, birth defects, retarded growth, diminished mental development and other poor health outcomes (Howson 1998; Oakley 2004; Darnton‐Hill 2005; A2Z Project 2008). Micronutrient deficiencies have also long been demonstrated to increase the risk of morbidity and, in some cases, mortality especially from infection (Bhaskaram 2002; Singhal 2002; Black 2003). They also significantly and negatively impact on socioeconomic development at the individual, community and national levels (Darnton‐Hill 2005). Iron, vitamin A, iodine and zinc deficiencies constitute the world’s most common micronutrient deficiencies (WHO 2009b).
Iron
Approximately 1.6 billion people are anaemic worldwide (WHO/CDC 2008). Although anaemia can be caused by multiple factors, iron deficiency is estimated to account for up to 50% at least of the anaemia burden, making it the single most widespread nutritional deficiency in the world (Graham 2001; Rastogi 2002; Stoltzfus 2011). Other conditions such as parasitic infections, inherited haemoglobin disorders, or nutritional deficiencies such as of folate or vitamin B12 can also cause anaemia (WHO 2001). Thus, low haemoglobin concentrations are indicators of both poor nutrition and poor health (de Benoist 2008). Before birth and during the first years of life, iron deficiency affects growth, neurodevelopment and cognitive performance (Lozoff 2006; Carter 2010) and may increase susceptibility to infections (Scrimshaw 2010). In adults, iron deficiency and anaemia cause the loss of healthy and productive lives due to their effects on work and physical capacity (Haas 1996). Pregnant women with iron deficiency are at higher risk of suboptimal pregnancy outcomes, including complications at delivery, low birth weight infants and preterm births (Pena‐Rosas 2009).
Vitamin A
Vitamin A deficiency causes xerophthalmia, which leads to night blindness and weakens the immune system thereby increasing the risk of childhood morbidity and mortality (Sommer 1996). Vitamin A deficiency may increase the risk of morbidity and mortality during infancy, pregnancy and in the postpartum period (Sommer 1996; West 1999). It is estimated that vitamin A deficiency results in 18 million disability‐adjusted life years (DALYs) lost, a measure of overall disease burden that is expressed as the number of years lost due to ill‐health, disability or early death (WHO 2002). Vitamin A deficiency occurs mostly after prolonged deprivation of this vitamin (WHO/FAO 2004) and is a significant public health problem in many developing countries, most seriously affecting young children, women of reproductive age and pregnant women. According to recent estimates from the World Health Organization (WHO), 190 million preschool age children (under five years of age) and 19.1 million pregnant women have inadequate concentrations of retinol. Roughly 45% of all preschool age children and pregnant women with vitamin A deficiency live in the WHO regions of Africa and the South‐East Asian regions of South and South East Asia while Sub‐Saharan Africa accounts for another 25% to 35% of cases (WHO 2009a). Vitamin A deficiency alone is responsible for almost 6% of child deaths under the age of five years in Africa and 8% in South‐East Asia (WHO 2009b).
Zinc
Zinc deficiency is considered to be associated with morbidity and mortality in developing countries. Severe zinc deficiency in children may cause short stature, impaired immune function and other disorders, and is a significant cause of respiratory infections, malaria and diarrhoeal disease (WHO 2002). Adequate zinc nutrition is essential for human health because of zinc’s critical structural and functional roles in multiple enzyme systems that are involved in gene expression, cell division and growth, and immunologic and reproductive functions (Hess 2009). Although there is very limited national or first administrative level survey data on the prevalence of zinc deficiency, It has been estimated that zinc deficiency is responsible for approximately 4% of child mortality and DALYs (Black 2008).
Folate
Inadequate periconceptional folate status and folic acid intake are associated with congenital malformations including neural tube defects (IOM 2003). Folic acid is a synthetic form of folate used in supplements and fortified foods (like wheat and maize flour) to reduce the occurrence of neural tube defects (NTDs). These defects include spina bifida (or cleft spine), where there is an opening in one or more of the bones (vertebrae) of the spinal column and anencephaly where the head (cephalic) end of the neural tube fails to close. It has been demonstrated through controlled studies that the risk of neural tube defects can be substantially reduced (risk ratio (RR) 0.28, 95% confidence interval (CI) 0.15 to 0.52) with daily folic acid supplementation (alone or in combination with other vitamins and minerals) (MRC 1991; Czeizel 1992; De‐Regil 2010). The effectiveness of mandatory folic acid fortification in flour programmes has also been documented by a decline in the prevalence of neural tube defects, in the United States, Canada, Costa Rica, Chile and South Africa (Berry 2010).
Other vitamins and minerals
In addition to iron, vitamin A, zinc and folate deficiencies, those of iodine, calcium, vitamin B12 and vitamin D impair health and development. For example, iodine deficiency is a major threat to the health and development of populations worldwide, particularly in preschool children and pregnant women, resulting in goitre, stillbirth and miscarriage, hypothyroidism and impaired growth (Andersson 2012). Vitamin D deficiency (VDD) may be a common health problem worldwide, both in children and adults (Bandeira 2006; Holick 2007). It has been estimated that about 40% to 100% of elderly men and women living in the United States and Europe are deficient in vitamin D (Holick 2007). Calcium and vitamin D deficiency are important causes of rickets and poor bone mineralization in children, while maternal B12 vitamin deficiency may also be associated with adverse pregnancy outcomes and developmental disabilities in infants.
Intervention strategies for micronutrient malnutrition
Current recommended intervention strategies for the prevention and treatment of micronutrient deficiencies include either one or a combination of supplementation, food‐based approaches such as dietary diversification, mass food fortification or point‐of‐use food fortification; other public health control measures include deworming, health and nutrition education (Howson 1998; Zimmermann 2007; WHO 2011a). These strategies can be delivered through at least four platforms, the health systems, agriculture, market‐based, and social protection programs (Olney 2012). Supplementation is still the most widely practiced intervention to control iron (Villar 1997; WHO 2001; WHO 2011b; WHO 2011c; WHO 2011d; WHO 2011e) and vitamin A deficiencies in high‐risk populations (WHO/MI 1998; WHO 2011f).
Some adverse effects observed with high dose supplements as well as the active participation from users may affect compliance and the long‐term sustainability of such programmes. Supplementation programmes can be cost effective (Baltussen 2004; Alderman 2007) but logistical and human resource constraints, such as bad road networks and generally fragile institutions, may hinder their effectiveness especially in developing countries where the intervention is needed most (Zimmermann 2007). In such cases, mass fortification of foods becomes an important option to combat vitamin and mineral deficiencies. There are fewer concerns related to mass food fortification and it can be a complementary intervention to supplementation for efforts to reduce vitamin and mineral deficiencies.
Meeting the recommended dietary intakes (WHO/FAO 2004) through the daily diet is desirable but not always possible for many populations. Poor dietary diversity and dependence on cereal‐based diets, which are common in developing countries, are major contributing factors to the high prevalence of micronutrient deficiencies (Welch 1999). Cereals in addition to being poor sources of vitamins and minerals also contain high quantities of other dietary compounds that decrease the absorption of certain micronutrients, often called 'anti‐nutrients' (Graham 2001). For instance, iron and zinc absorption is significantly inhibited by phytic acid, present in cereals and other grains; polyphenols, contained in red wine and chocolate; or calcium, abundant in dairy products (Gibson 1998; Hurrell 2010; Kim 2011). On this basis, dietary bioavailability of iron has been estimated to be in the range of 14% to 18% for mixed diets and 5% to 12% for vegetarian diets.
Cereals, however, are overwhelmingly the major source of food supplies for direct human consumption. Of the 2.4 billion tonnes of cereals currently produced, roughly 1.1 billion tonnes are destined for food use; around 800 million tonnes (35% of world consumption) are used as animal feed; and the remaining 500 million tonnes are diverted to industrial usage or seed, or are wasted. Despite the consumption falling per capita in China, rice is still the preferred or only available domestic staple in many countries in Asia, providing support for its production. While rice is produced in vast areas of the world, the physical requirements for growing this crop are limited to certain zones. Rice is the primary staple for more than half the world’s population, with Asia representing the largest producing and consuming region. In recent years, rice has also become an important staple throughout Africa (FAO 2012). At the global level, the growth of demand in rice has been tailing off, as evidenced in several large producing and consuming countries of South and East Asia; consumption has shifted to other foodstuffs in line with income growth. Given the importance of these regions in world rice consumption, these declines are reflected in the aggregate trends of the world. About 672 million tonnes of rice (paddy) were harvested in 2010. Rice is the principle staple in Asia, where production is rising in the South but falling in the East (FAO 2012).
Description of the intervention
Fortification is “the addition of one or more essential nutrients to a food, whether or not it is normally contained in the food, for the purpose of preventing or correcting a demonstrated deficiency of one or more nutrients in the general population or specific population groups" (Codex Alimentarius 1994). This process usually takes place during food processing by the food industry at a central level so that it massively reaches the intended population and does not require the active participation of end users. While there are some different definitions for enrichment, for the purposes of this review enrichment and fortification will be used interchangeably.
Results of a study in Vietnamese school children showed that iron fortified rice noodles are efficacious in reducing anaemia and improving haemoglobin and iron status indicators (Huong 2006). In places where rice is a the staple food, iron fortification has been shown to reduce the prevalence of iron‐deficiency anaemia from 100% to 33% among preschool age children (Angeles‐Agdeppa 2008), particularly when there is strong political support and intensive social marketing activities as well as efforts to keep the cost affordable (Angeles‐Agdeppa 2011). Zinc fortification of cereals can boost total zinc consumed daily and absorbed zinc in infants, young children and adults (Brown 2007). Although less frequent, fortification of wheat and maize flours with vitamin A has the technological and biological potential to palliate this deficiency (Klemm 2010). Perhaps the most well known area of micronutrient fortification is that of folic acid, in both wheat and maize flours, and its effect on the prevention of birth defects (WHA 2010). Well conducted studies from several countries have documented decreases of 26% to 42% in the occurrence of neural tube defect (NTD) affected births after implementation of national regulations mandating wheat flour fortification with folic acid (WHO 2009b). Food fortification brings together the benefit of energy, fat and protein, and the complementary roles of vitamins and minerals to enhance the stability and bioavailability of vitamins and minerals used to fortify foods (Best 2011). In addition, this strategy has a dual advantage of reaching a wider and larger proportion of the population than supplementation without requiring radical changes in food consumption patterns (Howson 1998). Based on an analysis of the cost effectiveness of iron supplementation and fortification, it appears that fortification could be less expensive than supplementation irrespective of the geographic coverage of fortification (Baltussen 2004).
Food fortification practices vary nationally. The choice of nutrients (in this context also known as fortificants) varies according to their bioavailability. In the case of iron, for instance, many compounds such as ferrous sulphate, ferrous fumarate, ferric pyrophosphate and electrolytic iron powder can be used in food fortification (WHO/FAO 2006). However, many cereal foods are fortified with low‐cost iron powders with absorption of iron lower than 2% (Hurrell 2010). For vitamin A fortification retinyl palmitate and acetate are frequently used while the synthetic form of folic acid is used to improve folate status.
A concern expressed by a few about food fortification is related to the possible toxicity of excessive vitamins and minerals among all groups, particularly those that are not at risk of deficiencies. This is especially so with iron excess (Gordeuk 1987), which may affect the risk of colonic adenomas and cancer (Knöbel 2006; Muthunayagam 2009) and a potentially more pathogenic gut microbiota that is associated with higher gut inflammation (Zimmermann 2010). Excess and chronic vitamin A intake during pregnancy has been shown to increase the risk of teratogenicity (Rothman 1995) and hip fracture (Penniston 2003). A hypothetical association between the prolonged consumption of folic acid enriched cereals and the increase in the incidence of colorectal cancer in the United States and Canada (Mason 2007) has been challenged with other studies where such an association has not been demonstrated (EFSA 2009). Another concern may relate to the possibility of over‐consumption of rice given the potential benefits of additional vitamins and minerals. As a public health intervention, the use of a vehicle would imply not encouraging the population to consume greater amounts of the 'fortified' rice. Higher consumption of white rice is associated with a significantly increased risk of type 2 diabetes, especially in Asian (Chinese and Japanese) populations (Hu 2012).
Micronutrient deficiencies of public health significance are all widespread in most high rice consuming countries (Juliano 1993; Adamson 2004) and rice fortification has the potential to fill an obvious gap in current nutrition programmes and help aid vulnerable populations that are currently out of reach. A fundamental requirement in the adoption of food fortification as a public health intervention is the selection of the most appropriate and suitable food that will serve as a vehicle for the extra nutrients. It needs to be eaten in large amounts by the target population and be affordable and available all year round (Dexter 1998; WHO/FAO 2006). Although almost all foods can be fortified, cereals are widely grown, produced and consumed in developing countries (Welch 1999), making them important vehicles for fortification. Improving the micronutrient content of cereals or their subproducts could provide a sustainable solution to the worldwide problem of micronutrient deficiencies, particularly in populations where there is a marked social characterization of eating habits (Prattala 2012) and where the fortified foods will be reaching those in need of the vitamins and minerals. Poor children and their mothers systematically lag behind the better‐off in terms of mortality, morbidity and undernutrition. Evaluations of the equity impact of health programmes and nutrition interventions are scarce. There are, however, some results suggesting that innovative approaches can effectively promote equity through, for example, employing appropriate delivery channels; removing financial barriers; and monitoring implementation, coverage and impact with an equity lens. Mandatory fortification of staple foods being consumed by the most vulnerable segments of the populations would potentially provide vitamins and minerals to those in a vulnerable situation (WHO 2010), although it is clear that tackling inequities requires the involvement of various programmes and stakeholders, both within and outside the health sector, that can help address social determinants (WHO 2010).
How the intervention might work
Rice is a globally produced, milled and traded staple food with an annual production and consumption worldwide of about 450 million metric tons. It is the dominant staple food crop of around three billion people worldwide, providing up to 50% to 60% of their daily energy and protein intake (IRRI 2010). Rice is cultivated in almost all parts of the world as it can grow in a wide range of soil and environmental conditions (Juliano 1993). It is estimated that 95% of the world's rice is produced in developing countries, of which 92% takes place in Asia (Juliano 1993). With its popularity, reach and quantum of consumption, rice far exceeds the requirements for adoption as a vehicle for food fortification for the purposes of a population‐level intervention.
Globally, the main rice processing method is milling. The process is aimed at producing a maximum yield of unbroken milled rice compared to flour or meal in other cereals (Dexter 1998). The process involves cleaning the paddy or rough rice (unhulled rice grain) and de‐hulling (removing hull, germ and bran layers) to produce brown rice (Dexter 1998). Brown rice consists of an average weight of 6% to 7% bran, 90% endosperm and 2% to 3% embryo (Saunders 1979). Further milling to remove the bran layer yields white rice. On average, paddy rice produces 25% hulls, 10% bran, and 65% white rice (Chen 1998). In some countries the milled white rice is coated with talc and glucose to improve its appearance (Dexter 1998). The various forms of rice are presented in Table 1. Milled white rice is low in vitamins and minerals as these vitamins (B vitamins) and minerals (iron) are found predominately in the germ and bran layers (Kik 1945; Dexter 1998). Parboiling is one of the ways by which nutrients in the rice grain can be partially preserved. The parboiling process of soaking the rough rice, applying heat, drying and milling results in the transfer of nutrients to the inner endosperm layer from the bran before milling (Dexter 1998). Parboiling is expensive and the end product, referred to as ‘golden colour rice’, may not be readily acceptable to consumers (Dexter 1998).
| Forms of rice | Description of rice |
| Rough rice (paddy rice) | Rice kernels still enclosed in an inedible, protective hull |
| Brown rice | Rice with only the hull removed. Bran layers and rice germ remain, giving the rice a brown colour |
| Parbolied rice | Rice pressurized to gelatinised the starch within the rice kernel, resulting in a firmer,more separate grain that is more stable and less susceptible to overcooking than regular‐milled white rice |
| Regular‐milled white rice (Milled rice) | Polished whole rice, or polished rice. hull, bran layer and germ have all been removed |
| Precooked rice | Regular milled white rice, parboiled milled white rice, and brown rice can be precooked and dehydrated before packaging. Examples of precooked rice are quick‐cooking rice, instant rice, and boil‐in‐the‐bag rice |
| Individually Quick Frozen (IQF) rice | Cooked grains are individually frozen before packaging |
| Crisped/Puffed/Expanded Rice | Kernels can be processed in a number of different ways and shapes to meet particular manufacturing need |
Previous attempts to fortify rice by simply adding a micronutrient powder to the rice that adheres to the grains by electrostatic forces (dusting) have proven unsuccessful (Leon Guerrero 2009) due to the typical washing and cooking methods employed in most developing countries, which results in the rinsing away of the enrichment. Three more sophisticated methods have been developed to overcome this problem (A2Z Project 2008). Coating involves spraying of the surface of ordinary rice grains in several layers with a vitamin and mineral mix to form a protective coating that will not easily rinse off the surface when washed (Kyritsia 2011). The grains (fortified premix) contain high concentrations of vitamin and mineral fortificants and must be blended with natural rice (that is commonly 1 part fortified premix to 199 parts untreated milled rice) to produce fortified rice. The extrusion technology is a totally different concept in rice fortification. In hot extrusion, a dough made of rice flour, vitamin and mineral mix and water is passed through a single or twin screw extruder and shaped into partially precooked grain‐like structures resembling rice grains; that is then blended with natural polished rice at a ratio of about 1:200 to produce fortified rice. This process involves relatively high temperatures (70 to 110 °C) obtained by preconditioning or heat transfer through steam heated barrel jackets, or both. The cold extrusion follows a similar process at low temperature (below 70 °C) that does not primarily utilize any additional heat and produces uncooked, opaque fortified premix grains with a slightly softer consistency. This is then blended with natural polished rice at a ratio of about 1:200 to produce fortified rice.
Rice is a highly culturally sensitive commodity (Hariyadi 2011). Growing, selecting and cooking of rice grains are subject to regional, national and even local preferences. It is estimated that a large proportion of key vitamins and minerals are lost during milling (DSM/Buhler 2010). Additionally, rinsing and washing are common cooking methods which can potentially dissolve added or restored nutrients. There are many different ways of cooking rice. These are i) soaking, and boiling with excess water; ii) boiling in excess water; iii) boiling without excess water; iii) rinsing and boiling without excess water; and iv) frying and boiling without excess water. The use of these cooking preparations could have different retentions of micronutrients in fortified rice kernels as some vitamins are sensitive to heat and others are water‐soluble (WHO/FAO 2006). Cultural preferences for specific types of rice characteristics may represent a barrier to mass fortification in some settings. A technical challenge is to produce fortified rice that resembles natural rice and resists normal meal preparation and cooking processes.
A study conducted as far back as 1948 in the Philippines demonstrated the effects of rice fortification in the prevention of beri‐beri (Salcedo 1950). In Brazil, a bioavailability trial with vitamin A fortified rice showed an improvement in children's retinol levels (Flores 1994). Another study among young children from 6 to 24 months of age in Brazil found that rice fortified with micronized iron pyrophosphate was more effective than iron drops in decreasing anaemia from 100% to 62% and iron deficiency from 69% to 25% and improving iron status (Beinner 2010). In a study in India, fortified rice in school age children attending school showed a reduction of iron deficiency anaemia from 78% at baseline to 25% in the iron group (Moretti 2006). In another setting, the feeding of rice fortified with microencapsulated, micronized iron pyrophosphate to improve the iron status of women in Mexico showed significant increases in plasma ferritin concentrations and estimated body iron stores as well as a significant decrease in plasma transferrin receptor concentrations. Fortified rice reduced the prevalence of anaemia by 80% and iron deficiency by 29% in Mexican women working in a factory (Hotz 2008).
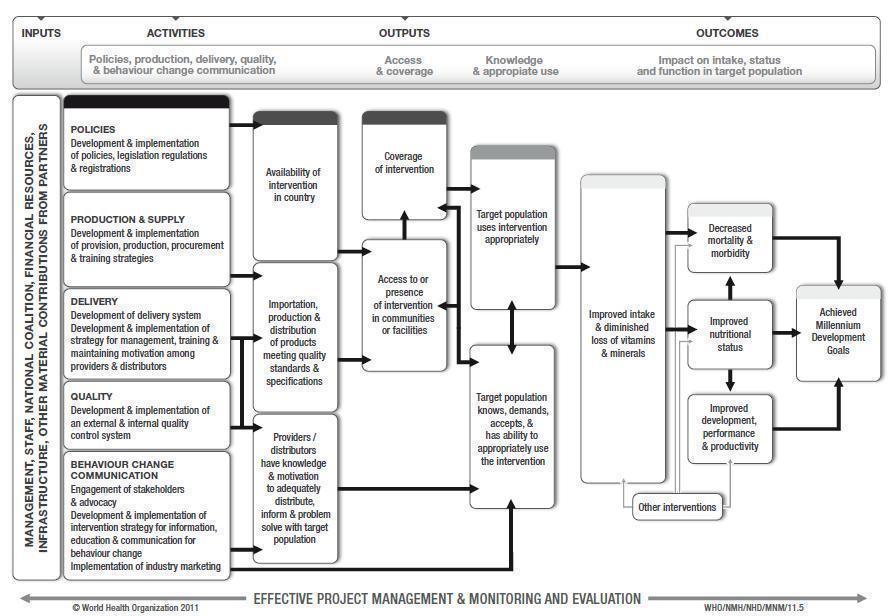
This proposed review will attempt to evaluate, based on existing research, the effectiveness of rice fortification as a public health intervention. The WHO/CDC logic model for micronutrient interventions in public health depicts the programme theory and plausible relationships between inputs and expected improvements in Millenium Development Goals (MDGs) and can be adapted to different contexts (WHO/CDC 2011). The effectiveness of rice fortification in public health depends on several factors related to policies and legislation regulations; production and supply of the fortified rice; the development of delivery systems for the fortified rice; the development and implementation of external and internal food quality control systems; and the development and implementation of strategies for information, education and communication for behaviour change among consumers. A generic logic model for micronutrient interventions that depicts these processes and outcomes is presented in Figure 1.

WHO/CDC logic model for micronutrients interventions in public health (with permission from WHO)
Why it is important to do this review
Vitamin and mineral deficiencies are important public health concerns worldwide. Among the options to address these deficiencies, mass fortification represents an appealing intervention as it takes advantage of the existing market and delivery systems, does not require the active participation of vulnerable populations to increase foods intake or diversify the diet, and has few safety concerns. Rice represents a suitable vehicle for fortification as it is considered a staple food in most of the world, especially in regions where micronutrient deficiencies are most evident.
Wheat and maize flour fortification with iron alone, or in combination with folic acid and other micronutrients, has been implemented in more than 50 countries (CDC 2008; WHO 2009b) and is showing promising results in reducing anaemia and neural tube defects. Based on this experience, an increasing number of countries across the world are rapidly adopting fortification of rice as a means to fight malnutrition. Mandatory fortification of rice has been adopted in some countries, such as the Philippines, Costa Rica, Papua and Nicaragua (GAIN 2010). Fortified rice is sold in China using a multi‐micronutrient formula and in Japan enriched rice has been on the market since 1981. The United States has a mandatory food standard for 'enriched rice', prescribing levels of thiamin, niacin, riboflavin, folic acid and iron to be added to rice for enrichment. Although this requirement only applies in order for rice to be labelled as 'enriched; (FDA 2001), 70% of the rice eaten in that country is enriched or fortified (American Rice Inc. 2004; A2Z Project 2008). In India, Brazil and Colombia, fortified rice is currently being distributed through public safety net programs.
Despite this interest, to date there has been no systematic assessment of the benefits and harms of this intervention to inform policy making and assist countries in the design and implementation of appropriate food fortification programmes.
Objectives
To determine the benefits and harms of rice fortification with vitamins and minerals (iron, vitamin A, zinc or folic acid) on micronutrient status and health‐related outcomes.
Methods
Criteria for considering studies for this review
Types of studies
We will include randomized controlled trials. Such trials would provide information on whether fortified rice is effective and can actually achieve changes in health and vitamin and mineral status for those receiving the intervention.
Food fortification is however an intervention that aims at reaching the entire population of a country or large sections of the population and is frequently delivered through the market system. We anticipate, therefore, that we will not be able to assess the benefits and risks of rice fortification only by including randomised trials; thus, in addition, we plan to examine data from other study designs.
In summary, we will include the following study designs.
-
Randomized controlled trials, with randomization at either the individual or cluster level.
-
Quasi‐randomized controlled trials (where allocation of treatment has been made, for example, by alternate allocation, date of birth, alphabetical order, etc).
-
Non‐randomized controlled trials.
-
Observational studies that are prospective and report a kind of control group:
-
cohort studies (prospective and retrospective);
-
controlled before and after studies;
-
interrupted time series with at least three measure points both before and after the intervention (ITS).
-
Results from controlled non‐randomised and observational study designs will be analysed separately from randomized and quasi‐randomized study designs.
In addition to the above‐mentioned study designs, before and after studies without a control group will be considered for inclusion in this review. Results from these studies will be presented in a table but will not be included in a meta‐analysis and will not directly inform the conclusions of the review. Such studies may provide information on the implementation, feasibility and other contextual factors relating to the interventions under review. We will not include cross‐over trials.
Types of participants
General population of all age groups (including pregnant women) from any country. Studies of interventions targeted toward participants with a critical illness or severe co‐morbidities will be excluded.
Types of interventions
Interventions to be included in the review are those in which rice has been fortified with at least one micronutrient or a combination of several micronutrients (iron, folic acid, zinc, vitamin A or other vitamins and minerals) irrespective of the method of fortification technology used. Fortified rice, for the purposes of this review, refers to the addition of a micronutrients premix to ordinary rice using any rice fortification technologies, such as hot extrusion, cold extrusion, coating or dusting (A2Z Project 2008). Studies with co‐interventions, that is fortified rice with education, will only be included if the comparison group also receives the education component in addition to the unfortified rice.
Comparisons to be made include the following.
-
Rice fortified with iron alone or in combination with other micronutrients versus unfortified rice (no micronutrients added).
-
Rice fortified with iron alone or in combination with other micronutrients versus no intervention.
-
Rice fortified with vitamin A alone or in combination with other micronutrients versus unfortified rice (no micronutrients added).
-
Rice fortified with vitamin A alone or in combination with other micronutrients versus no intervention.
-
Rice fortified with zinc alone or in combination with other micronutrients versus unfortified rice (no micronutrients added).
-
Rice fortified with zinc alone or in combination with other micronutrients versus no intervention.
-
Rice fortified with folic acid alone or in combination with other micronutrients versus unfortified rice (no micronutrients added).
-
Rice fortified with folic acid alone or in combination with other micronutrients versus no intervention.
If trials are examining the effects of two or more nutrients they may be included in multiple comparisons.
Studies comparing rice fortification with other forms of micronutrient interventions (that is supplementation or dietary diversification) or the fortification of other food vehicles) will be excluded. In vitro studies and those examining the effect of biofortified rice (nutrient‐dense staple crops of rice using the conventional breeding practices and modern biotechnology) will also be excluded.
Types of outcome measures
Primary outcomes
The primary outcomes to be considered across all populations in this review are the presence of anaemia, iron deficiency and haemoglobin concentrations. Additional primary outcomes of interest differ by participant group, therefore all have been listed below by participant group.
Children (2 to 11.9 years of age)
-
Anaemia (defined as haemoglobin (Hb) below 110 g/L, adjusted for altitude as appropriate)
-
Iron deficiency (as defined by trialists, based on a biomarker of iron status)
-
Haemoglobin concentration (g/L)
-
Diarrhoea (three liquid stools in a single day)
-
Respiratory infections (as measured by trialists)
-
All‐cause death
-
Serum or plasma folate (nmol/L)
Adolescent girls and boys (12 to 18.9 years of age)
-
Anaemia (defined as Hb below 115 g/L or 120 g/L, adjusted for altitude and smoking as appropriate)
-
Iron deficiency (as defined by trialists, based on a biomarker of iron status)
-
Haemoglobin concentration (g/L)
-
Vitamin A deficiency (as defined by trialists, by using a biomarker)
-
Serum or plasma folate (in nmol/L)
Pregnant women
-
Anaemia (defined as Hb below 110 g/L at any trimester of pregnancy, adjusted for altitude and smoking as appropriate)
-
Iron deficiency (as defined by trialists, based on a biomarker of iron status)
-
Haemoglobin concentration (in g/L)
-
Congenital anomalies (neural tube defect, cleft lip, cleft palate, congenital cardiovascular defects and others as reported by trialists)
-
Night blindness (defined as the reported inability to see after dusk by people who typically report having normal vision during the day)
-
Miscarriage
-
Serum or plasma folate (in nmol/L)
Adult males and females (19 years of age or older)
-
Anaemia (defined as Hb below 115 g/L or 120 g/L, adjusted for altitude and smoking as appropriate)
-
Iron deficiency (as defined by trialists, based on a biomarker of iron status)
-
Haemoglobin concentration (in g/L)
-
Serum/plasma folate (in nmol/L)
-
Vitamin A deficiency (as defined by trialists, by using a biomarker)
Secondary outcomes
Secondary outcomes will include the following.
-
Serum or plasma retinol (µmol/L).
-
Serum or plasma zinc (µmol/L).
-
Anthropometric measures (height‐for‐age Z‐score and weight‐for‐height Z‐score for children, body mass index (BMI) for adults).
-
Risk of iron overload (defined by serum ferritin higher than 150 µg/L in females and higher than 200 µg/L in men).
-
Clinical malarial (as defined by trialists).
-
Severe malaria (as defined by trialists).
-
Adverse side effects (including constipation, nausea, vomiting, heartburn).
For those studies in which the intervention is delivered at the first administrative level or higher (likely to be the studies pre‐post without a control group) we will examine the same variables but at an ecological level (for example prevalence of anaemia or birth defects rates).
Search methods for identification of studies
Electronic searches
We will search the following international and regional sources.
International databases
-
MEDLINE
-
MEDLINE (R) In Process
-
Web of Science (both the social science citation index and the science citation index)
-
Cochrane Central Register of Controlled Trials (CENTRAL)
-
EMBASE
-
CINAHL
-
POPLINE
-
AGRICOLA (http://agricola.nal.usda.gov/)
-
BIOSIS
-
Food Science and Technology Abstracts (FSTA)
Regional databases
-
IBECS (http://plip.eifl.net/negotiations/free‐e‐resources/spanish/ibecs‐indice‐bibliogra)
-
Scielo (http://www.scielo.br/)
-
Global Index Medicus ‐ AFRO (includes African Index Medicus); EMRO (includes Index Medicus for the Eastern Mediterranean Region)
-
LILACS
-
PAHO (Pan American Health library)
-
WHOLIS (WHO Library)
-
WPRO (includes Western Pacific Region Index Medicus)
-
IMSEAR (Index Medicus for the South‐East Asian Region)
-
IndMED, Indian medical journals (http://indmed.nic.in/)
-
Native Health Research Database (http://hsc.unm.edu/library/nhd)
For theses we will search WorldCat, Networked Digital Library of Theses and Dissertations, DART‐Europe E‐theses Portal, Australasian Digital Theses Program, Theses Canada Portal and ProQuest‐Desertations and Theses.
We will handsearch the five journals with the highest number of included studies in the last 12 months to capture any article that may not have been indexed in the databases at the time of the search. As rice fortification technologies are relatively novel we will limit the search, from 1960 to present, for all databases.
We will also contact the Trials Search Co‐ordinator of the Cochrane Public Health Group to search the Cochrane Public Health Group Specialised Register. The search will use keyword and controlled vocabulary (when available), using the search terms set out in the Appendices and adapting them as appropriate for each database.
The international clinical trials registry platform (ICTRP) will be searched for any ongoing or planned trials and authors of such studies will be contacted to obtain further information or eligible data, if available.
We will not apply any language restrictions. If we identify articles written in a language other than English, we will commission their translation into English. If this is not possible, we will seek advice from the Cochrane Public Health Group. We will store such articles in the 'Awaiting assessment' section of the review until a translation is available.
Searching other resources
For assistance in identifying ongoing or unpublished studies, we will also contact the Department of Nutrition for Health and Development and regional offices of the World Health Organization (WHO), the nutrition section of the United Nations Children's Fund (UNICEF), the World Food Programme (WFP), the US Centers for Disease Control and Prevention (CDC), US Agency for International Development (USAID) micronutrient programme, Micronutrient Initiative (MI), the Global Alliance for Improved Nutrition (GAIN), Hellen Keller International (HKI), Sight and Life Foundation, PATH, the Wright Group, premix producers DSM and BASF, and the Rice Fortification Resource Group (RIFORG).
Data collection and analysis
Selection of studies
The titles and abstracts of articles retrieved by each search will be screened independently by two review authors to assess eligibility, as determined by the inclusion and exclusion criteria listed above. Full copies of all eligible papers will be retrieved. When a title or abstract cannot be rejected with certainty, the full text of the article will be obtained for further evaluation. If full articles cannot be obtained, we will attempt to contact the authors to obtain further details of the study. Failing this, studies will be classified as 'awaiting assessment' until further information is published or made available to us. Disagreements at any stage of the eligibility assessment process will be resolved through discussion and consultation with a third author, where necessary.
Data extraction and management
Data will be independently extracted by two review authors using data extraction forms based on those from the Cochrane Public Health Group (Cochrane PHG 2010) and the Cochrane Effective Practice and Organisation of Care (EPOC) Group.
All review authors will be involved in piloting the form using a subset of articles in order to enhance consistency amongst reviewers; based on this, the form will be modified if necessary. We will collect information on study design, study setting, participants (number and characteristics) and provide a full description of the interventions examined. Details of outcomes measured (including a description of how and when outcomes were measured) and results will be extracted.
The form will be designed so that we are able to record results for our prespecified outcomes as well as for other (non‐specified) outcomes (although such outcomes will not underpin any of our conclusions). Additional items relating to study recruitment and the implementation of the intervention will also be extracted, including number of sites for an intervention, whether recruitment was similar at different sites, levels of compliance and use of condiments in different sites within studies, resources required for implementation, and whether a process evaluation was conducted. The PROGRESS (place, race, occupation, gender, religion, education, SES, social status) checklist will be used to collect whether or not outcome data have been reported by socio‐demographic characteristics known to be important from an equity perspective. We will also record whether or not studies included specific strategies to address diversity or disadvantage.
Data will be entered into Review Manager (RevMan) software (Revman 2011) and will be checked for accuracy.
Assessment of risk of bias in included studies
The EPOC 'RIsk of bias' tool for studies with a separate control group will be used to assess the risk of bias of all studies.This includes five domains of bias: selection, performance, attrition, detection and reporting; as well as an 'other bias' category to capture other potential threats to validity.
Two review authors will independently assess risk of bias for each study and any disagreement will be resolved by discussion or by involving an additional review team member.
Assessing risk of bias in randomised trials and quasi‐randomised trials
(1) Sequence generation (checking for possible selection bias)
Studies will be assessed as:
-
low risk of bias if there is a random component in the sequence generation process (e.g. random number table; computer random number generator);
-
high risk of bias if a non‐random approach has been used (e.g. odd or even date of birth; hospital or clinic record number). Non‐randomised studies should be scored 'high';
-
unclear risk of bias if not specified in the paper.
(2) Allocation concealment (checking for possible selection bias)
Studies will be assessed as:
-
low risk of bias if participants and investigators enrolling participants could not foresee assignment because an appropriate method was used to conceal allocation (e.g. telephone or central randomization; consecutively numbered sealed opaque envelopes). This rating will be given to studies where the unit of allocation was by institution and allocation was performed on all units at the start of the study;
-
high risk of bias if participants of investigators enrolling participants could possibly foresee assignments and potentially introduce selection bias (e.g. open random allocation; unsealed or non‐opaque envelopes);
-
unclear.
(3) Similarity of baseline outcome measurements (checking for confounding, a potential consequence of selection bias)
Studies will be assessed as:
-
low risk of bias if outcomes were measured prior to the intervention, and no important differences were present across intervention groups;
-
high risk of bias if important differences in outcomes between groups were present prior to intervention and were not adjusted for in the analysis;
-
unclear risk of bias if there was no baseline measure of outcome (note: if 'high' or 'unclear' but there is sufficient information to do an adjusted analysis, the assessment should be 'low').
(4) Similarity of baseline characteristics (checking for confounding, a potential consequence of selection bias)
Studies will be assessed as:
-
low risk of bias if baseline characteristics are reported and similar across intervention groups;
-
high risk of bias if baseline characteristics are not reported or if there are differences across groups;
-
unclear risk of bias if it is not clear (e.g. characteristics mentioned in text but no data presented).
(5) Incomplete outcome data (checking for possible attrition bias through withdrawals, dropouts and protocol deviations)
Outcomes in each included study will be assessed as:
-
low risk of bias due to incomplete outcome data, which could be either that there were no missing outcome data or the missing outcome data were unlikely to bias the results based on the following considerations: study authors provided transparent documentation of participant flow throughout the study, the proportion of missing data was similar in the intervention and control groups, the reasons for missing data were provided and balanced across the intervention and control groups, the reasons for missing data were not likely to bias the results (e.g. moving house).
-
high risk of bias if missing outcome data was likely to bias the results. Studies will also receive this rating if an 'as‐treated' (per protocol) analysis is performed with substantial differences between the intervention received and that assigned at randomisation, or if potentially inappropriate methods for imputation have been used;
-
unclear risk of bias.
(6) Blinding (checking for possible performance and detection bias)
The risk of performance bias associated with blinding will be assessed as:
-
low, high or unclear risk of bias for participants;
-
low, high or unclear risk of bias for personnel.
The risk of detection bias associated with blinding will be assessed as:
-
low, high or unclear risk of bias for outcome assessors.
Whilst assessed separately, we will combine the results in a single evaluation of risk of bias associated with blinding as follows:
-
low risk of bias if there was blinding of participants and key study personnel and it was unlikely to have been broken, or the outcomes are objective. This rating will also be given to studies where either participants and key study personnel were not blinded but outcome assessment was blinded and the non‐blinding of others was unlikely to introduce bias;
-
high risk of bias if there was no blinding or incomplete blinding or if there was blinding that was likely to have been broken and the outcome or outcome assessment was likely to be influenced by a lack of blinding;
-
unclear risk of bias.
(7) Contamination (checking for possible performance bias)
Studies will be assessed as:
-
low risk of bias if allocation was by community, institution or practice and it is unlikely that the control group received the intervention;
-
high risk of bias if it is likely that the control group received the intervention;
-
unclear risk of bias if it is possible that contamination occurred but the risk of this happening is not clear.
(8) Selective reporting bias
Studies will be assessed as:
-
low risk of bias if it is clear, either by availability of the study protocol or otherwise, that all prespecified outcomes that are of interest in the review have been reported;
-
high risk of bias if it is clear that not all of the study's prespecified outcomes have been reported, or reported outcomes were not prespecified (unless justification for reporting is provided), or outcomes of interest are reported incompletely and cannot be used, or where one or more of the primary outcomes is reported using measurements or analysis methods that were not prespecified, or finally if the study report fails to include an important outcome that would be expected to have been reported;
-
unclear risk of bias.
(9) Other sources of bias
Other possible sources of bias will be described for each included study and a rating of low, high or unclear risk of bias will be given for this item.
The risk of bias for interrupted time series (ITS) studies will be assessed using the EPOC 'Risk of bias' tool for ITS study designs, which includes items (5), (6), (8) and (9) from the EPOC 'Risk of bias' tool above as well as the following additional items.
-
Was the intervention independent of other changes?
-
Low risk of bias if there are compelling arguments that the intervention occurred independently of other changes over time and the outcome was not influenced by other confounding variables or historic events during the study period.
-
High risk of bias if it is reported that the intervention was not independent of other changes in time.
-
Unclear risk of bias.
-
-
Was the shape of the intervention effect prespecified?
-
Low risk of bias if the point of analysis is the point of intervention or a rational explanation for the shape of the intervention effect was provided.
-
HIgh risk of bias if it clear that these conditions were not met.
-
Unclear risk of bias.
-
-
Was the intervention unlikely to affect data collection?
-
Low risk of bias if it is reported that the intervention itself was unlikely to affect data collection (e.g. sources and methods of data collection were the same before and after the intervention).
-
High risk of bias if the intervention itself was likely to affect data collection.
-
Unclear risk of bias.
-
Overall risk of bias
For all included studies, the overall risk of bias will be summarised by important outcome within each study. Studies at high risk of bias will be those with high or unclear risk of bias in the following domains: allocation concealment, similarity of baseline outcome measurements, and incomplete outcome data. Judgements will also take into account the likely magnitude and direction of bias and whether it is likely to impact on the findings of the study.
Measures of treatment effect
For dichotomous outcomes, proportions will be presented and, for two‐group comparisons, results will be presented as average risk ratio or odds ratio with 95% confidence interval.
Results for continuous outcomes will be reported as the mean difference with 95% confidence interval if outcomes are measured in the same way between trials. Where some studies have reported endpoint data and others have reported changes from baseline data (with errors) we will combine these in the meta‐analysis if the outcomes have been reported using the same scale.
We will use standardised mean difference with 95% confidence interval to combine trials that measure the same outcome (for example haemoglobin) but use different methods.
Unit of analysis issues
Cluster‐randomised trials
We will combine results from both cluster and individually randomized studies if there is little heterogeneity between the studies. If the authors of cluster‐randomized trials have conducted their analyses at a different level to that of allocation, and they have not appropriately accounted for the cluster design in their analyses, we will calculate trials' effective sample sizes to account for the effect of clustering in data. We will utilise the intra‐cluster correlation coefficient (ICC) derived from the trial (if available) or from another source (for example using the ICCs derived from other, similar trials) and then calculate the design effect with the formula provided in the Cochrane Handbook for Systematic Reviews of Interventions (Higgins 2011). If this approach is used, we will report this and undertake sensitivity analysis to investigate the effect of variations in ICC.
Studies with more than two treatment groups
If we identify studies with more than two intervention groups (multi‐arm studies), where possible we will combine groups to create a single pair‐wise comparison or use the methods set out in the Cochrane Handbook to avoid double counting study participants (Higgins 2011). If the control group is shared by two or more study arms, we will divide the control group over the number of relevant subgroup categories to avoid double counting the participants (for dichotomous data, we will divide the events and the total population while for continuous data we will assume the same mean and standard deviation but will divide the total population). The details will be described in the 'Characteristics of included studies' tables.
Dealing with missing data
Missing outcome data and levels of attrition for included studies will be noted on the data extraction form. We will explore the impact of including studies with high levels of missing data in the overall assessment of treatment effect by using sensitivity analysis.
For all outcomes, we will carry out analyses, as far as possible, on an intention‐to‐treat basis, that is include all participants randomized to each group in the analyses, and analyse in the group to which they were allocated regardless of whether or not they received the allocated intervention. The denominator for each outcome in each trial will be the number randomized minus any participants whose outcomes are known to be missing.
For missing summary data, we will contact lead study authors for clarification or, if possible, we will estimate missing summary data using other statistical information (for example confidence intervals, standard errors) provided in the primary paper and impute the standard deviation either from other studies in the same systematic review or from studies in another systematic review.
Assessment of heterogeneity
We will examine forest plots from a meta‐analysis to visually determine the level of heterogeneity (in terms of the size or direction of treatment effect ) between studies. We will use T², I² and Chi² statistics to quantify the level of heterogeneity among the trials in each analysis. We will regard substantial or considerable heterogeneity as T² > 0 and either I² > 30% or a low P value (< 0.10) in the Chi² test. We will note this in the text and explore it using prespecified subgroup analyses mentioned below. Caution will be taken in the interpretation of those results with high levels of unexplained heterogeneity.
Assessment of reporting biases
Where we suspect reporting bias (see 'Selective reporting bias' above) we will attempt to contact study authors asking them to provide missing outcome data. Where this is not possible, and the missing data are thought to introduce serious bias, the impact of including such studies in the overall assessment of results will be explored by a sensitivity analysis.
We do not anticipate that there will be sufficient studies contributing data for any particular outcome for us to examine possible publication bias; if more than 10 studies reporting the same outcome of interest are available, we will generate funnel plots in Revman 2011 and visually examine them for asymmetry. Where we pool studies in a meta‐analysis we will order studies in terms of weight so that a visual examination of forest plots may allow us to assess whether the results from smaller and larger studies are similar or if there are any apparent differences according to study size.
Data synthesis
We will carry out a meta‐analysis to provide an overall estimate of treatment effect when more than one study examines the same intervention, provided that studies use similar methods and measure the same outcome in similar ways in similar populations. We will use a random‐effects model meta‐analysis for combining data as we anticipate that there may be natural heterogeneity between studies attributable to the different doses, durations, populations, and implementation or delivery strategies. For continuous variables we will use the inverse variance method while for dichotomous variables we will use the one proposed by Mantel‐Haenzel.
For non‐randomized studies, where results have been adjusted to take account of possible confounding factors, we will use the generic inverse variance method in Revman 2011 to carry out any meta‐analysis (If both adjusted and non‐adjusted figures are provided we will carry out a sensitivity analysis using the unadjusted figures to examine any possible impact on the estimate of treatment effect).
We will not combine results from randomized and non‐randomized trials together in a meta‐analysis, nor will we present pooled estimates for non‐randomized studies with different types of study design. Evidence on different outcomes may be available from different types of studies (for example, it is likely that data on less common adverse events will be reported in larger, non‐randomized studies).
The main findings of the review will be set out in summary of findings (SoF) tables prepared using GRADE profiler software (GRADEpro 2008). The primary outcomes for each comparison will be listed with estimates of relative effects along with the number of participants and studies contributing data for those outcomes. For each individual outcome or group of similar outcomes (if appropriate to be combined), the quality of the evidence will be assessed using the GRADE approach (Balshem 2010). This involves consideration of within‐study risk of bias (study limitations), directness of evidence, heterogeneity, precision of effect estimates and risk of publication bias and results in one out of four levels of quality (high, moderate, low or very low).
Narrative synthesis, guided by the data extraction form in terms of the ways in which studies may be grouped and summarised, will also be used in this review to describe the outcomes, explore intervention processes, and describe the impact of interventions by socio‐demographic characteristics known to be important from an equity perspective based on the PROGRESS framework, where this information is available.
Subgroup analysis and investigation of heterogeneity
Subgroup analyses will be conducted, if possible, to explore heterogeneity according to the following subgroups.
-
Micronutrient content: single nutrient versus two or more nutrients.
-
Rice fortification method: hot extrusion versus cold extrusion versus coating versus dusting.
-
Cooking method most commonly used in trial setting (as reported): soaking, and boiling with excess water versus boiling in excess water versus boiling without excess water versus rinsing and boiling without excess water versus frying and boiling without excess water.
-
Public health significance of anaemia at baseline in the target group: not a problem (lower than 5%) versus mild and moderate (5% to 29.9% versus severe (40% and more).
-
Prevalence of stunting in children under five years in the study site: moderate (number of children whose height for age Z‐score is between ‐2.0 and 2.99 SD below the mean) versus severe stunting (number of children whose height for age Z‐score is less than ‐3.0 standard deviations (SD) below the mean).
-
Iron compound: highest bioavailable (e.g. NaFeEDTA) versus moderately bioavailable (e.g. ferrous sulphate) versus lowest bioavailability (e.g. elemental iron).
-
Malaria endemicity at the time that the trial was conducted: malaria setting versus non or unknown malaria setting.
We will examine differences between subgroups by visual inspection of the confidence intervals; non‐overlapping confidence intervals suggesting a statistically significant difference in treatment effect between the subgroups. We will also use the approach of Borenstein 2008 to formally investigate differences between two or more subgroups. Analyses will be conducted in Revman version 5.1.1 (Revman 2011). We will limit this analysis to those outcomes for which three or more trials contributed data.
Sensitivity analysis
We will carry out sensitivity analysis to examine the effects of removing studies at high risk of bias (those with high or unclear risk of bias for allocation concealment, similarity of baseline outcome measurements, incomplete outcome data) from the meta‐analysis. If cluster trials are included we will carry out sensitivity analysis using a range of intra‐cluster correlation values.
WHO/CDC logic model for micronutrients interventions in public health (with permission from WHO)
| Forms of rice | Description of rice |
| Rough rice (paddy rice) | Rice kernels still enclosed in an inedible, protective hull |
| Brown rice | Rice with only the hull removed. Bran layers and rice germ remain, giving the rice a brown colour |
| Parbolied rice | Rice pressurized to gelatinised the starch within the rice kernel, resulting in a firmer,more separate grain that is more stable and less susceptible to overcooking than regular‐milled white rice |
| Regular‐milled white rice (Milled rice) | Polished whole rice, or polished rice. hull, bran layer and germ have all been removed |
| Precooked rice | Regular milled white rice, parboiled milled white rice, and brown rice can be precooked and dehydrated before packaging. Examples of precooked rice are quick‐cooking rice, instant rice, and boil‐in‐the‐bag rice |
| Individually Quick Frozen (IQF) rice | Cooked grains are individually frozen before packaging |
| Crisped/Puffed/Expanded Rice | Kernels can be processed in a number of different ways and shapes to meet particular manufacturing need |