Enriquecimiento del arroz con vitaminas y minerales para tratar la malnutrición relacionada con los micronutrientes
Resumen
Antecedentes
El enriquecimiento del arroz con vitaminas y minerales tiene el potencial de aumentar la nutrición en los países consumidores de arroz donde existen deficiencias de micronutrientes. A nivel mundial, se consumen 490 000 000 de toneladas métricas de arroz por año. Es el principal cultivo alimentario básico de alrededor de 3 000 millones de personas.
Objetivos
Determinar los efectos beneficiosos y perjudiciales del enriquecimiento del arroz con vitaminas y minerales (hierro, vitamina A, zinc o ácido fólico) sobre el estado de micronutrientes y los resultados relacionados con la salud en la población general.
Métodos de búsqueda
Se hicieron búsquedas en CENTRAL, MEDLINE, Embase, CINAHL y en otras 16 bases de datos hasta el 10 de diciembre de 2018. Se hicieron búsquedas en ClinicalTrials.gov y en la International Clinical Trials Registry Platform (ICTRP) de la Organización Mundial de la Salud el 10 de diciembre de 2018.
Criterios de selección
Se incluyeron ensayos aleatorizados y cuasialeatorizados (con asignación al azar individual o grupal) y estudios controlados de tipo antes y después. Los participantes eran poblaciones de más de dos años de edad (incluidas las mujeres embarazadas) de cualquier país. La intervención incluyó arroz enriquecido con al menos un micronutriente o una combinación de varios micronutrientes (hierro, ácido fólico, zinc, vitamina A u otras vitaminas y minerales) en comparación con arroz no enriquecido o ninguna intervención.
Obtención y análisis de los datos
Se utilizaron los procedimientos metodológicos estándar previstos por Cochrane. Dos autores de la revisión seleccionaron los estudios y extrajeron los datos de forma independiente.
Resultados principales
Se incluyeron 17 estudios (10 483 participantes) y se identificaron dos estudios en curso. Doce estudios incluidos eran ensayos controlados aleatorizados (ECA), con 2238 participantes después del ajuste para el agrupamiento en dos ECA grupales, y cinco eran estudios no aleatorizados (ENA) con cuatro estudios controlados de tipo antes y después y un estudio transversal con un control (8245 participantes). Se realizaron cuatro estudios en la India, tres en Tailandia, dos en Filipinas, dos en Brasil, uno en Bangladesh, uno en Burundi, uno en Camboya, uno en Indonesia, uno en México y uno en los Estados Unidos. Dos estudios incluyeron a mujeres no embarazadas y que no amamantaban y diez incluyeron a niños en edad preescolar o escolar.
Los 17 estudios informaron del enriquecimiento con hierro. De estos estudios, seis solo realizaron el enriquecimiento del arroz con hierro; 11 estudios agregaron otros micronutrientes (hierro, zinc y vitamina A, y ácido fólico). Un estudio tuvo un brazo de vitamina A sola y uno de carotenoide solo. El contenido de hierro elemental osciló entre 0,2 y 112,8 mg/100 g de arroz crudo administrado durante un período que varió de dos semanas a 48 meses.
Trece estudios no describieron con claridad la generación de la secuencia ni la ocultación de la asignación. Once estudios tuvieron una tasa baja de deserción. No hubo indicios de informe selectivo en los estudios. Se consideraron dos ECA como en riesgo general bajo de sesgo y diez como en riesgo general alto de sesgo. Un ECA estuvo en riesgo alto o incierto de sesgo para la mayoría de los dominios. Todos los estudios controlados de tipo antes y después tuvieron un riesgo alto o un riesgo incierto de sesgo en la mayoría de los dominios. Los estudios incluidos fueron financiados por organizaciones gubernamentales, privadas y no gubernamentales, junto con otras instituciones académicas. La fuente de financiamiento no parece haber modificado los resultados. Se utilizaron los ENA en la síntesis cualitativa, pero se excluyeron del análisis cuantitativo y de las conclusiones de la revisión, debido a que proporcionaron principalmente información contextual e información cuantitativa limitada.
Arroz enriquecido con hierro solo o combinado con otros micronutrientes frente al arroz no enriquecido (sin agregado de micronutrientes)
El enriquecimiento del arroz con hierro (solo o en combinación con otros micronutrientes) puede lograr poca o ninguna diferencia en el riesgo de padecer anemia (cociente de riesgos [CR] 0,72; intervalo de confianza [IC] del 95%: 0,54 a 0,97; I2 = 74%; 7 estudios, 1634 participantes; evidencia de certeza baja) y puede reducir el riesgo de deficiencia de hierro (CR 0,66; IC del 95%: 0,51 a 0,84; 8 estudios, 1733 participantes; evidencia de certeza baja). El enriquecimiento del arroz puede aumentar el nivel medio de hemoglobina (diferencia de medias [DM] 1,83; IC del 95%: 0,66 a 3,00; I2 = 54%; 11 estudios, 2163 participantes; evidencia de certeza baja) y puede lograr poca o ninguna diferencia en la deficiencia de vitamina A (con vitamina A como uno de los micronutrientes en el brazo de enriquecimiento) (CR 0,68; IC del 95%: 0,36 a 1,29; I2 = 37%; 4 estudios, 927 participantes; evidencia de certeza baja). Un estudio informó que el enriquecimiento del arroz (con ácido fólico como uno de los micronutrientes) puede mejorar el nivel sérico o plasmático de folato (nmol/L) (DM 4,30; IC del 95%: 2,00 a 6,60; 215 participantes; evidencia de certeza baja). Un estudio informó que el enriquecimiento del arroz con hierro solo o con otros micronutrientes puede aumentar ligeramente la infección por anquilostomas (CR 1,78; IC del 95%: 1,18 a 2,70; 785 participantes; evidencia de certeza baja). No se conoce con certeza el efecto del arroz enriquecido sobre la diarrea (CR 3,52; IC del 95%: 0,18 a 67,39; 1 estudio, 258 participantes; evidencia de certeza muy baja).
Arroz enriquecido con vitamina A sola o en combinación con otros micronutrientes frente al arroz no enriquecido (sin agregado de micronutrientes)
Un estudio tuvo un brazo que proporcionó arroz enriquecido con vitamina A solamente frente al arroz no enriquecido. El enriquecimiento del arroz con vitamina A (en combinación con otros micronutrientes) puede aumentar el nivel medio de hemoglobina (DM 10,00; IC del 95%: 8,79 a 11,21; un estudio, 74 participantes; evidencia de certeza baja). El arroz fortificado con vitamina A puede mejorar ligeramente la concentración de retinol sérico (DM 0,17; IC del 95%: 0,13 a 0,21; un estudio, 74 participantes; evidencia de certeza baja).
Ningún estudio aportó datos para las comparaciones del enriquecimiento del arroz frente a ninguna intervención. Los estudios que incluyeron ácido fólico y zinc también incluyeron hierro en los brazos de enriquecimiento y, por lo tanto, se informaron como parte de la primera comparación.
Conclusiones de los autores
El enriquecimiento del arroz con hierro solo o en combinación con otros micronutrientes puede lograr poca o ninguna diferencia en el riesgo de padecer anemia o presentar deficiencia de hierro y no se sabe con certeza si se producirá un aumento de las concentraciones medias de hemoglobina en la población general de más de dos años de edad. El enriquecimiento del arroz con hierro y otros micronutrientes como la vitamina A o el ácido fólico puede lograr poca o ninguna diferencia en el riesgo de presentar deficiencia de vitamina A o en la concentración sérica de folato. Existe evidencia limitada sobre cualquier efecto adverso del enriquecimiento del arroz.
PICO
Resumen en términos sencillos
Enriquecimiento del arroz con vitaminas y minerales para tratar la malnutrición relacionada con los micronutrientes
¿Cuál es el objetivo de esta revisión?
El objetivo de esta revisión Cochrane fue evaluar si el enriquecimiento del arroz con una o más vitaminas y minerales en la población general a partir de los dos años de edad mejora el estado nutricional.
Mensajes clave
El enriquecimiento del arroz con hierro solo o en combinación con otros micronutrientes puede dar lugar a poca o ninguna diferencia en el riesgo de padecer anemia, aunque probablemente reduce el riesgo de deficiencia de hierro y aumenta las concentraciones medias de hemoglobina en la población a partir de los dos años de edad. Si se agrega vitamina A, puede reducir el riesgo de presentar deficiencia de vitamina A y cuando se agrega ácido fólico, el arroz enriquecido puede aumentar ligeramente las concentraciones séricas de folato.
¿Qué se estudió en esta revisión?
La malnutrición relacionada con los micronutrientes compromete la salud y el bienestar de las poblaciones de muchos países de ingresos bajos y medios. El enriquecimiento es el agregado de nutrientes a los alimentos para mejorar su calidad nutricional. El arroz se consume ampliamente como alimento básico y es adecuado para su adopción como vehículo alimentario para el enriquecimiento. Esta revisión considera los efectos beneficiosos y perjudiciales del enriquecimiento del arroz con vitaminas y minerales sobre el estado de los micronutrientes, junto con los resultados relacionados con la salud, en participantes a partir de los dos años de edad, además de los resultados pertinentes a las deficiencias de hierro, vitamina A, zinc y folato.
¿Cuáles son los principales resultados de la revisión?
Se identificaron 17 estudios (con 10 483 participantes) de Bangladesh, Brasil, Burundi, Camboya, India, Indonesia, México, Filipinas, Tailandia y los EE.UU. Doce eran estudios aleatorizados (2238 participantes); diez incluían a niños y dos estudios incluían a mujeres no embarazadas y que no amamantaban. Además del hierro, algunos estudios incluían vitamina A, zinc o ácido fólico como agentes fortificantes, solos o en combinación. Se evaluaron cinco estudios no aleatorizados (8245 participantes) para aumentar la información sobre la implementación y la repercusión del enriquecimiento. Los estudios incluidos fueron financiados por organizaciones gubernamentales, privadas y no gubernamentales, junto con otras instituciones académicas. La fuente de financiamiento no parece haber modificado los resultados.
No se sabe con certeza si el enriquecimiento del arroz con hierro y otros micronutrientes reduce el riesgo de anemia, aunque esta intervención puede aumentar las concentraciones medias de hemoglobina (un biomarcador de la anemia). No se sabe si el enriquecimiento del arroz con hierro solo o en combinación con otros micronutrientes, en comparación con el arroz no enriquecido, reduce el riesgo de deficiencia de hierro.
Además, el consumo de vitamina A en el arroz enriquecido puede lograr poca diferencia en las concentraciones séricas de hemoglobina y retinol (un biomarcador de la nutrición relacionada con la vitamina A). No se sabe si el enriquecimiento del arroz tiene algún efecto adverso, a plazo medio o a largo plazo, debido a que la evidencia fue muy limitada. Se encontró que la certeza general de la evidencia varió de muy baja a baja. Además, todos los estudios utilizaron hierro para fortificar el arroz, por lo que el efecto de los nutrientes aislados puede estar oculto. No hubo sesgo de publicación significativo entre los estudios.
¿Cuál es el grado de actualización de esta revisión?
Los autores de la revisión buscaron estudios que se habían publicado hasta el 10 de diciembre de 2018.
Conclusiones de los autores
Summary of findings
| Rice fortified with iron alone or in combination with other micronutrients compared to unfortified rice (no micronutrients added) for addressing micronutrient malnutrition | ||||||
| Patient or population: general population older than 2 years of age (including pregnant women) from any country | ||||||
| Outcomes | Anticipated absolute effects* (95% CI) | Relative effect | № of participants | Certainty of the evidence | Comments | |
| Risk with unfortified rice (no micronutrients added) | Risk with rice fortified with iron alone or in combination with other micronutrients | |||||
| Anaemia (defined as haemoglobin below the WHO cut‐off, adjusted for altitude as appropriate) | Study population | RR 0.72 (0.54 to 0.97) | 1634 (7 RCTs) | ⊕⊕⊝⊝ Low1 | Included studies: Angeles‐Agdeppa 2008; Hardinsyah 2016; Hotz 2008; Parker 2015 (C); Perignon 2016 (C); Radhika 2011; Thankachan 2012 | |
| 388 per 1000 | 279 per 1000 | |||||
| Iron deficiency (as defined by study authors, based on a biomarker of iron status) | Study population | RR 0.66 (0.51 to 0.84) | 1733 | ⊕⊕⊝⊝ | Included studies: Angeles‐Agdeppa 2008; Hardinsyah 2016; Hotz 2008; Moretti 2006b; Perignon 2016 (C); Pinkaew 2013; Radhika 2011; Thankachan 2012 | |
| 228 per 1000 | 150 per 1000 | |||||
| Haemoglobin concentration (in g/L) | The mean haemoglobin concentration (g/L) in the intervention groups was 1.83 higher (0.66 to 3.00 higher) | ‐ | 2163 | ⊕⊕⊝⊝ | Included studies: Angeles‐Agdeppa 2008; Hardinsyah 2016; Hotz 2008; Hussain 2014; Losso 2017; Moretti 2006b; Parker 2015 (C); Perignon 2016 (C); Pinkaew 2013; Radhika 2011; Thankachan 2012 | |
| Vitamin A deficiency (as defined by the study authors) | Study population | RR 0.68 (0.36 to 1.29) | 927 (4 RCTs) | ⊕⊕⊝⊝ | Included studies: Hardinsyah 2016; Perignon 2016 (C); Pinkaew 2014; Thankachan 2012 | |
| 105 per 1000 | 71 per 1000 (38 to 135) | |||||
| Serum or plasma folate (nmol/L) | The mean serum or plasma folate (nmol/L) in the intervention group was 4.30 higher (2.00 to 6.60 higher) | ‐ | 215 (1 RCT) | ⊕⊕⊝⊝ | Included study: Hardinsyah 2016 | |
| Any adverse effects (hookworm infection risk) | Study population | RR 1.78 | 785 | ⊕⊕⊝⊝ | Included study: Perignon 2016 (C) | |
| 119 per 1000 | 211 per 1000 | |||||
| Diarrhoea (as defined by study authors) | Study population | RR 3.52 | 258 | ⊕⊝⊝⊝ | Included study: Thankachan 2012 | |
| 0 per 1000 | 0 per 1000 | |||||
| *The risk in the intervention group (and its 95% confidence interval) is based on the assumed risk in the comparison group and the relative effect of the intervention (and its 95% CI). | ||||||
| GRADE Working Group grades of evidence | ||||||
| 1Downgraded 2 levels: one for serious limitations in study design or execution (risk of bias) and one for indirectness. The baseline characteristics were not similar in all groups and the method of randomisation was unclear in half of the studies. Also studies used different cut‐off levels of haemoglobin to define anaemia. Hardinsyah 2016; Parker 2015 (C); Perignon 2016 (C); Radhika 2011 used WHO cut‐off levels, Hotz 2008 used CDC criteria and Angeles‐Agdeppa 2008 and Thankachan 2012 did not name the criteria they used. | ||||||
| Rice fortified with vitamin A alone or in combination with other micronutrients compared to unfortified rice (no micronutrients added) for addressing micronutrient malnutrition | |||||
| Patient or population: general population older than 2 years of age (including pregnant women) from any country | |||||
| Outcomes | Anticipated absolute effects* (95% CI) | Relative effect | № of participants | Certainty of the evidence | Comments |
| Risk with rice fortified with vitamin A alone or in combination with other micronutrients | |||||
| Haemoglobin concentration (g/L) | MD 10 higher | ‐ | 74 | ⊕⊕⊕⊝ | Included study: Hussain 2014 |
| Serum or plasma retinol (µmol/L) | MD 0.17 higher | ‐ | 74 | ⊕⊕⊕⊝ | Included study: Hussain 2014 |
| *The risk in the intervention group (and its 95% confidence interval) is based on the assumed risk in the comparison group and the relative effect of the intervention (and its 95% CI). | |||||
| GRADE Working Group grades of evidence | |||||
| 1Downgraded by 2 levels: one level for risk of bias and one level for indirectness. The only study was carried out in India with a small sample size (250 children aged 5‐8 years) attending a school with a subsidised lunch feeding programme (Hussain 2014). | |||||
Antecedentes
Descripción de la afección
Se requiere una nutrición adecuada de vitaminas y minerales para el crecimiento y desarrollo óptimos de los niños y para el mantenimiento de una salud y una nutrición adecuadas en la población adulta. Las deficiencias de vitaminas y minerales pueden provocar afecciones como anemia, ceguera, defectos congénitos, retraso en el crecimiento, disminución del desarrollo mental y otros problemas de salud (Howson 1998; Oakley 2004; Darnton‐Hill 2005; A2Z Project 2008). También se ha demostrado desde hace tiempo que las deficiencias de micronutrientes aumentan el riesgo de morbilidad y, en algunos casos, de mortalidad, en especial a causa de infecciones (Bhaskaram 2002; Singhal 2002; Black 2003). También tienen un impacto significativo y negativo en el desarrollo socioeconómico a nivel individual, comunitario y nacional (Darnton‐Hill 2005). Las deficiencias de hierro, vitamina A, yodo y zinc constituyen las deficiencias de micronutrientes más comunes a nivel mundial (OMS 2009b).
Hierro
La Organización Mundial de la Salud (OMS) estima que aproximadamente 1 600 millones de personas sufren anemia en todo el mundo y que la mitad son mujeres y niños menores de cinco años de edad (OMS 2015a). Se calcula que en 2016 el 41,7% de los niños, el 40% de las mujeres embarazadas y el 32,5% de las mujeres no embarazadas presentaban anemia (Stevens 2013; OMS 2015a; OMS 2019). Aunque la anemia puede ser causada por múltiples factores, se estima que la deficiencia de hierro representa al menos hasta un 50% de la carga de anemia, lo que la convierte en la deficiencia nutricional más generalizada en el mundo (Graham 2001; Rastogi 2002; Stoltzfus 2011). Otras afecciones como las infecciones parasitarias, los trastornos hereditarios relacionados con la hemoglobina o las deficiencias nutricionales como las de folato o vitamina B12 también pueden causar anemia (OMS 2017). Por lo tanto, las concentraciones bajas de hemoglobina son indicadores tanto de una nutrición deficiente como de enfermedades (OMS 2011a). Antes del nacimiento y durante los primeros años de vida, la deficiencia de hierro afecta el crecimiento, el neurodesarrollo y el rendimiento cognitivo (Lozoff 2006; Carter 2010), y puede aumentar la susceptibilidad a las infecciones (Scrimshaw 2010). En los adultos, la deficiencia de hierro y la anemia causan la pérdida de la vida sana y productiva debido a sus efectos sobre el trabajo y la capacidad física (Haas 1996). Las mujeres embarazadas con deficiencia de hierro presentan un mayor riesgo de resultados subóptimos en el embarazo, que incluyen complicaciones durante el parto, recién nacidos con bajo peso al nacer y partos prematuros (Peña‐Rosas 2015).
Vitamina A
La deficiencia de vitamina A causa xeroftalmia, que provoca ceguera nocturna y debilita el sistema inmunológico, lo que aumenta el riesgo de morbilidad y mortalidad infantil (Sommer 1996). La deficiencia de vitamina A puede aumentar el riesgo de morbilidad y mortalidad durante la infancia, el embarazo y el puerperio (Sommer 1996; West 1999). Se calcula que la deficiencia de vitamina A provoca la pérdida de 18 000 000 de años de vida ajustados en función de la discapacidad (AVAD), una medida de la carga total de la enfermedad que se expresa como el número de años perdidos debido a la enfermedad, la discapacidad o la muerte prematura (OMS 2002). La deficiencia de vitamina A ocurre principalmente después de la privación prolongada de esta vitamina (OMS/FAO 2004) y es un problema significativo de salud pública en muchos países de ingresos bajos y medios que afecta más seriamente a los niños pequeños, a las mujeres en edad fecunda y a las embarazadas. Según las estimaciones recientes, 190 000 000 de niños en edad preescolar (menores de cinco años) y 19 100 000 de mujeres embarazadas tienen concentraciones inadecuadas de retinol. Aproximadamente el 45% de todos los niños en edad preescolar y de las mujeres embarazadas con deficiencia de vitamina A viven en las regiones de la OMS de Asia sudoriental, mientras que África representa otro 30% de los casos (OMS 2009b). Un análisis de las tendencias de la deficiencia de vitamina A mostró una disminución de la prevalencia general del 39% al 29% entre 1991 y 2013; aunque África y la zona sur de Asia presentaron la menor disminución (Stevens 2015). La deficiencia de vitamina A por sí sola es responsable de casi el 6% de las muertes de niños menores de cinco años de edad en África y el 8% en Asia sudoriental (OMS 2009a). Se calculó que en 2013 el 1,7% de todas las muertes de niños menores de cinco años eran atribuibles a la deficiencia de vitamina A (Stevens 2015).
Zinc
Se considera que la deficiencia de zinc está asociada con morbilidad y mortalidad en los países de ingresos bajos y medios. La deficiencia grave de zinc en los niños puede causar baja estatura, alteración de la función inmunitaria y otros trastornos, y es una causa importante de infecciones respiratorias, paludismo y enfermedades diarreicas (OMS 2002). Una nutrición adecuada de zinc es esencial para la salud humana debido a los roles estructurales y funcionales críticos del zinc en múltiples sistemas enzimáticos que están involucrados en la expresión génica, la división y el crecimiento celular, y las funciones inmunológicas y reproductivas (Hess 2009). Aunque hay muy pocos datos de encuestas nacionales o de primer nivel administrativo sobre la prevalencia de la deficiencia de zinc, se ha estimado que la deficiencia de zinc es responsable de aproximadamente el 4% de la mortalidad infantil y de los AVAD (Black 2008). Se calcula que el 17,3% de la población mundial está en riesgo de una ingesta inadecuada de zinc. La prevalencia regional estimada de la ingesta inadecuada de zinc osciló entre el 7,5% en las regiones de ingresos altos y el 30% en la zona sur de Asia. Estas prevalencias nacionales específicas de la ingesta inadecuada de zinc se calcularon sobre la base del contenido estimado de zinc absorbible del suministro nacional de alimentos (Wessells 2012).
Folato
La ingesta inadecuada es una causa principal de deficiencia e insuficiencia de folato en la población, aunque el aumento de las necesidades derivadas del embarazo o de enfermedades neoplásicas, las enfermedades relacionadas con una mala absorción, el uso de fármacos antifolato u otros inhibidores metabólicos también pueden causar deficiencia de folato (Bailey 2015). El estado periconcepcional inadecuado de folato y la ingesta inadecuada de ácido fólico están asociados con malformaciones congénitas, que incluyen defectos del tubo neural (IOM 2003). El ácido fólico es una forma sintética de folato utilizado en los suplementos y los alimentos fortificados (como trigo y harina de maíz) para reducir la aparición de los defectos del tubo neural (DTN). Estos defectos incluyen: espina bífida (o columna hendida), donde hay una abertura en uno o más de los huesos (vértebras) de la columna y anencefalia, donde el extremo cefálico del tubo neural no logra cerrarse. Se ha demostrado mediante estudios controlados que el riesgo de defectos del tubo neural puede reducirse de manera considerable (cociente de riesgos [CR] 0,31; intervalo de confianza [IC] del 95%: 0,17 a 0,58; 5 estudios, 6708 partos; evidencia de certeza alta) con la administración de suplementos diarios de ácido fólico, solos o en combinación con otras vitaminas y minerales (De‐Regil 2015). La efectividad de los programas de enriquecimiento obligatorio de la harina de trigo con ácido fólico también ha sido documentada mediante una disminución en la prevalencia de defectos del tubo neural en los Estados Unidos, Canadá, Costa Rica, Chile y Sudáfrica (Berry 2010). En general, las poblaciones de bajo estatus socioeconómico no consumen suficientes alimentos con alto contenido de folato, y aunque sus dietas pueden ser adecuadas en cuanto a la ingesta de folato para prevenir la deficiencia clínica (es decir, la anemia megaloblástica), pueden ser insuficientes para alcanzar las concentraciones de folato de los glóbulos rojos asociadas con una salud y un desarrollo fetal óptimos (es decir, la mayor reducción del riesgo de DTN) en las mujeres en edad reproductiva, es decir, concentraciones por encima de 400 ng/mL (906 nmol/L) (OMS 2015b).
Otras vitaminas y minerales
Además de las deficiencias de hierro, vitamina A, zinc y folato, las de yodo, calcio, vitamina B12 y vitamina D perjudican la salud y el desarrollo. Por ejemplo, la deficiencia de yodo es una amenaza importante para la salud y el desarrollo de las poblaciones de todo el mundo, en especial en los niños en edad preescolar y las mujeres embarazadas, que da lugar a bocio, mortinatos y abortos espontáneos, hipotiroidismo y deterioro del crecimiento (Andersson 2012). La deficiencia de vitamina D (definida como concentración baja de 25‐hidroxivitamina D en suero) puede ser un problema de salud común en todo el mundo (Bandeira 2006; Palacios 2014). Una revisión reciente encontró una proporción importante de recién nacidos, niños, adolescentes, adultos y personas mayores que viven en diferentes países con concentraciones séricas bajas de vitamina D (Palacios 2014). Estas concentraciones bajas se observaron en todos los grupos etarios, pero en particular en niñas y mujeres de Oriente Medio. La deficiencia de vitamina D y las perturbaciones del metabolismo de la vitamina D; un consumo crónico muy bajo de calcio o una combinación de deficiencia de vitamina D y consumo crónico bajo de calcio, pueden causar raquitismo nutricional. El raquitismo se asocia principalmente con una ingesta muy baja de calcio en los niños mayores mientras que en los adolescentes, los estudios sugieren que el raquitismo nutricional se asocia más con la deficiencia de vitamina D (Munns 2016).
Estrategias de intervención para tratar la malnutrición relacionada con los micronutrientes
Las estrategias de intervención actuales recomendadas para la prevención y el tratamiento de las deficiencias de micronutrientes incluyen la administración de un suplemento o una combinación, enfoques basados en los alimentos, como la diversificación de la dieta, el enriquecimiento masivo de los alimentos o el enriquecimiento de los alimentos en el punto de consumo; otras medidas de control de la salud pública incluyen la eliminación de parásitos y la educación sanitaria y nutricional (Howson 1998; Zimmermann 2007; OMS 2011c). Estas estrategias pueden administrarse a través de al menos cuatro plataformas: los sistemas de salud, la agricultura, los programas basados en el mercado y los programas de protección social (Olney 2012). La administración de suplementos sigue siendo la intervención practicada más ampliamente para controlar el hierro (OMS 2011b; OMS 2011d; OMS 2016) y las deficiencias de vitamina A en las poblaciones de alto riesgo (OMS 2011e).
Algunos efectos adversos observados con los suplementos de dosis altas, así como la participación activa de los usuarios, pueden afectar el cumplimiento y la sostenibilidad a largo plazo de dichos programas. Los programas de administración de suplementos (Baltussen 2004; Alderman 2007), por lo general se enfrentan a limitaciones logísticas y de recursos humanos, como las redes de carreteras deficientes y las instituciones generalmente frágiles, que pueden obstaculizar su efectividad, en especial en los países de ingresos bajos y medios donde más se necesita la intervención (Zimmermann 2007). En dichos casos, el enriquecimiento masivo de los alimentos básicos se convierte en una opción importante para combatir las deficiencias de vitaminas y minerales. Hay menos preocupación relacionada con el enriquecimiento masivo de los alimentos y puede ser una intervención complementaria a la administración de suplementos relacionada con los esfuerzos para reducir las deficiencias de vitaminas y minerales.
La posibilidad de cumplir con la ingesta alimentaria recomendada (OMS/FAO 2004), a través de la dieta diaria es deseable pero no siempre posible para muchas poblaciones. La diversidad alimentaria deficiente y la dependencia de las dietas basadas en cereales, que son comunes en los países de ingresos bajos y medios, son los principales factores que contribuyen a la alta prevalencia de las deficiencias de micronutrientes (Welch 1999). Los cereales, además de ser fuentes escasas de vitaminas y minerales, también contienen grandes cantidades de otros compuestos alimentarios, como los fitatos, que disminuyen la absorción de determinados micronutrientes, a menudo llamados "antinutrientes" (Graham 2001). Por ejemplo, la absorción de hierro y zinc es inhibida de manera significativa por el ácido fítico, presente en los cereales y otros granos; los polifenoles, contenidos en el vino tinto y el chocolate; o el calcio, abundante en los productos lácteos (Gibson 1998; Hurrell 2010; Kim 2011). Sobre esta base, se ha calculado que la biodisponibilidad alimentaria del hierro oscila entre el 14% y el 18% para las dietas mixtas y entre el 5% y el 12% para las vegetarianas.
Sin embargo, los cereales son, en su inmensa mayoría, la principal fuente de suministro de alimentos para el consumo humano directo. En 2014 se produjeron alrededor de 2 500 millones de toneladas de cereales, de las cuales aproximadamente 1 100 millones de toneladas (43%) se utilizaron como alimentos; alrededor de 900 000 000 de toneladas (35%) se utilizaron como piensos para animales y los 500 000 000 de toneladas restantes se desviaron para uso industrial o para semillas, o fueron desperdiciados (FAO 2016). Mientras que el arroz se produce en vastas áreas del mundo, los requerimientos físicos para producir este cultivo se limitan a determinadas zonas. El arroz es el principal alimento básico para más de la mitad de la población mundial. La producción y el consumo son mayores en Asia (Muthayya 2014), y en los últimos años, también se ha convertido en un alimento básico importante en África (FAO 2012). En 2014 se cosecharon alrededor de 741 000 000 de toneladas de arroz (arroz con cáscara) (FAOSTAT 2016). El equivalente de arroz molido producido es de 490 000 000 de toneladas (FAO 2016).
Descripción de la intervención
El enriquecimiento se definió como "el agregado de uno o más nutrientes esenciales a un alimento, esté o no normalmente contenido en el alimento, con el fin de prevenir o corregir una deficiencia demostrada de uno o más nutrientes en la población general o en grupos específicos de la población" (Codex Alimentarius 1994). Este proceso suele tener lugar durante el procesamiento de los alimentos por parte de la industria alimentaria a nivel central, de modo que llegue masivamente a la población destinataria y no requiera la participación activa de los usuarios finales. Aunque hay algunas definiciones diferentes para el enriquecimiento, para los propósitos de esta revisión, se utilizará fortificación y enriquecimiento indistintamente.
Los resultados de un estudio en escolares vietnamitas mostraron que los fideos de arroz enriquecidos con hierro son eficaces para reducir la anemia y mejorar la hemoglobina y los indicadores del estado del hierro (Huong 2006). En los lugares donde el arroz es un alimento básico, se ha demostrado que el enriquecimiento con hierro reduce la prevalencia de la anemia por deficiencia de hierro del 100% al 33% entre los niños en edad preescolar (Angeles‐Agdeppa 2008), especialmente cuando hay un fuerte apoyo político y actividades intensivas de comercialización social, así como esfuerzos para mantener un coste asequible (Angeles‐Agdeppa 2011). El enriquecimiento de los cereales con zinc puede aumentar el total de zinc consumido diariamente y el zinc absorbido en los lactantes, los niños pequeños y los adultos (Brown 2007). Aunque es menos frecuente, el enriquecimiento de las harinas de trigo y maíz con vitamina A tiene el potencial tecnológico y biológico de paliar esta deficiencia (Klemm 2010). Quizás el área más conocida del enriquecimiento con micronutrientes es la del ácido fólico, tanto en las harinas de trigo como de maíz, y su efecto en la prevención de defectos congénitos (WHA 2010). Hay estudios bien realizados en varios países que documentaron disminuciones del 26% al 42% en la ocurrencia de nacimientos afectados por defectos del tubo neural (DTN) después de la implementación de regulaciones nacionales que obligan a enriquecer la harina de trigo con ácido fólico (OMS 2009b). El enriquecimiento de los alimentos reúne los beneficios de la energía, las grasas y las proteínas, y las funciones complementarias de las vitaminas y los minerales para mejorar la estabilidad y la biodisponibilidad de las vitaminas y los minerales utilizados para enriquecer los alimentos (Best 2011). Además, esta estrategia tiene la ventaja doble de llegar a una proporción cada vez mayor de la población que la administración de suplementos sin requerir cambios radicales en los patrones de consumo de alimentos (Howson 1998).
Las prácticas de enriquecimiento de alimentos varían a nivel nacional. La elección de los nutrientes (en este contexto también conocidos como fortificantes) varía en función de su biodisponibilidad. En el caso del hierro, por ejemplo, pueden utilizarse muchos compuestos como el sulfato ferroso, el fumarato ferroso, el pirofosfato férrico y el polvo de hierro electrolítico, en el enriquecimiento de los alimentos (OMS/FAO 2006). Sin embargo, muchos alimentos a base de cereales son fortificados con polvos de hierro de bajo costo con una absorción del hierro inferior al 2% (Hurrell 2010). Para el enriquecimiento con vitamina A, el palmitato y el acetato de retinol se utilizan con frecuencia, mientras que la forma sintética del ácido fólico se utiliza para mejorar el estado de folato.
Una preocupación expresada por algunas personas sobre el enriquecimiento de los alimentos está relacionada con la posible toxicidad causada por el exceso de vitaminas y minerales entre todos los grupos, particularmente los que no están en riesgo de sufrir deficiencias (García‐Casal 2019). Lo anterior se observa especialmente con el exceso de hierro (Gordeuk 1987), que puede afectar el riesgo de adenomas colónicos y cáncer (Muthunayagam 2009), y una microbiota intestinal potencialmente más patógena que se asocia con una mayor inflamación intestinal (Zimmermann 2010). Se ha demostrado que el consumo excesivo y crónico de vitamina A durante el embarazo aumenta el riesgo de teratogenicidad (Rothman 1995) y fractura de cadera (Penniston 2003). La asociación hipotética entre el consumo prolongado de cereales fortificados con ácido fólico y el aumento de la incidencia del cáncer colorrectal en los EE.UU. y Canadá (Mason 2007), ha sido cuestionada con otros estudios en los que no se ha demostrado dicha asociación (EFSA 2009). Otra preocupación puede estar relacionada con la posibilidad de un consumo excesivo de arroz, a causa de los beneficios potenciales de las vitaminas y minerales adicionales. Como intervención de salud pública, el uso de un vehículo no implicaría alentar a la población a consumir mayores cantidades de arroz "enriquecido". El mayor consumo de arroz blanco se asocia con un riesgo significativamente mayor de diabetes tipo 2 especialmente en poblaciones asiáticas (chinas y japonesas) (Hu 2012).
Las deficiencias de micronutrientes de importancia para la salud pública son muy generalizadas en la mayoría de los países que consumen mucho arroz (Juliano 1993; MIcronutrient Initiative/UNICEF 2004), y el enriquecimiento del arroz tiene el potencial de cubrir la brecha evidente en los programas de nutrición actuales y de ayudar a las poblaciones vulnerables que actualmente están fuera de alcance. Un requisito fundamental para adoptar el enriquecimiento de alimentos como una intervención de salud pública es la selección de los alimentos más apropiados y adecuados para que sirvan como un vehículo para los nutrientes. Debe ser consumido en grandes cantidades por la población destinataria y ser asequible y estar disponible durante todo el año (Dexter 1998; OMS/FAO 2006). Aunque casi todos los alimentos pueden ser enriquecidos, los cereales se cultivan, producen y consumen ampliamente en países de ingresos bajos y medios (Welch 1999), lo que los convierte en importantes vehículos para el enriquecimiento. La mejoría del contenido de micronutrientes de los cereales o de sus subproductos podría proporcionar una solución sostenible al problema mundial de las deficiencias de micronutrientes, en especial en poblaciones en las que existe una marcada caracterización social de los hábitos alimentarios (Prättälä 2012), y en las que los alimentos enriquecidos llegarán a los que necesitan las vitaminas y los minerales. Los niños pobres y sus madres quedan sistemáticamente rezagados con respecto a los de mejor situación económica en términos de mortalidad, morbilidad y desnutrición. Las evaluaciones del impacto en la equidad de los programas de salud y las intervenciones de nutrición son escasas. Sin embargo, hay algunos resultados que sugieren que los enfoques innovadores pueden promover de forma efectiva la equidad mediante, por ejemplo, el empleo de canales de distribución adecuados, la eliminación de las barreras financieras y la vigilancia de la implementación, la cobertura y el impacto con una perspectiva de equidad. El enriquecimiento obligatorio de los alimentos básicos que consumen los segmentos más vulnerables de la población podría proporcionar vitaminas y minerales a quienes se encuentran en una situación vulnerable (OMS 2010), aunque está claro que la lucha contra las desigualdades requiere la participación de diversos programas y partes interesadas, tanto dentro como fuera del sector de la salud, que puedan ayudar a considerar los determinantes sociales (OMS 2010).
De qué manera podría funcionar la intervención
El arroz es un alimento básico producido, molido y comercializado a nivel mundial, con una producción y un consumo anual en todo el mundo de alrededor de 490 000 000 de toneladas. Es el principal cultivo alimentario básico de alrededor de 3 000 millones de personas en todo el mundo, y proporciona entre el 50% y el 60% de su ingesta diaria de energía y proteínas (IRRI 2010). El arroz se cultiva en casi todas partes a nivel mundial, ya que puede crecer en una amplia gama de suelos y condiciones ambientales (Juliano 1993). Se estima que el 90% del arroz del mundo se produce en Asia (Juliano 1993; Muthayya 2014). China e India consumen el 50% del arroz del mundo y el consumo per cápita es mayor en Asia (Muthayya 2014). Se ha informado de un alto consumo en los países de América Latina y el Caribe, así como en África subsahariana (Muthayya 2014). Con su popularidad, alcance y cantidad de consumo, el arroz excede con creces los requisitos para su adopción como vehículo para el enriquecimiento de los alimentos a los efectos de una intervención a nivel de la población.
A nivel mundial, el método principal de procesamiento del arroz es la molienda. El objetivo del proceso es lograr una producción máxima de arroz molido sin romper en comparación con la harina o la sémola en otros cereales (Dexter, 1998). El proceso consiste en limpiar el arroz con cáscara o el arroz en bruto (grano de arroz sin descascarar) y eliminar la cáscara (quitar la cáscara, el germen y las capas de salvado) para producir arroz integral (Dexter 1998). El arroz integral consta de un peso promedio de 6% a 7% de salvado, 90% de endospermo y 2% a 3% de embrión (Saunders 1979). La molienda adicional para eliminar la capa de salvado produce arroz blanco. En promedio, el arroz con cáscara produce 25% de cascarilla, 10% de salvado y 65% de arroz blanco (Chen 1998). En algunos países, el arroz blanco molido se recubre de talco y glucosa para mejorar su aspecto (Dexter 1998). Las diferentes formas de arroz se presentan en la Tabla 1. El arroz blanco molido tiene un bajo contenido de vitaminas y minerales, debido a que estas vitaminas (vitaminas B) y minerales (hierro) se encuentran predominantemente en las capas de germen y salvado (Dexter 1998). El sancochado es una de las formas en que los nutrientes en el grano de arroz pueden ser preservados parcialmente. El proceso de sancochado con el remojo del arroz en bruto, la aplicación de calor, el secado y la molienda da como resultado la transferencia de nutrientes a la capa interna del endospermo desde el salvado antes de la molienda (Dexter 1998). El sancochado es costoso y el producto final, denominado "arroz dorado", puede no ser aceptado fácilmente por los consumidores (Dexter, 1998). Los diferentes tipos de arroz se describen en la Tabla 1.
Los intentos anteriores de enriquecimiento del arroz simplemente añadiendo un micronutriente en polvo al arroz que se adhiere a los granos mediante fuerzas electrostáticas (espolvoreado) han resultado infructuosos (Leon Guerrero 2009), debido a los métodos típicos de lavado y cocción empleados en la mayoría de los países en desarrollo, lo que resulta en el enjuague de la fortificación. Se han desarrollado tres métodos más sofisticados para superar este problema (A2Z Project 2008). El recubrimiento consiste en rociar la superficie de los granos de arroz comunes en varias capas con una mezcla de vitaminas y minerales para formar una capa protectora que no se enjuaga fácilmente con el lavado (Kyritsia 2011). Los granos (premezcla enriquecida) contienen altas concentraciones de enriquecedores vitamínicos y minerales y deben mezclarse con arroz natural (es decir, comúnmente 1 parte de premezcla enriquecida y 199 partes de arroz molido sin tratar) para producir arroz enriquecido. La tecnología de extrusión es un concepto totalmente diferente en el enriquecimiento del arroz. En la extrusión en caliente, una masa hecha de harina de arroz, mezcla de vitaminas y minerales y agua se pasa a través de una extrusora de hélice simple o doble y se forman estructuras parecidas a granos de arroz parcialmente precocidos que se asemejan a los granos de arroz; luego se mezcla con arroz pulido natural en una proporción de aproximadamente 1:200 para producir arroz enriquecido. Este proceso implica temperaturas relativamente altas (70 a 110 °C) obtenidas por el preacondicionamiento o la transferencia de calor a través de sacos de barril calentados con vapor, o ambos. La extrusión en frío sigue un proceso similar a baja temperatura (inferior a 70 °C) que no utiliza principalmente calor adicional y produce granos de premezcla enriquecidos opacos y sin cocer con una consistencia ligeramente más blanda. Luego se mezcla con arroz pulido natural en una proporción de aproximadamente 1:200 para producir arroz enriquecido.
El arroz es un producto básico muy sensible a la cultura (Hariyadi 2011). El cultivo, la selección y la cocción de los granos de arroz están sujetos a las preferencias regionales, nacionales e incluso locales. Se estima que una gran proporción de vitaminas y minerales importantes se pierden durante la molienda (DSM/Buhler 2010). Además, el enjuague y el lavado son métodos de cocción comunes que pueden disolver potencialmente los nutrientes añadidos o restaurados. Hay muchas maneras diferentes de cocinar el arroz. Las mismas incluyen: 1) remojar y hervir con agua en exceso; 2) hervir con agua en exceso; 3) hervir sin exceso de agua; 4) enjuagar y hervir sin exceso de agua; y 5) freír y hervir sin exceso de agua. El uso de estas preparaciones para cocinar podría tener diferentes retenciones de micronutrientes en los granos de arroz enriquecidos, ya que algunas vitaminas son sensibles al calor y otras son solubles en agua (OMS/FAO 2006). Las preferencias culturales por características específicas de los tipos de arroz pueden representar una barrera para el enriquecimiento masivo en algunos entornos. Un desafío técnico es producir arroz enriquecido que se asemeje al arroz natural y que resista los procesos normales de preparación y cocción de las comidas.
Un estudio realizado ya en 1948 en Filipinas demostró los efectos del enriquecimiento del arroz en la prevención del beriberi (Salcedo 1950). En Brasil, un estudio de biodisponibilidad con arroz enriquecido con vitamina A mostró una mejoría en los niveles de retinol de los niños (Flores 1994). Otro estudio en niños pequeños de 6 a 24 meses de edad en Brasil encontró que el arroz enriquecido con pirofosfato de hierro micronizado fue más efectivo que las gotas de hierro para disminuir la anemia del 100% al 62%, y la deficiencia de hierro del 69% al 25%, y para mejorar el estado de hierro (Beinner 2010). En un estudio realizado en la India, el arroz enriquecido en niños en edad escolar que asisten a la escuela mostró una reducción de la anemia por deficiencia de hierro del 78% al inicio al 25% en el grupo de hierro (Moretti 2006a). En otro contexto, la alimentación con arroz enriquecido con pirofosfato de hierro microencapsulado y micronizado para mejorar el estado de hierro de las mujeres en México mostró aumentos significativos en las concentraciones plasmáticas de ferritina y en las reservas estimadas de hierro en el cuerpo, así como una disminución significativa en las concentraciones de receptores de transferrina en plasma. El arroz enriquecido redujo la prevalencia de la anemia en un 80% y la deficiencia de hierro en un 29% entre las mujeres mexicanas que trabajan en una fábrica (Hotz 2008).
Esta revisión intenta evaluar, sobre la base de la investigación existente, la efectividad del enriquecimiento del arroz como intervención de salud pública. El modelo lógico de la Organización Mundial de la Salud y los Centers for Disease Control and Prevention (OMS/CDC) para las intervenciones con micronutrientes en la salud pública describe la teoría del programa y las relaciones plausibles entre los aportes y las mejorías esperadas en los Sustainable Development Goals y puede adaptarse a diferentes contextos (OMS/CDC 2016). La efectividad del enriquecimiento del arroz en la salud pública depende de varios factores relacionados con las políticas y las regulaciones legislativas; la producción y el suministro de arroz enriquecido; el desarrollo de sistemas de distribución del arroz enriquecido; el desarrollo y la implementación de sistemas externos e internos de control de la calidad de los alimentos; y la elaboración e implementación de estrategias de información, educación y comunicación para el cambio de comportamiento entre los consumidores. En la Figura 1 se presenta un modelo de lógica genérica para las intervenciones con micronutrientes que ilustra estos procesos y resultados.
El alto consumo de arroz pulido como alimento básico en muchos ámbitos se ha asociado con un mayor riesgo de diabetes y otras enfermedades crónicas, aunque los resultados de los estudios han sido contradictorios. Se ha publicado una revisión sistemática y un metanálisis con respecto a los estudios sobre el arroz pulido y la diabetes (Hu 2012), y otro con respecto al arroz y la incidencia de enfermedades crónicas, incluida la diabetes (Saneei 2017). El metanálisis anterior incluyó cuatro estudios de cohortes prospectivos y encontró que el mayor consumo de arroz blanco estaba asociado con un mayor riesgo de desarrollar diabetes tipo 2 en comparación con un nivel de ingesta más bajo (riesgo relativo 1,27; IC del 95%: 1,04 a 1,54; Hu 2012). Esta asociación fue más fuerte para las poblaciones asiáticas (chinas y japonesas), aunque las relaciones dosis‐respuesta indicaron que incluso para las poblaciones occidentales con niveles de ingesta típicamente bajos, el consumo de arroz blanco aún podría aumentar modestamente el riesgo de diabetes. Un metanálisis más reciente (Saneei 2017), no mostró un aumento del riesgo de diabetes con el mayor consumo de arroz debido a un estudio adicional de España (Soriguer 2013), que mostró que se encontró una asociación negativa entre el consumo de arroz blanco y la incidencia de diabetes en seis años. En Saneei 2017 no se desglosaron las estimaciones para el origen de la población, aunque tanto Hu 2012 como Saneei 2017 mostraron un mayor riesgo de diabetes o enfermedades crónicas entre las mujeres que consumían más arroz. Es posible que las políticas de enriquecimiento del arroz deban tener en cuenta el posible aumento del riesgo de diabetes y otras enfermedades con el consumo de arroz y determinar los niveles de enriquecimiento en función de los niveles de consumo de arroz existentes, como se ha hecho en el caso de las políticas de yodación de la sal y de reducción de la sal (OMS 2014). Además, el enriquecimiento de este alimento básico puede afectar la aceptabilidad del arroz enriquecido y, por lo tanto, cambiar potencialmente los patrones alimenticios (Khanh 2014).
Por qué es importante realizar esta revisión
Las carencias de vitaminas y minerales son problemas importantes de salud pública en todo el mundo. Entre las opciones para considerar estas deficiencias, el enriquecimiento masivo representa una intervención atractiva, ya que aprovecha el mercado y los sistemas de distribución existentes, no requiere la participación activa de las poblaciones vulnerables para aumentar la ingesta de alimentos o diversificar la dieta, y tiene pocos problemas de seguridad. El arroz representa un vehículo adecuado para el enriquecimiento, ya que se considera un alimento básico en la mayor parte del mundo, en especial en las regiones donde las deficiencias de micronutrientes son más evidentes.
El enriquecimiento de la harina de trigo y maíz con hierro solo, o en combinación con ácido fólico y otros micronutrientes, se ha implementado en más de 50 países (CDC 2008; OMS 2009b) y está mostrando resultados prometedores en la reducción de la anemia y los defectos del tubo neural (Centeno Tablante 2019; García‐Casal 2018). Sobre la base de esta experiencia, un número cada vez mayor de países de todo el mundo están adoptando rápidamente el enriquecimiento del arroz como un medio para luchar contra la malnutrición. En algunos países, como Filipinas, Costa Rica, Papúa Nueva Guinea y Nicaragua (GAIN 2010), se ha adoptado el enriquecimiento obligatorio del arroz. El arroz enriquecido se vende en China utilizando una fórmula multimicronutriente y, en Japón, el arroz fortificado está en el mercado desde 1981. Los EE.UU. tienen una norma alimentaria obligatoria para el "arroz fortificado", que prescribe los niveles de tiamina, niacina, riboflavina, ácido fólico e hierro que deben añadirse al arroz para su enriquecimiento. Aunque este requisito solo se aplica para que el arroz sea etiquetado como "fortificado" (FDA 2001), el 70% del arroz consumido en los Estados Unidos es fortificado o enriquecido (American Rice Inc 2004; A2Z Project 2008). En la India, Brasil y Colombia, el arroz enriquecido se distribuye en la actualidad a través de programas de redes de seguridad pública (Tsang 2016).
A pesar de este interés, hasta la fecha no se ha realizado una evaluación sistemática de los efectos beneficiosos y perjudiciales de esta intervención para informar la formulación de políticas y ayudar a los países en el diseño e implementación de programas apropiados de enriquecimiento de alimentos, con la excepción de una revisión sistemática llevada a cabo sobre intervenciones con niños de entre 6 y 59 meses (Hijar 2015). Se estableció la conclusión de que el enriquecimiento del arroz era efectivo para corregir y mejorar la deficiencia de hierro en los niños menores de cinco años de edad.
Objetivos
Determinar los efectos beneficiosos y perjudiciales del enriquecimiento del arroz con vitaminas y minerales (hierro, vitamina A, zinc o ácido fólico) sobre el estado de micronutrientes y los resultados relacionados con la salud en la población general.
Métodos
Criterios de inclusión de estudios para esta revisión
Tipos de estudios
Se incluyeron ensayos controlados aleatorizados (ECA). Dichos estudios proporcionan información sobre si el arroz enriquecido es efectivo y si realmente puede lograr cambios en la salud y en el estado de vitaminas y minerales de los que reciben la intervención.
Sin embargo, el enriquecimiento de los alimentos es una intervención que tiene por objeto llegar a toda la población de un país o a grandes sectores de la población y que con frecuencia se realiza a través del sistema alimentario. Por lo tanto, también se han incluido datos de otros diseños de estudios.
En resumen, se intentó incluir los siguientes diseños de estudio.
-
ECA, con aleatorización a nivel individual o grupal
-
Ensayos controlados cuasialeatorizados (en los que la asignación al tratamiento se realizó, por ejemplo, mediante asignación alterna, fecha de nacimiento o por orden alfabético)
-
Ensayos controlados no aleatorizados
-
Estudios observacionales prospectivos que informan de una especie de grupo de control:
-
estudios de cohortes (prospectivos y retrospectivos);
-
estudios controlados de tipo antes y después con al menos dos sitios de intervención y dos sitios de control.
-
series de tiempo interrumpido (STI) con al menos tres puntos de medición de datos antes y después de la intervención.
-
Los resultados de los diseños de estudios controlados no aleatorizados y observacionales se analizaron por separado de los diseños de estudios aleatorizados y cuasialeatorizados.
No se consideraron los estudios de tipo antes y después sin un grupo control para su inclusión en esta revisión. Los resultados de estos estudios se presentan en una tabla, pero no están incluidos en un metanálisis y no informan directamente las conclusiones de la revisión. Dichos estudios proporcionan información sobre la ejecución, la viabilidad y otros factores contextuales relacionados con las intervenciones que se están examinando. No se incluyeron ensayos cruzados (cross‐over).
Tipos de participantes
Población en general mayor que dos años de edad (incluidas las embarazadas), de cualquier país. Se excluyeron los estudios de intervenciones dirigidas a participantes con una enfermedad grave o comorbilidades graves.
Tipos de intervenciones
Las intervenciones de la revisión fueron aquellas en las que el arroz había sido enriquecido con al menos un micronutriente o una combinación de varios micronutrientes (hierro, ácido fólico, zinc, vitamina A u otras vitaminas y minerales) independientemente del método de tecnología de enriquecimiento utilizado. El arroz enriquecido, a los efectos de esta revisión, se refiere al agregado de una premezcla de micronutrientes al arroz común utilizando cualquier tecnología de enriquecimiento del arroz, como la extrusión en caliente, la extrusión en frío, el revestimiento o el espolvoreado (A2Z Project 2008). Se incluyeron estudios con cointervenciones, es decir, arroz enriquecido con educación, cuando el grupo de comparación también recibió el componente educativo además del arroz no enriquecido.
Las comparaciones incluyen lo siguiente.
-
Arroz enriquecido con hierro solo o combinado con otros micronutrientes frente al arroz no enriquecido (sin agregado de micronutrientes)
-
Arroz enriquecido con hierro solo o en combinación con otros micronutrientes frente a ninguna intervención
-
Arroz enriquecido con vitamina A sola o en combinación con otros micronutrientes frente al arroz no enriquecido (sin agregado de micronutrientes)
-
Arroz enriquecido con vitamina A sola o en combinación con otros micronutrientes frente a ninguna intervención
-
Arroz enriquecido con zinc solo o en combinación con otros micronutrientes frente al arroz no enriquecido (sin micronutrientes agregados)
-
Arroz enriquecido con zinc solo o en combinación con otros micronutrientes frente a ninguna intervención
-
Arroz enriquecido con ácido fólico solo o en combinación con otros micronutrientes frente al arroz no enriquecido (sin micronutrientes agregados)
-
Arroz enriquecido con ácido fólico solo o en combinación con otros micronutrientes frente a ninguna intervención
Cuando los estudios examinaron los efectos de dos o más nutrientes junto con el hierro, se los incluyó en la primera comparación solo para evitar la duplicación. Cuando los estudios tenían micronutrientes en sus brazos de enriquecimiento sin hierro, se los incluyó en las comparaciones posteriores.
Se excluyeron los estudios que comparaban el enriquecimiento del arroz con otras formas de intervenciones de micronutrientes (es decir, la administración de suplementos o la diversificación de la dieta) o el enriquecimiento de otros vehículos alimentarios. También se excluyeron los estudios in vitro y los que examinan el efecto del arroz biofortificado (cultivos básicos de arroz con alto contenido de nutrientes mediante prácticas de cultivo convencionales y biotecnología moderna).
Tipos de medida de resultado
Resultados primarios
Los resultados primarios a través de todas las poblaciones de esta revisión fueron la presencia de anemia, deficiencia de hierro, concentraciones de hemoglobina y efectos adversos.
-
Anemia (definida como hemoglobina [Hb] por debajo del límite de la OMS, ajustada en función de la altitud cuando fue apropiado [OMS 2011a], según la definición de los autores del estudio)
-
Deficiencia de hierro (según la definición de los autores del estudio, basado en un biomarcador del estado del hierro)
-
Concentración de hemoglobina (g/L)
-
Deficiencia de vitamina A (según la definición de los autores del estudio, mediante el uso de un biomarcador; solo para el arroz enriquecido con vitamina A como intervención)
-
Folato en suero o plasma (nmol/L) (solo para el arroz enriquecido con ácido fólico como intervención)
-
Cualquier efecto adverso (según la definición de los autores de los estudios).
Los resultados primarios adicionales de interés difirieron según el grupo de participantes, como se indica a continuación.
Niños (de dos a 11,9 años de edad)
-
Diarrea (según la definición de los autores del estudio)
-
Infecciones respiratorias (según la definición de los autores del estudio)
-
Muerte por todas las causas
Mujeres embarazadas
-
Anomalías congénitas (defecto del tubo neural, labio leporino, paladar hendido, defectos cardiovasculares congénitos y otros según la definición de los autores del estudio; solo para el arroz enriquecido con ácido fólico como intervención)
-
Aborto espontáneo
Resultados secundarios
Los resultados secundarios incluyeron los siguientes.
-
Retinol en suero o plasma (µmol/L) (solo para el arroz enriquecido con vitamina A como intervención)
-
Zinc en suero o plasma (µmol/L)
-
Medidas antropométricas (puntuación Z de altura para la edad y puntuación Z del peso para la altura para los niños, índice de masa corporal [IMC] para los adultos)
-
Riesgo de sobrecarga de hierro (definida de acuerdo a la ferritina sérica superior a 150 µg/L en mujeres y superior a 200 µg/L en hombres)
-
Paludismo clínico (según la definición de los autores del estudio)
-
Paludismo grave (según la definición de los autores del estudio)
-
Ceguera nocturna (definida como la incapacidad informada para ver después del anochecer en personas que típicamente informan tener una visión normal durante el día; solo para el arroz enriquecido con vitamina A como intervención)
Para los estudios que administraron la intervención en el primer nivel administrativo o superior (es decir, estudios no aleatorizados) se examinaron las mismas variables a nivel ecológico (por ejemplo, prevalencia de anemia o tasas de anomalías congénitas).
Métodos de búsqueda para la identificación de los estudios
Búsquedas electrónicas
We searched the following international and regional sources.
International databases
-
Cochrane Central Register of Controlled Trials (CENTRAL; Issue 7 2012 to Issue 12 2018) via Cochrane Register of Studies Online (CRSO)
-
MEDLINE (OVID; 1948 to 10 December 2018)
-
Embase (OVID; 1980 to 10 December 2018)
-
CINAHL EBSCOhost (1937 to 10 December 2018)
-
Web of Science (ISI) SCI, SSCI, CPCI‐exp & CPCI‐SSH (until 10 December 2018)
-
POPLINE (www.popline.org/; 10 December 2018)
-
AGRICOLA (Ebsco; 10 December 2018)
-
ClinicalTrials.gov (searched 10 December 2018)
-
WHO International Clinical Trials Registry Platform (ICTRP; apps.who.int/trialsearch; searched 10 December 2018)
-
BIOSIS (ISI; 2012 to 10 December 2018)
Regional databases
-
IBECS (ibecs.isciii.es; searched 10 December 2018)
-
SciELO (Scientific Electronic Library Online; www.scielo.br; searched 10 December 2018)
-
African Index Medicus (AIM; www.globalhealthlibrary.net/php/index.php?lang=en; searched 10 December 2018)
-
Index Medicus for the Eastern Mediterranean Region (IMEMR; www.globalhealthlibrary.net/php/index.php?lang=en; searched 10 December 2018)
-
LILACS (Latin American and Caribbean Health Sciences Literature; lilacs.bvsalud.org/en; searched 10 December 2018)
-
PAHO (Pan American Health Library; www1.paho.org/english/DD/IKM/LI/library.htm; searched 10 December 2018)
-
WHOLIS (WHO Library; dosei.who.int/; searched 10 December 2018)
-
WPRIM (Western Pacific Region Index Medicus; www.wprim.org/; searched 10 December 2018)
-
Index Medicus for the South‐East Asia Region (IMSEAR; imsear.hellis.org; searched 10 December 2018)
-
IndMED, Indian medical journals; medind.nic.in/imvw/; searched to 10 December 2018)
-
Native Health Research Database; hslic‐nhd.health.unm.edu; searched to 10 December 2018)
For these sources, we searched WorldCat, Networked Digital Library of Theses and Dissertations, DART‐Europe E‐theses Portal, Australasian Digital Theses Program, Theses Canada Portal and ProQuest‐Desertations and Theses.
We handsearched the five journals with the highest number of included studies in the last 12 months to capture any article that may not have been indexed in the databases at the time of the search. As rice fortification technologies are relatively novel we limited the search, from 1960 to present, for all databases, although some had no time restrictions.
We contacted Cochrane Public Health's Information Specialist to search the Cochrane Public Health Group Specialised Register. The search used keyword and controlled vocabulary (when available), using the search terms set out in the Appendices and adapting them as appropriate for each database (see Appendix 1).
We did not apply any language restrictions. If we identified articles written in a language other than English, we commissioned their translation into English. If this was not possible, we sought advice from Cochrane Public Health. We stored these articles in the 'Awaiting assessment' section of the review until a translation is available.
Búsqueda de otros recursos
For assistance in identifying ongoing or unpublished studies, we contacted the Department of Nutrition for Health and Development and WHO regional offices, the nutrition section of the United Nations Children's Fund (UNICEF), the World Food Programme (WFP), the US Centers for Disease Control and Prevention (CDC), US Agency for International Development (USAID) micronutrient programme, Nutrition International, the Global Alliance for Improved Nutrition (GAIN), Hellen Keller International (HKI), Sight and Life Foundation, PATH, the Wright Group, premix producers DSM and BASF, Food Fortification Initiative (FFI) and the Rice Fortification Resource Group (March 2019).
Obtención y análisis de los datos
Selección de los estudios
Two review authors (JPP, PM) independently screened the titles and abstracts of articles retrieved by each search to assess initial eligibility. After the initial screening, we then retrieved full copies of all eligible papers and screened them for eligibility as determined by the inclusion and exclusion criteria listed above. When we were unable to reject a title or abstract with certainty, we obtained the full text of the article for further evaluation. If we could not obtain full articles, we attempted to contact the study authors to obtain further details of the study. Failing this, we classified studies as 'awaiting assessment' until further information is published or made available to us. We resolved disagreements at any stage of the eligibility assessment process through discussion and consultation with two other review authors (SN, LMR), where necessary.
Extracción y manejo de los datos
Two review authors independently extracted data in duplicate using customised data extraction forms based on those from Cochrane Handbook (Higgins 2019), Cochrane Public Health (Cochrane PHG 2010), and Cochrane Effective Practice and Organisation of Care (EPOC 2017).
All review authors were involved in piloting the form using a subset of articles in order to enhance consistency amongst review authors; based on this, we modified the form as necessary. We collected information on study design, study setting, participants (number and characteristics) and provided a full description of the interventions examined. We extracted details of outcomes measured (including a description of how and when outcomes were measured) and results.
Two review authors (JPP, LMR) designed the form, so that we were able to record results for our prespecified outcomes as well as for other non‐specified outcomes, although we did not use such outcomes to underpin any of our conclusions. We also extracted additional items relating to study recruitment and the implementation of the intervention, including number of sites for an intervention, whether recruitment was similar at different sites, levels of compliance and use of rice in different sites within studies, resources required for implementation, and whether studies had conducted a process evaluation. We also recorded whether or not studies included specific strategies to address diversity or disadvantage. We used the PROGRESS (place of residence, race/ethnicity, occupation, gender, religion, education, socioeconomic status, capital) checklist to collect information on whether or not studies had reported data by sociodemographic characteristics known to be important from an equity perspective (Ueffing 2011).
Two review authors (JPP, JAS) entered data into Review Manager 5 software and checked for accuracy (Review Manager 2014).
Evaluación del riesgo de sesgo de los estudios incluidos
We used the EPOC 'RIsk of bias' tool for studies with a separate control group to assess the risk of bias of all studies at study level for primary outcomes (EPOC 2017). This tool includes five domains of bias: selection, performance, attrition, detection and reporting; as well as an 'other bias' category to capture other potential threats to validity.
Two review authors independently assessed risk of bias in duplicate (JPP, PM) for each study and resolved any disagreement by discussion or by involving an additional review author (SN).
Assessing risk of bias in randomised trials and quasi‐randomised trials
1. Sequence generation (checking for possible selection bias)
We assessed studies as:
-
low risk of bias if there is a random component in the sequence generation process (e.g. random number table; computer random number generator);
-
high risk of bias if a non‐random approach has been used (e.g. odd or even date of birth; hospital or clinic record number). Non‐randomised studies should be scored 'high';
-
unclear risk of bias if not specified in the paper.
2. Allocation concealment (checking for possible selection bias)
We assessed studies as:
-
low risk of bias if participants and investigators enrolling participants could not foresee assignment because an appropriate method was used to conceal allocation (e.g. telephone or central randomisation; consecutively numbered sealed opaque envelopes). We gave this rating to studies where the unit of allocation was by institution and allocation was performed on all units at the start of the study;
-
high risk of bias if participants of investigators enrolling participants could possibly foresee assignments and potentially introduce selection bias (e.g. open random allocation; unsealed or non‐opaque envelopes);
-
unclear.
3. Similarity of baseline outcome measurements (checking for confounding, a potential consequence of selection bias)
We assessed studies as:
-
low risk of bias if outcomes were measured prior to the intervention, and no important differences were present across intervention groups;
-
high risk of bias if important differences in outcomes between groups were present prior to intervention and were not adjusted for in the analysis;
-
unclear risk of bias if there was no baseline measure of outcome (note: if 'high' or 'unclear' but there is sufficient information to do an adjusted analysis, the assessment should be 'low').
4. Similarity of baseline characteristics (checking for confounding, a potential consequence of selection bias)
We assessed studies as:
-
low risk of bias if baseline characteristics are reported and similar across intervention groups;
-
high risk of bias if baseline characteristics are not reported or if there are differences across groups;
-
unclear risk of bias if it is not clear (e.g. characteristics mentioned in text but no data presented).
5. Incomplete outcome data (checking for possible attrition bias through withdrawals, dropouts and protocol deviations)
We assessed outcomes in each included study as:
-
low risk of bias due to incomplete outcome data, which could be either that there were no missing outcome data or the missing outcome data were unlikely to bias the results based on the following considerations: study authors provided transparent documentation of participant flow throughout the study, the proportion of missing data was similar in the intervention and control groups, the reasons for missing data were provided and balanced across the intervention and control groups, the reasons for missing data were not likely to bias the results (e.g. moving house).
-
high risk of bias if missing outcome data was likely to bias the results. Studies will also receive this rating if an 'as‐treated' (per protocol) analysis is performed with substantial differences between the intervention received and that assigned at randomisation, or if potentially inappropriate methods for imputation have been used;
-
unclear risk of bias.
6. Blinding (checking for possible performance and detection bias)
We assessed the risk of performance bias associated with blinding as:
-
low, high or unclear risk of bias for participants;
-
low, high or unclear risk of bias for personnel.
We assessed the risk of detection bias associated with blinding as:
-
low, high or unclear risk of bias for outcome assessors.
Whilst assessed separately, we combined the results in a single evaluation of risk of bias associated with blinding as follows:
-
low risk of bias if there was blinding of participants and key study personnel and it was unlikely to have been broken, or the outcomes are objective. This rating will also be given to studies where either participants and key study personnel were not blinded but outcome assessment was blinded and the non‐blinding of others was unlikely to introduce bias;
-
high risk of bias if there was no blinding or incomplete blinding or if there was blinding that was likely to have been broken and the outcome or outcome assessment was likely to be influenced by a lack of blinding;
-
unclear risk of bias.
7. Contamination (checking for possible performance bias)
We assessed studies as:
-
low risk of bias if allocation was by community, institution or practice and it is unlikely that the control group received the intervention;
-
high risk of bias if it is likely that the control group received the intervention;
-
unclear risk of bias if it is possible that contamination occurred but the risk of this happening is not clear.
8. Selective reporting bias
We assessed studies as:
-
low risk of bias if it is clear, either by availability of the study protocol or otherwise, that all prespecified outcomes that are of interest in the review have been reported;
-
high risk of bias if it is clear that not all of the study's prespecified outcomes have been reported, or reported outcomes were not prespecified (unless justification for reporting is provided), or outcomes of interest are reported incompletely and cannot be used, or where one or more of the primary outcomes is reported using measurements or analysis methods that were not prespecified, or finally if the study report fails to include an important outcome that would be expected to have been reported;
-
unclear risk of bias.
9. Other sources of bias
Other possible sources of bias were described for each included study and a rating of low, high or unclear risk of bias was given for this item.
In addition to the above criteria, we also assessed cluster‐RCTs with the following criteria:
1. Recruitment bias
We assessed studies as:
-
low risk of bias if individuals were recruited to the study before the clusters were randomised;
-
high risk of bias if individuals were recruited to the study after the clusters were randomised;
-
unclear risk of bias.
2. Baseline imbalance
We assessed studies as:
-
low risk of bias if baseline characteristics were reported and were similar across clusters or if study authors used stratified or pair‐matched randomisation of clusters;
-
high risk of bias if baseline characteristics were not reported or if there were differences across clusters;
-
Unclear risk of bias.
3. Loss of clusters
We assessed studies as:
-
low risk of bias if no complete clusters were lost or omitted from the analysis;
-
high risk of bias if complete clusters were lost or omitted from the analysis;
-
unclear risk of bias.
4. Incorrect analysis
We assessed studies as:
-
low risk of bias if study authors appropriately accounted for clusters in the analysis or provided enough information for review authors to account for clusters in the meta‐analysis;
-
High risk of bias if study authors did not appropriately account for clusters in the analysis or did not provide enough information for review authors to account for clusters in the meta‐analysis;
-
Unclear risk of bias.
5. Compatibility with individual RCTs
We assessed studies as:
-
low risk of bias if effects of the intervention were likely not altered by the unit of randomisation;
-
high risk of bias if effects of the intervention were likely altered by the unit of randomisation;
-
unclear risk of bias.
Overall risk of bias
For all included studies, we summarised the overall risk of bias by primary outcome within each study at the study level. Studies at high risk of bias were those with high or unclear risk of bias in the following domains: allocation concealment, similarity of baseline outcome measurements, and incomplete outcome data. We judged the overall risk of bias of each study as 'low' if we had assessed all three domains at low risk; and 'high' when we had assessed one or more of the domains at either high or unclear risk. Judgements took into account the likely magnitude and direction of bias and whether it was likely to impact on the findings of the study.
Medidas del efecto del tratamiento
For dichotomous outcomes we have presented proportions, and for two‐group comparisons we have presented results as average risk ratio (RR) with 95% confidence interval (CI). We have reported results for continuous outcomes as the mean difference (MD) with 95% CI if studies measured outcomes in the same way. Where some studies reported endpoint data and others reported changes from baseline data (with errors), we combined these in the meta‐analysis if the outcomes had been reported using the same scale. We used standardised mean difference (SMD) with 95% CI to combine studies that measured the same outcome (for example haemoglobin) but used different methods.
For studies with multiple arms reporting a continuous variable as an outcome, we calculated the weighted average for single pair‐wise results in the meta analysis.
Cuestiones relativas a la unidad de análisis
Cluster‐randomised trials
We combined results from both cluster‐randomised and individually randomised studies if there was little heterogeneity between the studies. We labelled cluster‐randomised trials with a 'C'. If the authors of cluster‐randomised trials had conducted their analyses at a different level to that of allocation, and they had not appropriately accounted for the cluster design in their analyses, we calculated studies' effective sample sizes to account for the effect of clustering in the data. We utilised the intra‐cluster correlation coefficient (ICC) derived from the study (if available) or from another source (for example using the ICCs derived from other, similar studies) (Adams 2004; Gulliford 1999), and then calculated the design effect with the formula provided in the Cochrane Handbook for Systematic Reviews of Interventions (Higgins 2011). We reported this and undertook sensitivity analysis to investigate the effect of variations in ICC.
We made an adjustment in the number of participants for design effect for both the continuous outcome of haemoglobin concentrations and dichotomous outcomes of anaemia, iron deficiency and vitamin A deficiency in two studies (Parker 2015 (C); Perignon 2016 (C). We used the design effect calculated for anaemia for calculating the total number of participants in iron deficiency, vitamin A deficiency and haemoglobin concentration. We used the mean and standard deviations of haemoglobin concentration in the analysis without making any changes. The details of adjustments for design effect in each of the studies are provided in Characteristics of included studies.
Studies with more than two treatment groups
If we identified studies with more than two intervention groups (multi‐arm studies), where possible we combined groups to create a single pair‐wise comparison or used the methods set out in the Cochrane Handbook for Systematic Reviews of Interventions to avoid double counting study participants (Higgins 2011). If two or more study arms shared the control group, we divided the control group over the number of relevant subgroup categories to avoid double counting the participants (for dichotomous data, we divided the events and the total population while for continuous data we assumed the same mean and standard deviation but divided the total population). The details are described in the Characteristics of included studies tables.
Manejo de los datos faltantes
We noted missing outcome data and levels of attrition for included studies on the data extraction form. We explored the impact of including studies with high levels of missing data in the overall assessment of treatment effect by using sensitivity analysis. The denominator for each outcome in each study was the number randomised minus any participants whose outcomes we knew to be missing. For missing summary data, we contacted lead study authors for clarification or, if possible, we estimated missing summary data using other statistical information (for example confidence intervals, standard errors) provided in the primary paper and imputed the standard deviation either from other studies in the same systematic review or from studies in another systematic review.
Evaluación de la heterogeneidad
We examined forest plots from a meta‐analysis to visually determine the level of heterogeneity (in terms of the size or direction of treatment effect) between studies. We used Tau², I² statistic (Higgins 2003) and Chi² statistic to quantify the level of heterogeneity among the studies in each analysis (Deeks 2017). We regarded substantial or considerable heterogeneity as Tau² greater than 0 and either I² statistic greater than 30% or a low P value (< 0.10) in the Chi² test. We noted this in the text and explored it using prespecified subgroup analyses mentioned below. Caution was taken in the interpretation of those results with high levels of unexplained heterogeneity.
Evaluación de los sesgos de notificación
Where we suspected reporting bias (see 'Selective reporting bias' above) we attempted to contact study authors asking them to provide missing outcome data. Where this was not possible, and we thought that the missing data would introduce serious bias, we explored the impact of including such studies in the overall assessment of results by a sensitivity analysis.
We did not anticipate that there would be sufficient studies contributing data for any particular outcome for us to examine possible publication bias; if more than 10 studies reporting the same outcome of interest were available, we planned to generate funnel plots in Review Manager 2014 and visually examine them for asymmetry. Where we pooled studies in a meta‐analysis we ordered studies in terms of weight so that a visual examination of forest plots might allow us to assess whether the results from smaller and larger studies were similar or if there were any apparent differences according to study size.
Síntesis de los datos
We carried out a meta‐analysis to provide an overall estimate of treatment effect when more than one study examined the same intervention, provided that studies used similar methods and measured the same outcome in similar ways in similar populations. We used a random‐effects model meta‐analysis for combining data as we anticipated that there might be natural heterogeneity between studies attributable to the difference. We used narrative synthesis, guided by the data extraction form in terms of the ways in which studies were grouped and summarised, to describe the outcomes, explore intervention processes, and describe the impact of interventions by sociodemographic characteristics known to be important from an equity perspective based on the PROGRESS framework, where this information was available.
We did not combine results from randomised and non‐randomised trials together in a meta‐analysis, and we have not presented pooled estimates for non‐randomised studies with different types of study design. We have reported the results of the controlled before‐and‐after studies in narrative form.
Assessing the certainty of evidence
For the assessment across studies, we used MECIR (Methodological Expectations of Cochrane Intervention Reviews) conduct standards (MECIR 2018), and we employed the GRADE approach to interpret findings (Langendam 2013). The GRADE profiler (GRADEpro GDT 2015) allowed us to import data from Review Manager 2014 to create 'Summary of findings' tables. For each of the outcomes, two review authors (JPP, MNGC) assessed the certainty of evidence of included studies independently, using the GRADE approach (Balshem 2011). We have listed the primary outcomes for each comparison with estimates of relative effects along with the number of participants and studies contributing data for those outcomes. These tables provide outcome‐specific information concerning the overall certainty of evidence from studies included in the comparison, the magnitude of effect of the interventions examined, and the sum of available data on the outcomes we considered. We included only primary outcomes in the 'Summary of findings' tables. We prepared 'Summary of findings' tables for the comparisons including rice fortified with iron alone versus unfortified rice, vitamin A alone or in combination with other micronutrients versus unfortified rice, zinc alone or in combination with other micronutrients versus unfortified rice, and folic acid alone or in combination with other micronutrients versus unfortified rice. The outcomes included in these were anaemia, iron deficiency, haemoglobin concentration, vitamin A deficiency, diarrhoea, respiratory infections, all‐cause death, and any adverse effects (see Summary of findings table 1; Summary of findings table 2).
For assessments of the overall certainty of evidence for each outcome that included pooled data from included studies from RCTs only, we downgraded the evidence from 'high certainty' by one level for serious (or by two for very serious) study limitations (risk of bias), indirectness of evidence (due to the use of different cut‐offs, for example), serious inconsistency, imprecision of effect estimates or potential publication bias. Data from observational studies started at low certainty. This assessment was limited only to the studies included in this review and as we did not consider there was a serious risk of publication bias, we did not downgrade in this domain.
Análisis de subgrupos e investigación de la heterogeneidad
Where possible we conducted subgroup analysis to explore heterogeneity according to the following subgroups.
-
Micronutrient content: single nutrient versus two or more nutrients
-
Rice fortification method: hot extrusion versus cold extrusion versus coating versus dusting
-
Cooking method most commonly used in study setting (as reported): soaking, and boiling with excess water versus boiling in excess water versus boiling without excess water versus rinsing and boiling without excess water versus frying and boiling without excess water versus unknown/unreported
-
Public health significance of anaemia at baseline in the target group: not a problem (lower than 5%) versus mild and moderate (5% to 39.9%) versus severe (40% and more) versus mixed/unknown/unreported
-
Malaria endemicity at the time that the study was conducted: some malaria risk setting versus malaria‐free area versus unknown/unreported malaria setting.
We examined differences between subgroups by visual inspection of the CIs; non‐overlapping CIs suggesting a statistically significant difference in treatment effect between the subgroups. We also used the approach of Borenstein 2008 to formally investigate differences between two or more subgroups. We conducted analyses in RevMan 5 (Review Manager 2014). We limited this analysis to those outcomes for which three or more studies contributed data.
Análisis de sensibilidad
We carried out sensitivity analysis to examine the effects of removing studies at high risk of bias (those with high or unclear risk of bias for allocation concealment, similarity of baseline outcome measurements, incomplete outcome data) from the meta‐analysis. For cluster‐randomised trials, we carried out sensitivity analysis using a range of ICC on overall effect estimate and have reported these effects.
Results
Description of studies
Results of the search
Our search strategy identified 28,730 references (22,147 references after removing duplicates) for possible inclusion. We screened a total of 58 full‐text articles for potential inclusion for the analyses. We included 17 studies (28 records). We excluded 22 studies (28 records) with reasons and identified two ongoing or unpublished studies (NCT02714075; NCT03056625). All 17 included studies were reported in English. We have summarised the study selection process in Figure 2. Of the 17 studies, 12 RCTs contributed to the meta‐analysis.
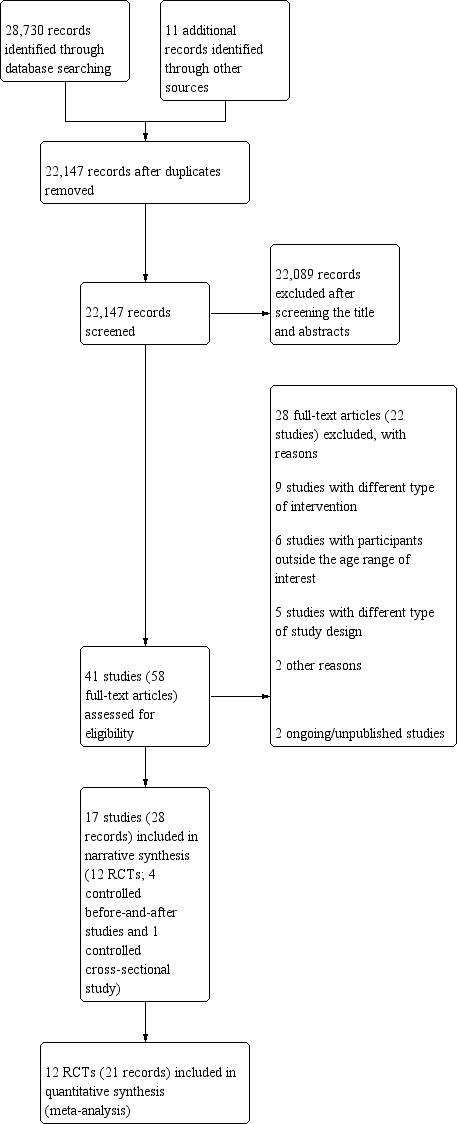
PRISMA study flow diagram
Included studies
We have presented the details of included studies, including participants, interventions, outcomes, source of funding, and results of contact with the study authors, in the Characteristics of included studies. We have given a summary of the general characteristics of the included studies in Table 2. Twelve studies were reported from Asian countries (Angeles‐Agdeppa 2008; Ara 2019; Gershoff 1977; Hardinsyah 2016; Hussain 2014; Moretti 2006b; Perignon 2016 (C); Pinkaew 2013; Pinkaew 2014; Radhika 2011; Salcedo 1950; Thankachan 2012), two from Brazil (Della Lucia 2016; Nogueira Arcanjo 2013), one from Mexico (Hotz 2008), one from the USA (Louisiana; Losso 2017) and one study from Burundi (Parker 2015 (C)). The PROGRESS‐Plus framework characteristics are given in Table 3. Each of the 17 included studies had different levels of micronutrient concentrations per 100 grams of uncooked rice, and we have given details of the micronutrient fortification profile in Table 4.
| Study and year (Country) | Participants | Type of rice fortification and dosage | Duration of intervention | Overall risk of bias |
| RCTs (individual randomisation) | ||||
| (Philippines) | 180 anaemic children aged 6‐9 years excluding severe anaemia (Hb < 70 g/L), history of blood disorders and other haemoglobinopathies |
| 6 months | High |
| (Indonesia) | 200 post‐menarchal adolescent girls 14‐18 years of age attending boarding school |
| 4 months | High |
| (Mexico) | 180 non‐pregnant, non‐lactating women 18‐49 years of age with moderate to low Hb concentrations from 6 factories |
| 6 months | High |
| (India) | 222 iron‐ and vitamin A‐depleted children 5‐8 years of age attending a subsidised lunch feeding programme |
| 6 months | High |
| (USA) | 17 menstruating women with iron‐deficiency anaemia |
| 2 weeks | High |
| (India) | 184 iron‐depleted children aged 6‐13 years from a primary school serving the Rock‐Colony neighbourhood |
| 7 months | Low |
| (Thailand) | The study was conducted in 8 primary schools with children aged 4‐12 years and they were mainly from low‐income families. |
| 5 months | High |
| (Thailand) | One primary school in the Muang district, of Thailand with children aged 8‐12 years, were the study participants |
| 2 months | High |
| (India) | 140 children aged between 5 and 11 years (with haemoglobin > 70 g/L) |
| 8 months | Low |
| (India) | Total of 258 anaemic (Hb concentrations 115 g/L for 6–11 years and 120 g/L for 12 years) children attending 4 primary schools aged 6‐12 years |
| 6 months | High |
| RCTs (cluster randomisation) | ||||
| (Burundi) | The study included 1071 children from 12 schools in Burundi aged between 7 and 11 years |
| 7 months | High |
| (Cambodia) | The study was a double‐blind cluster‐randomised, placebo‐controlled trial conducted among a total of 2440 school‐going children aged 6‐16 years. |
| 6 months | High |
| Non‐randomised studies (controlled before‐and‐after studies) | ||||
| (Bangladesh) | 870 women aged 15‐49 years excluding severe anaemia (435/group) at baseline and 800 (400/group) at end line |
| 12 months | High |
| (Brazil) | 131 non‐anaemic children between 2 and 6 years old, of both genders, participated in the study. |
| 4 months | High |
| (Thailand) | 2250 children aged 1.5‐9 years from 29 villages |
| 4 years | High |
| (Brazil) | 303 children 2‐5 years of age attending 2 public schools in City of Sobral‐Ceará, in the northeast of Brazil, between August and December 2010 |
| 18 weeks | High |
| Non‐randomised studies (controlled cross‐sectional study) | ||||
| (Philippines) | 574 children aged between 3 and 18 years 2188 Government employees with their families 1416 military personnel (clinical assessment limited to 350 in the experimental group and 116 in the control group) |
| 8 months | High |
| CBA: controlled before‐and‐after study; Hb: haemoglobin; RCT: randomised controlled trial | ||||
| Study | Place | Race/ethnicity | Occupation | Gender | Religion/ culture/education | Socio‐economic status | Social status | Others/ disability/ age/ sexual orientation | Overall PROGRESS‐Plus |
| Metro Manila, Division Pasig; Philippines | No specific mention, apart from the locality of the school in the capital city | School children | Male 99 + female 81 | No religion mentioned; children going to San Joaquin Elementary School (public) | Not mentioned | Not mentioned | Anaemic children; sexual orientation not mentioned | This study was carried out among 180 anaemic children going to a government elementary school. | |
| Vulnerable Group | Not mentioned specifically, however, they were the local resident women. | It included professional workers, | Non‐pregnant women aged 15‐49 years | No religion mentioned; nearly 25% without any education | No direct estimate provided; however, most of the study participants were from lower socioeconomic strata | Not mentioned | Women with severe anaemia were excluded. Sexual orientation is not mentioned | The study was carried out among 870 women of reproductive age and local residents of Bangladesh | |
| Brazil | Not specified | School‐going children | No religion mentioned, attending philanthropic schools | Not mentioned | Not mentioned | Children, 2‐6 years old | This study was carried out in 2 public schools among non‐anaemic children 2‐6 years of age during 4 consecutive months. | ||
| Chiang Mai villages in tile valley of the Ping River, Thailand | Thai children | Children in the community | Male 1121 + female 1109 | No religion mentioned. Children in the study villages | Not mentioned | Low/middle | Normal children; sexual orientation not mentioned | The study included 2230 children attending pre‐school and school from the low/middle social background | |
| Medan of North Sumatra Province, Indonesia | The majority of participants' ethnicity was Javanese and Bataknese | Teenage girls attending boarding school | Female | There is mention of the Ramadan fasting month during the second week of June | The family income ranges from 4.9 million to 5.5 million Rupiahs (Approximately 340 to 390 US Dollars) | Not mentioned | Age 14‐18 years of age | This study was carried out among post‐menarchal adolescent girls attending boarding school in Indonesia. The study lasted 4 months. | |
| Morelos State, Mexico | Mexican women | Factory workers | Women only | No religion mentioned; 18‐49 years | Low/middle school | Low/middle | Anaemic women; sexual orientation not mentioned | This study included women with altitude‐adjusted Hb concentrations between 105 | |
| India | Iron and vitamin A‐depleted 5‐8‐year‐old children attending a subsidised lunch feeding programme | Children attending a school‐based feeding programme | Not specified | Not reported | Not reported | Not mentioned, although programme is subsidised | 5‐8 years of age | This study included 222 children aged 5‐8 years attending a school where there was a subsidised lunch feeding programme in India receiving a 200‐250 g meal of cooked rice daily. | |
| Baton Rouge, USA | In the iron‐fortified group: 4 white, 3 black or African‐American, 1 Asian, 1 other; in the unfortified rice group: 3 white, 2 black or African American, 1 Asian | Women only | Not reported | Not mentioned | Not mentioned | 18‐50 years of age | This study included women with iron‐deficiency anaemia recruited through web and phone interviews and then in a clinic. | ||
| Franciscan primary school serving the | Indian | School‐going children | Not mentioned | 6‐13 years | Low | Low | Children with iron deficiency; sexual orientation not mentioned | Study included children having iron deficiency from an urban slum neighbourhood in India, belonging to low socioeconomic status and low social class | |
| Public schools in City of Sobral‐Ceará, in the northeast of Brazil | Not reported | School‐going children | Fortified rice group: 65 male: 73 female; unfortified rice group: 79 male: 86 female | 2‐5 years of age | Not reported. Family income 300 USD or less (it is unclear if this is weekly or monthly income ‐ not reported). 126/138 participants from iron‐fortified group versus 154/165 participants from unfortified group. | Not mentioned | Children 2‐5 years of age. Other information not reported | This before‐and‐after study included children 2‐5 years of age from 2 public schools in northeast Brazil receiving the school lunch programme and the fortified/unfortified intervention once a week. | |
| The study was carried out in Muyinga Province in Burundi catering to mainly agrarian population | Burundians | School‐going children | Female: 51.1% in intervention arm, 55.3% in control arm | Religion was not mentioned. 7‐11 years | Mean socioeconomic status score quintile = 3.03 (1.45) for intervention arm and 2.97 (1.37) for control arm | Not mentioned | Children with Hb level 70‐110 g/L and those who had not taken any nutritional supplements during the past 1 month since commencement of the study were included. Sexual orientation is not mentioned. | This cluster‐RCT included 904 children who were mild to moderately anaemic from the selected schools of Burundi and mainly with an agricultural background. | |
| The study was carried out in Kampung Speu Province of Cambodia | Cambodians | School‐going children | Male and female participants had equal representation (50% each) | 6‐16 years | Not mentioned | Not mentioned | Excluding severely anaemic children. All in the eligible age group were included in the study. Sexual orientation not mentioned | The cluster‐RCT included children from selected schools of Cambodia in KamPong Speu province with rice farming as a predominant occupation and income source. | |
| Satun province, west coast of southern Thailand | Thai Muslims | School children | Male, 98 + female 105 | Majority Muslim, age group of 7‐12 years | Low | Low/middle | Children with zinc deficiency; sexual orientation not mentioned | This study included school‐going children from low socioeconomic status and having zinc deficiency in Thailand. | |
| Muang District, Satun Province of southern Thailand | Thai Muslims | School Children | Males, 24 and females, 26 | Majority Muslims in the age group 8‐12 years | Low | Low/middle | Children who had consumed the triple‐fortified rice before or showed clinical symptoms of VAD (Bitots spot or ocular signs of xerophthalmia) or serum retinol values of < 0.7m mol/L were | This study included school‐going children from low socioeconomic status and having zinc deficiency in Thailand. | |
| Village of Keesara; Andhra Pradesh State in India | Indian | School children | Male 56 + female 90 | No mention of religion; age group of 5‐11 years | Low/middle | Low/middle | Anaemic children; sexual orientation not mentioned | The study included anaemic children from low‐middle socioeconomic background belonging to a rural area in India. | |
| Bataan, Philippines | Filipinos | Children and military personnel | Male and female, but proportions not reported | No mention of religion or education | Children lived in a welfare institution; military personnel were fully employed | Not mentioned | No exclusions were reported; sexual orientation was not mentioned | The study was conducted among children living in a welfare institution and among military personnel in the Philippines. | |
| Primary schools in | Indians | School children | Male 47%, female 53% | Hindu > Christians > Muslim; 6‐12 years | Low/middle school | Low | Anaemic children; sexual orientation not mentioned | This study included anaemic school going children from low socioeconomic background from an urban area India. | |
| Hb: haemoglobin; RCT: randomised controlled trial | |||||||||
| Study | Elemental iron (mg) | Vitamin Aa (mg) | Zinc (mg) | Folic acid (µg) | Vitamin B1 (thiamin) (mg) | Vitamin B2 (riboflavin) (mg) | Vitamin B3 (niacin) (mg) | Vitamin B6 (pyridoxine) (mg) | Vitamin B12 (cobalamin) (µg) |
| 6.25 | ‐ | ‐ | ‐ | ‐ | ‐ | ‐ | ‐ | ‐ | |
| Ara 2019 (CBA) | 6 | 0.15 | 4.00 | 130 | 0.40 | 1.0 | |||
| Della Lucia 2016 (CBA) | 8.4 | ‐ | 4.20 | 144 | 0.72 | ‐ | ‐ | ‐ | ‐ |
| Gershoff 1977 (CBA) | 0.2 | 0.81 | 0.087 | 0.04 | |||||
| 0.2 | 0.81 | 0.087 | 0.04 | ||||||
| 0.2 | 0.81 | 0.087 | 0.04 | ||||||
| 10.8 | 0.28 | 5.20 | 145 | ‐ | 3.2 | ||||
| 26.6 | ‐ | ‐ | ‐ | ‐ | ‐ | ‐ | ‐ | ‐ | |
| 4 | ‐ | ‐ | ‐ | ‐ | ‐ | ‐ | ‐ | ||
| ‐ | 1.20 (as beta‐carotene) | ‐ | ‐ | ‐ | ‐ | ‐ | ‐ | ‐ | |
| ‐ | 0.18 | ‐ | ‐ | ‐ | ‐ | ‐ | ‐ | ‐ | |
| 4 | 0.18 | ‐ | ‐ | ‐ | ‐ | ‐ | ‐ | ‐ | |
| 4 | 1.20 (as beta‐carotene) | ‐ | ‐ | ‐ | ‐ | ‐ | ‐ | ‐ | |
| 18 | ‐ | ‐ | ‐ | ‐ | ‐ | ‐ | ‐ | ‐ | |
| 20 | ‐ | ‐ | ‐ | ‐ | ‐ | ‐ | ‐ | ‐ | |
| Nogueira Arcanjo 2013 (CBA) | 112.8 | ‐ | ‐ | ‐ | ‐ | ‐ | ‐ | ‐ | ‐ |
| 11.9 | ‐ | 5.70 | 400 | 1.80 | ‐ | ‐ | ‐ | ‐ | |
| 10.67 | ‐ | 3.04 | 170 | 1.06 | ‐ | ‐ | ‐ | ‐ | |
| 7.55 | 0.64 | 2.02 | 280 | 1.43 | ‐ | 12.57 | ‐ | 3.8 | |
| 7.46 | 0.29 | 3.68 | 140 | 0.69 | ‐ | 7.98 | 0.92 | 1.26 | |
| 20 | 2.10 | 18 | ‐ | ‐ | ‐ | ‐ | ‐ | ‐ | |
| 20 | 2.10 | 18 | ‐ | ‐ | ‐ | ‐ | ‐ | ‐ | |
| 15 | ‐ | ‐ | ‐ | ‐ | ‐ | ‐ | ‐ | ‐ | |
| Salcedo 1950 (CBA) | 2.86 | ‐ | ‐ | ‐ | 0.44 | ‐ | 0.33 | ‐ | ‐ |
| 12.5 | 0.50 | 3 | 75 | 0.38 | ‐ | 5 | 0.38 | 0.75 | |
| 6.25 | 0.50 | 3 | 75 | 0.38 | ‐ | 5 | 0.38 | 0.75 | |
| C: cluster randomised; CBA: controlled before‐and‐after study | |||||||||
aOne international unit (IU) vitamin A is equivalent to 0.0003 mg of retinol, 0.0006 mg of beta‐carotene and 0.0012 mg of other pro‐vitamin A carotenoids.
Study designs
Out of the 17 included studies (28 records), twelve were RCTs (Angeles‐Agdeppa 2008; Hardinsyah 2016; Hotz 2008; Hussain 2014; Losso 2017; Moretti 2006b; Parker 2015 (C); Perignon 2016 (C); Pinkaew 2013; Pinkaew 2014; Radhika 2011; Thankachan 2012), two of which were cluster‐randomised trials (Parker 2015 (C); Perignon 2016 (C). For distinguishing them from individual randomised trials, their names are denoted with '(C)'. Five studies were controlled before‐and‐after studies (Ara 2019; Della Lucia 2016; Gershoff 1977; Nogueira Arcanjo 2013; Salcedo 1950).
Overall, eight RCTs had 2‐arms (Hardinsyah 2016; Hotz 2008; Losso 2017; Moretti 2006b; Parker 2015 (C); Pinkaew 2013; Pinkaew 2014; Radhika 2011), two studies had three arms (Angeles‐Agdeppa 2008; Thankachan 2012), and one study had five arms (including a placebo and traditional feeding intervention) as a part of the FORISCA‐UltraRice+NutriRice study (Perignon 2016 (C)). One RCT had six arms with five fortification groups in addition to control group (Hussain 2014). The studies had various types of randomisation procedures, sequence generation, allocation concealment, blinding as described in Characteristics of included studies.
One before‐and‐after study had five arms (Gershoff 1977) and four had two arms (Ara 2019; Della Lucia 2016; Nogueira Arcanjo 2013; Salcedo 1950).
Settings
Twelve studies were carried out in Asia, four in the Americas and one in Africa. The studies in Asia were carried out in Bangladesh (Ara 2019), Cambodia (Perignon 2016 (C)), India (Hussain 2014; Moretti 2006b; Radhika 2011; Thankachan 2012), Indonesia (Hardinsyah 2016), Philippines (Angeles‐Agdeppa 2008; Salcedo 1950) and Thailand (Gershoff 1977; Pinkaew 2013; Pinkaew 2014). The four studies in the Americas were conducted in Brazil (Della Lucia 2016; Nogueira Arcanjo 2013), Mexico (Hotz 2008) and in the USA (Losso 2017). The study in Africa was conducted in Burundi (Parker 2015 (C)). The Indian studies had school children in an urban area (Thankachan 2012), urban slum (Moretti 2006b), and rural school setting (Radhika 2011). The Mexican study (Hotz 2008), recruited women from six factories without any specific mention of ethnicity or race. The studies from the Philippines had urban school children in Manila (Angeles‐Agdeppa 2008), and children from a welfare institution and military personnel (Salcedo 1950). The study in Burundi was conducted among rural school age children from Muyinga Province (Parker 2015 (C)). The study in Cambodia was among rural school children in Kampung Speu (Perignon 2016 (C)), while the Indonesian study included teenage girls from a boarding school in the area of Medan (Hardinsyah 2016).
Malaria endemicity
One study reported that it was conducted in a malaria‐endemic area (Parker 2015 (C)). Four studies reported to be from non‐endemic areas for malaria (Angeles‐Agdeppa 2008; Moretti 2006b; Perignon 2016 (C); Thankachan 2012). Other studies did not report on endemicity for malaria (Ara 2019; Della Lucia 2016; Gershoff 1977; Hardinsyah 2016; Hotz 2008; Hussain 2014; Losso 2017; Nogueira Arcanjo 2013; Pinkaew 2013; Pinkaew 2014; Radhika 2011; Salcedo 1950).
Participants
The 17 included studies had a total of 10,483 participants. The controlled before‐and‐after studies were conducted in children aged two to six years of age (Della Lucia 2016; Nogueira Arcanjo 2013), 18 months to nine years of age (Gershoff 1977), and one was among women aged between 15 and 49 years (Ara 2019). One controlled before‐and‐after study was on infants to adults as it was prompted by clinical beriberi which cut across ages (Salcedo 1950). Among the RCTs, two were conducted among non‐pregnant, non‐lactating women 18 to 49 years of age (Hotz 2008; Losso 2017). All other included studies were carried out among preschool and school age children. RCTs involved children aged between 5 to 18 years of age (Angeles‐Agdeppa 2008; Hardinsyah 2016; Hussain 2014; Moretti 2006b; Parker 2015 (C); Perignon 2016 (C); Pinkaew 2013; Pinkaew 2014; Radhika 2011; Thankachan 2012). There were no studies reporting data exclusively on adolescents beyond the age of 12 years, adult men or pregnant women.
Anaemia prevalence
The baseline prevalence of anaemia ranged from 5% to 62% in the studies in children (Angeles‐Agdeppa 2008; Hussain 2014; Moretti 2006b; Nogueira Arcanjo 2013; Parker 2015 (C); Perignon 2016 (C); Pinkaew 2014; Radhika 2011; Thankachan 2012), and around 21% (intervention: 21.4 %; control: 20.4%) in one study among women (Hotz 2008), while the other study on women included women with iron deficiency as determined by serum ferritin or serum iron value, or both (Losso 2017). The study done on teenagers (Hardinsyah 2016), had a baseline anaemia level of 34%. Two studies from India had an anaemia prevalence of around 40% and above (Radhika 2011; Thankachan 2012). A third study from India reported iron‐deficiency anaemia of around 30% suggesting a much higher anaemia rate (Moretti 2006b). The two studies that included only anaemic children reported 38% (Parker 2015 (C)), and 45% (Angeles‐Agdeppa 2008), during screening. Three studies had an anaemia prevalence between 10% to 18% (Perignon 2016 (C); Pinkaew 2013; Pinkaew 2014). The controlled before‐and‐after study Ara 2019 had a baseline level of anaemia of 42%.
Stunting
In total, five studies reported on stunting at baseline ranging from 12% to 40% (Angeles‐Agdeppa 2008; Perignon 2016 (C); Pinkaew 2014; Radhika 2011; Thankachan 2012), one study reported less than 10% stunting in both intervention and control arms (Hussain 2014). Two studies reported the height‐for‐age Z‐score (Moretti 2006b; Pinkaew 2013) as −1.3 and −0.8 respectively. One study (Perignon 2016 (C)), reported both: 40% stunting; −1.75 Z‐score). None of the studies restricted inclusion of participants or analysed their data based on stunting status.
Occupation
Thirteen studies had preschool or school‐going children as participants (Angeles‐Agdeppa 2008; Della Lucia 2016; Gershoff 1977; Hardinsyah 2016; Hussain 2014; Moretti 2006b; Nogueira Arcanjo 2013; Parker 2015 (C); Perignon 2016 (C); Pinkaew 2013; Pinkaew 2014; Radhika 2011; Thankachan 2012). One study had women factory workers (Hotz 2008), and another did not mention the occupation of the participants (Losso 2017). The Ara 2019 study had mostly housewives (> 70% in each of the groups) followed by unskilled workers (˜7.82% to 11.26%).
Sex
Gender allocation was reported in all but three studies (Hussain 2014; Moretti 2006b; Salcedo 1950). All the three studies among adults included all women (Ara 2019; Hotz 2008; Losso 2017). There were no differences in gender between treatment groups at baseline in any study. Six studies had more female participants (Della Lucia 2016; Parker 2015 (C); Pinkaew 2013; Pinkaew 2014; Radhika 2011; Thankachan 2012). One study was carried out among teenage girls (Hardinsyah 2016). Two studies had more male participants (Angeles‐Agdeppa 2008; Perignon 2016 (C)). One before‐and‐after study had roughly equal numbers (Gershoff 1977), while one had more women (Nogueira Arcanjo 2013).
Religion/culture
No specific mention was made about the religion of the study population in 12 studies (Angeles‐Agdeppa 2008; Ara 2019; Della Lucia 2016; Gershoff 1977; Hotz 2008; Hussain 2014; Losso 2017; Moretti 2006b; Nogueira Arcanjo 2013; Perignon 2016 (C); Radhika 2011; Salcedo 1950). However one of these studies (Losso 2017), had mixed ethnic background participants. One study from India (Thankachan 2012), reported that the majority of the study participants were Hindus (74% in fortification groups and 65% in control groups). Two studies from Thailand had a predominantly Muslim population (Pinkaew 2013; Pinkaew 2014). The study from Indonesia had Javanese and Bataknese ethnic participants predominantly (Hardinsyah 2016).
Socioeconomic status
The studies were conducted mostly among those with low‐socioeconomic status. Three studies from India (Moretti 2006b; Radhika 2011; Thankachan 2012), and two studies from Thailand (Pinkaew 2013; Pinkaew 2014), were carried out among children from low socioeconomic backgrounds. One study from India was in an urban area (Thankachan 2012), urban slum (Moretti 2006b), and rural area (Radhika 2011). Other studies did not specify the socioeconomic status of their participants.
Education
Twelve studies (Angeles‐Agdeppa 2008; Della Lucia 2016; Hardinsyah 2016; Hussain 2014; Moretti 2006b; Nogueira Arcanjo 2013; Parker 2015 (C); Perignon 2016 (C); Pinkaew 2013; Pinkaew 2014; Radhika 2011; Thankachan 2012), reported studies on pre‐school and school‐going children. One community‐based study (Salcedo 1950), and two other studies (Hotz 2008; Losso 2017), were on women whose educational status was not reported. One study included pre‐school children attending a day‐care centre (Gershoff 1977). In Ara 2019, nearly 25% of the study population did not have any education, the remaining participants all had primary school education and above.
Social capital
The studies did not report issues related to inequity, access to food or any particular instances of preferences of certain social classes. However, the included studies were carried out in predominantly lower socioeconomic settings.
Interventions
Micronutrient content
All studies fortified rice with iron and some studies added various additional combinations of micronutrients. Seven studies (Hardinsyah 2016; Hussain 2014; Parker 2015 (C); Perignon 2016 (C); Pinkaew 2013; Pinkaew 2014; Thankachan 2012), and four controlled before‐and‐after studies fortified with multiple micronutrients (Ara 2019; Della Lucia 2016; Gershoff 1977; Salcedo 1950). Among them, six studies (Hardinsyah 2016; Parker 2015 (C); Perignon 2016 (C); Pinkaew 2013; Pinkaew 2014; Thankachan 2012), compared the effectiveness of multiple‐micronutrient‐fortified rice with that of unfortified rice. One RCT reported different micronutrients and their effects on each arm, compared with the control arm, which received unfortified rice (Hussain 2014), in which out of five intervention arms, one arm each received iron alone, beta carotene, retinyl palmitate, iron plus retinyl palmitate and iron plus beta carotene. Five studies (Angeles‐Agdeppa 2008; Hotz 2008; Losso 2017; Moretti 2006b; Radhika 2011), and one controlled before‐and‐after study (Nogueira Arcanjo 2013), included iron alone for rice fortification (with various quantities of iron and its compounds).
For the RCTs with multiple micronutrients, two studies (Pinkaew 2013; Pinkaew 2014), reported rice fortified with three micronutrients (iron, zinc and vitamin A); one study (Parker 2015 (C)), with four micronutrients (iron, zinc, thiamine and folic acid) and two (Hardinsyah 2016; Perignon 2016 (C)), with four or more micronutrients. All the multiple micronutrient studies had an arm with at least iron and zinc. One study (Gershoff 1977), reported the field effect of consumption of rice fortified with lysine, threonine, thiamin, riboflavin, vitamin A and iron. One study (Thankachan 2012), compared the effectiveness of high iron (12.5 mg/100 g natural rice) with that of low iron (6.25 mg/100 g of natural rice) fortification, along with vitamin A, thiamine, niacin, vitamin B6, vitamin B12, folate, iron and zinc and no fortification of rice. Another study (Angeles‐Agdeppa 2008) compared the effectiveness of ferrous sulphate‐fortified rice and micronized dispersible ferric pyrophosphate‐fortified rice with that of unfortified rice, wherein each of the three arms received in 160 g (1 cup) of cooked rice, ferrous sulphate (ExFeSO4), micronized ferric pyrophosphate (ExFeP80) or no added fortificant (control).
In all the included studies, the amount of elemental iron per 100 g of rice ranged from 0.2 mg to 112.8 mg. Vitamin A was a fortificant in three studies. The amount of vitamin A per 100 g of rice ranged from 0.15 mg (Ara 2019) to 2.1 mg (Pinkaew 2013; Pinkaew 2014). The amount of zinc per 100 g of rice ranged from 2 mg (Perignon 2016 (C)) to 18 mg (Pinkaew 2013; Pinkaew 2014). One study carried out among women had ferrous sulphate 18 mg/100 g of fortified rice for the intervention arm and unfortified rice for the control arm (Losso 2017). Fortification details per 100 g of uncooked rice are given in Table 4.
Rice fortification method
One study reported using extrusion as a fortification method without indicating the temperature (Angeles‐Agdeppa 2008). Seven studies used hot‐extrusion process only (Ara 2019; Hardinsyah 2016; Moretti 2006b; Parker 2015 (C); Pinkaew 2013; Pinkaew 2014; Thankachan 2012), and three studies reported a cold extrusion process only (Della Lucia 2016; Hotz 2008; Radhika 2011). One study included 2 arms with hot extrusion and one arm with cold extrusion (Perignon 2016 (C)). Three studies reported using coating in the fortification (Gershoff 1977; Losso 2017; Salcedo 1950), and two studies did not report the method (Hussain 2014; Nogueira Arcanjo 2013).
Iron compounds
The included studies used three types of iron compounds. The before‐and‐after study (Gershoff 1977) used ferric phosphate tetrahydrate. One study (Angeles‐Agdeppa 2008), used ferrous sulphate as one of two iron fortificants. Nine studies that were part of the meta‐analysis used ferric pyrophosphate. Micronized iron reduces the particle size to promote absorption. Two studies used a micronized ferric pyrophosphate, which had a particle size of 0.3 μm and was encapsulated (Angeles‐Agdeppa 2008; Hotz 2008). One study, which used cold extrusion, reported a particle size of 3.1 μm (Radhika 2011). Five studies described the iron used as micronized ground ferric pyrophosphate (Moretti 2006b; Perignon 2016 (C); Pinkaew 2013; Pinkaew 2014; Thankachan 2012), and three of these specified the particle size as 2.5 μm (Moretti 2006b; Pinkaew 2013; Pinkaew 2014). One study described the iron compound as ferric pyrophosphate without any reference to micronization or particle size (Parker 2015 (C)). Other studies had micronized ground ferric pyrophosphate with 4 mg iron (Hussain 2014), 10 mg iron (Pinkaew 2014), 11.8 mg per 100 g (Parker 2015 (C)); 10.6 mg per 11 g rice for cold‐extruded and 7.5 mg per 100 g rice for hot‐extruded (Perignon 2016 (C)), 20 mg iron (Moretti 2006b; Hotz 2008), 0.8% by weight (Gershoff 1977). One study on women reported ferrous sulphate as the iron compound used (Losso 2017). Two studies did not specify the iron compound (Ara 2019; Hardinsyah 2016).
Cooking methods
In three studies, rice was washed prior to cooking (Angeles‐Agdeppa 2008; Moretti 2006b; Radhika 2011). However, the manner of cooking was not described in sufficient detail to categorise based on the protocol for this review. In (Moretti 2006b), in addition to rice being washed in preparation for cooking, rice portions were cooked with seasoning ingredients in household pressure cookers for 8 min after reaching peak pressure, after which pressure was released. Test servings contained 35 g cooked rice.
One study used the absorption method of cooking rice (Perignon 2016 (C); author correspondence). Lunch menus were prepared in rotating order and usually consisted of rice together with chicken or fish and occasionally with vegetables. The schools also provided free milk (200 mL) daily to all children. Weekly iron supplementation, which had been given to the children by health officers or village health volunteers before the intervention, was not provided during the intervention. This was to improve the chance of showing an improvement in iron status even though it was not the primary outcome measure (Pinkaew 2014). In Burundi, parent committees performed all the cooking (Parker 2015 (C)). The other studies did not describe the manner of cooking rice.
All but one study (Parker 2015 (C)), described the accompanying dishes or menu. The study on female teenagers (Hardinsyah 2016), reported the cooking methods as pouring one sack of fortified rice into a plastic bucket to wash the rice, and steaming for about one hour until the rice was cooked well. One study (Losso 2017), was done as a pilot among women from the Baton Rouge area (Louisiana (LA), USA), wherein they tested the iron retention of fortified rice by several methods of cooking; however there was no description of the type cooking used for the clinical study. Similarly, Ara 2019 did not specify the method of cooking.
Comparisons
Rice fortified with iron alone or in combination with other micronutrients versus unfortified rice (no micronutrients added)
Twelve studies (2201 participants) made this comparison.
Rice fortified with iron alone or in combination with other micronutrients versus no intervention
No studies contributed data to this comparison.
Rice fortified with vitamin A alone or in combination with other micronutrients versus unfortified rice (no micronutrients added)
One study (74 participants) made this comparison, having a vitamin A‐only arm versus a control arm.
Rice fortified with vitamin A alone or in combination with other micronutrients versus no intervention
No studies contributed data to this comparison.
Rice fortified with zinc alone or in combination with other micronutrients versus unfortified rice (no micronutrients added)
No studies contributed data to this comparison.
Rice fortified with zinc alone or in combination with other micronutrients versus no intervention
No studies contributed data to this comparison.
Rice fortified with folic acid alone or in combination with other micronutrients versus unfortified rice (no micronutrients added)
No studies contributed data to this comparison.
Rice fortified with folic acid alone or in combination with other micronutrients versus no intervention
No studies contributed data to this comparison.
Outcome
Of the 12 RCTs included in the meta‐analysis, seven reported on anaemia (Angeles‐Agdeppa 2008; Hardinsyah 2016; Hotz 2008; Parker 2015 (C); Perignon 2016 (C); Radhika 2011; Thankachan 2012). Five out of the twelve RCTs used WHO thresholds to define anaemia based on serum haemoglobin concentrations (Hb) (Hardinsyah 2016; Moretti 2006b; Parker 2015 (C); Perignon 2016 (C); Radhika 2011), three used a cut‐off level but did not mention the cut‐off criteria (Angeles‐Agdeppa 2008, Pinkaew 2013Thankachan 2012), one RCT (Hotz 2008), used CDC 1989 criteria and three RCTs did not report the cut‐off used to define anaemia (Hussain 2014; Losso 2017; Pinkaew 2014). Among the included non‐randomised studies, three mentioned Hb cut‐off to define anaemia, but did not specify the criteria (Ara 2019; Della Lucia 2016; Gershoff 1977), one used WHO criteria (Nogueira Arcanjo 2013), and one study did not report a Hb cut‐off (Salcedo 1950). The details of the cut‐off used in each included study are given in Table 5. We used data from these studies in the meta‐analysis irrespective of the criteria used by them to define anaemia. Three studies reported iron‐deficiency anaemia (Moretti 2006b; Radhika 2011; Thankachan 2012); however we did not use these data in quantitative synthesis.
| Study | Haemoglobin threshold (g/L) | Criteria |
| Anaemia was defined as haemoglobin concentration in blood < 120 g/L | Not mentioned | |
| < 120 g/L in non‐pregnant and non‐lactating women | Not mentioned | |
| ≥ 110 g/L was used as a cut off for including children in the study. Anaemia was not defined | Not reported | |
| Haemoglobin levels were categorised as deficient < 100, low 100‐90 (g/L) | Not mentioned | |
| Severe anaemia: < 80 g/L; moderate anaemia: 80‐109 g/L; mild anaemia: 110‐119 g/L; non anaemia: ≥ 120 g/L | WHO (WHO 2011a) | |
| < 122 g/L, adjusted for average altitude of the study sites (1100 m) with the use of an equation | CDC (CDC 1989) | |
| < 110 g/L and severely anaemic (Hb < 75 g/L) were excluded | Not mentioned | |
| Not reported (iron‐deficiency anaemia was defined based on iron and ferritin levels in serum) | Not reported | |
| < 115 g/L in children aged 5–11 years | WHO (WHO 2001) | |
| < 110 g/L in children < 5 years of age | WHO (WHO 2001) | |
| For school‐aged children at 1500 m above sea level, mild anaemia was defined as Hb 115‐119 g/L, moderate anaemia Hb 85‐114 g/L, and severe anaemia Hb < 85 g/L | WHO (WHO 2011f) | |
| < 115 g/L for children aged 6‐11 years, < 120 g/L for children aged 12‐14 years and girls aged ≥ 15 years and < 130 g/L for boys aged ≥ 15 years | WHO (WHO 2001) | |
| < 120 g/L | Not mentioned | |
| Not reported | Not reported | |
| In children aged 5–11 years, anaemia (mild to moderate) was defined as Hb 70‐115 g/L. | WHO (WHO 2001) | |
| Not reported | Not reported | |
| < 115 g/L in children aged 6–11 years and < 120 g/L in participants aged ≥ 12 years | Not mentioned | |
| CDC: Centers for Disease Control and Prevention; Hb: haemoglobin; WHO: World Health Organization | ||
Nine studies reported iron deficiency (Angeles‐Agdeppa 2008; Hardinsyah 2016; Hotz 2008; Hussain 2014; Moretti 2006b; Perignon 2016 (C); Pinkaew 2013; Radhika 2011; Thankachan 2012); we included eight in the meta‐analysis. We did not include data from Hussain 2014 because the subgroup‐specific details were not available for further analysis.
To evaluate iron deficiency, seven studies used plasma ferritin concentrations (Angeles‐Agdeppa 2008; Hotz 2008; Hussain 2014; Losso 2017; Moretti 2006a; Radhika 2011; Thankachan 2012), four studies used serum transferrin receptor concentrations (Hotz 2008; Losso 2017; Moretti 2006bThankachan 2012), wherein two studies (Moretti 2006a; Thankachan 2012), used and reported both these parameters.
Eleven studies reported mean haemoglobin concentrations (Angeles‐Agdeppa 2008; Hardinsyah 2016; Hotz 2008; Hussain 2014; Losso 2017; Moretti 2006b; Parker 2015 (C); Perignon 2016 (C); Pinkaew 2013; Radhika 2011; Thankachan 2012), four studies evaluated vitamin A deficiency (Hardinsyah 2016; Perignon 2016 (C); Pinkaew 2014; Thankachan 2012), and one study reported plasma folate concentration (Hardinsyah 2016). One study reported the level of diarrhoea (Thankachan 2012). No studies compared the groups for respiratory infections (as measured by study authors) or all‐cause death in their outcomes. One study reported on hookworm infection (Perignon 2016 (C)). One study reported abdominal pain (Thankachan 2012). No studies reported congenital anomalies or miscarriage (no studies were carried out among pregnant women). Five studies reported serum retinol (Angeles‐Agdeppa 2008; Hardinsyah 2016; Pinkaew 2013; Pinkaew 2014; Thankachan 2012), three studies reported plasma zinc concentration (Hardinsyah 2016; Pinkaew 2014; Thankachan 2012).
One study (Moretti 2006b), reported anthropometric measurements (weight‐for‐age, height‐for‐age, weight‐for‐height in terms of Z‐score) whereas Angeles‐Agdeppa 2008 reported prevalence of wasting and stunting. No studies compared the risk of iron overload (defined by serum ferritin higher than 150 µg/L in women and higher than 200 µg/L in men), clinical and severe malaria, night blindness (defined as the inability to see after dusk by people who typically report having normal vision during the day; only for vitamin A fortified rice as an intervention), across the groups
The controlled before‐and‐after studies reported biochemical outcomes relevant to iron, vitamin A, zinc and folate in addition to clinical outcomes such as beriberi (Della Lucia 2016; Gershoff 1977; Nogueira Arcanjo 2013; Salcedo 1950). In Ara 2019, they included anaemia, mean haemoglobin (g/L), zinc deficiency (< 10.1 mmol/L), mean serum zinc (mmol/L), morbidity (last two weeks), diarrhoea, fever and inflammation (CRP >10.0 mg/L) as the outcomes. Gershoff 1977 study reported the effect of consumption of rice fortified with multiple vitamins, however they did not report the total number of outcomes in the entire study population, hence their report did not reach the stage of meta‐analysis.
Sources of funding
Most included studies were funded by one or more agencies from the government sector, private sector, academic organisations, or non‐government organisations. One study did not report the source of financial support (Losso 2017).
Angeles‐Agdeppa 2008 stated its source of funding was The International Life Sciences Institute Center for Health Promotion of Japan (ILSI CHP, Japan), and the ILSI CHP, Atlanta, USA. Taiyo Kagaku, Japan donated the necessary fortificant used in this study.
DSM Nutritional Products (India) provided fortified rice for Thankachan 2012. Another study, Gershoff 1977, reported that they were supported in part by the United States Agency for International Development and the Fund for Research and Teaching, Department of Nutrition, Harvard School of Public Health. Also, that Ajinomoto Company, Tokyo, Japan supplied the rice fortification grains.
Two RCTs (Pinkaew 2013; Pinkaew 2014), were supported by Medicor Foundation (Triesen, Liechtenstein), the Royal Thai Government Scholarship. Also, Pinkaew 2014 study was supported by the International Atomic Energy Agency (Vienna, Austria). The Micronutrient Initiative, Ottawa, Canada, along with the Swiss Federal Institute of Technology, Zurich, Switzerland, and St John’s Academy of Health Sciences, Bangalore, India supported Moretti 2006b and Dr. Paul Lohmann (GmbH, Emmerthal, Germany) provided the iron and zinc compounds, and DSM Nutritional Products Ltd. (Basel, Switzerland) provided the vitamin A compound for Moretti 2006b; Pinkaew 2013; and Pinkaew 2014. Radhika 2011 was funded by the Department of Biotechnology, New Delhi, India. The Program for Appropriate Technology in Health (PATH), Seattle, USA provided the Ultra Rice premix for them. United States Department of Agriculture (USDA) and the Open Road Alliance funded one study (Parker 2015 (C)). USDA, the World Food Programme‐DSM Consortium, and the Institut de Recherce pour le Development (IRD) supported Perignon 2016 (C).
A subcontract grant from PATH through an original grant from Bill & Melinda Gates Foundation provided the funding for Hotz 2008. The Food and Nutrition Society of Indonesia supported Hardinsyah 2016. Williams‐Waterman Fund Committee of the Research Corporation, New York City funded Salcedo 1950, and Hoffmann‐LaRoche, Inc., Nutley, New Jersey, USA donated the premix that they used. Della Lucia 2016 had financial support from O Programa Institucional de Bolsas de Iniciação Científica e Tecnológica da (PROBIC/FAPEMIG), PIBIC/CNPq and FAPEMIG and PATH donated the fortified rice. The United Nations World Food Programme (Grant # 1209) funded the study conducted in Bangladesh by Ara 2019
Excluded studies
We excluded 28 articles from 22 studies after assessing the full‐text articles. The details of excluded studies along with the reasons for exclusion are given in Characteristics of excluded studies.
See Figure 2 for reasons for excluding the articles. Nine studies were related to a different type of intervention or rice was not the medium of intervention (Arsenault 2010; Bagni 2009; Barboza 2011; Castro 2017; Finkelstein 2013; Graham 2007; Haskell 2005; Sridevi 2013; Vitolol 1998), six studies with participants outside the age range of interest (Beinner 2010; Ma 2016; Nogueira Arcanjo 2012; Pham 2012; Skau 2015; Walter 1993); five studies with different type of study design (Ando 2012; Angeles‐Agdeppa 2011; Florentino 1998; Huo 2014; Kagawa 2017), and two studies had insufficient information (Hyun 2015; Pham Van 2013).
We have provided details of two ongoing studies in Characteristics of ongoing studies table.
Risk of bias in included studies
We used standardised domains to assess the risk of bias of included studies (including individually and cluster‐randomised trials) (Higgins 2019). We assessed the primary outcomes for risk of bias at the study level. We considered additional domains for risk of bias among the cluster‐RCTs. We presented them in the 'Risk of bias' table in the Characteristics of included studies section, and give a summary of the ’Risk of bias’ analyses in Figure 3 and Figure 4. Among the 12 RCTs contributing to the meta‐analysis, two studies had a low overall risk of bias (Moretti 2006b; Radhika 2011), having low risk in allocation concealment, differences in baseline outcome measures, and incompleteness of outcome data. We assessed all other RCTS to be at high overall risk of bias. The five controlled before‐and‐after studies had high or unclear risk of bias for most domains (Ara 2019; Della Lucia 2016; Gershoff 1977; Nogueira Arcanjo 2013; Salcedo 1950). Two of these studies had a documented difference in baseline outcome measures (Della Lucia 2016; Nogueira Arcanjo 2013). Also, Ara 2019 had different baseline and end‐line populations.

'Risk of bias' summary: review authors' judgements about each 'Risk of bias' item for each included study
Four studies were controlled before‐and‐after studies (Ara 2019; Della Lucia 2016; Gershoff 1977; Nogueira Arcanjo 2013), and one was a controlled cross‐sectional study (Salcedo 1950)

'Risk of bias' graph: review authors' judgements about each 'Risk of bias' item presented as percentages across all included studies
Allocation
Sequence generation
We noted three studies adequately describing the sequence generation for the recruitment of study participants in their respective studies (Hotz 2008; Perignon 2016 (C); Thankachan 2012), and we graded them to be at low risk of bias. We assessed four studies at high risk of bias for not having random sequence generation (Ara 2019; Della Lucia 2016; Gershoff 1977; Salcedo 1950), and 10 studies to be at unclear risk (Angeles‐Agdeppa 2008; Hardinsyah 2016; Hussain 2014; Losso 2017; Moretti 2006b; Nogueira Arcanjo 2013; Parker 2015 (C); Pinkaew 2013; Pinkaew 2014; Radhika 2011); all four studies at high risk of bias for random sequence generation were before‐and‐after comparison studies.
Allocation concealment
Five studies reported allocation concealment completely in their methods (Della Lucia 2016; Hardinsyah 2016; Moretti 2006b; Perignon 2016 (C); Radhika 2011), and we assessed them to be at low risk of bias. Six studies did not effectively conceal allocation (Angeles‐Agdeppa 2008; Ara 2019; Gershoff 1977; Pinkaew 2013; Pinkaew 2014; Salcedo 1950), and we assessed them at high risk of bias, and six studies were at unclear risk (Hotz 2008; Hussain 2014; Losso 2017; Nogueira Arcanjo 2013; Parker 2015 (C); Thankachan 2012).
Similarity of baseline characteristics
We assessed 13 studies to be at low risk of bias for similarity of baseline characteristics (Angeles‐Agdeppa 2008; Ara 2019; Hardinsyah 2016; Hotz 2008; Hussain 2014; Losso 2017; Moretti 2006b; Nogueira Arcanjo 2013; Pinkaew 2013; Pinkaew 2014; Radhika 2011; Salcedo 1950; Thankachan 2012). Two studies were at high risk of bias (Gershoff 1977; Perignon 2016 (C)), and two studies were at unclear risk (Della Lucia 2016; Parker 2015 (C)).
Overall, seven studies were at high risk of selection bias (Angeles‐Agdeppa 2008; Ara 2019; Gershoff 1977; Perignon 2016 (C); Pinkaew 2013; Pinkaew 2014; Salcedo 1950) with high risk of bias in any one of the domains of selection bias.
For similarity of baseline outcome measurements, nine studies were at low risk of bias (Angeles‐Agdeppa 2008; Hotz 2008; Hussain 2014; Losso 2017; Moretti 2006b; Pinkaew 2013; Pinkaew 2014; Radhika 2011; Thankachan 2012), seven studies were at high risk of bias (Ara 2019; Della Lucia 2016; Gershoff 1977; Hardinsyah 2016; Nogueira Arcanjo 2013; Parker 2015 (C); Perignon 2016 (C)), and we assessed one study as unclear risk of bias (Salcedo 1950).
Blinding
Eight studies described the blinding process for the participants adequately and we graded them to be at low of bias in blinding the participants (Angeles‐Agdeppa 2008; Hardinsyah 2016; Losso 2017; Moretti 2006b; Nogueira Arcanjo 2013; Perignon 2016 (C); Radhika 2011; Thankachan 2012), five studies were at low risk of bias in blinding the outcome assessment (Angeles‐Agdeppa 2008; Moretti 2006b; Nogueira Arcanjo 2013; Radhika 2011; Thankachan 2012), and seven studies were at low risk in terms of contamination (Ara 2019; Hardinsyah 2016; Hussain 2014; Losso 2017; Nogueira Arcanjo 2013; Parker 2015 (C); Perignon 2016 (C)). Overall, four studies (Hardinsyah 2016; Losso 2017; Nogueira Arcanjo 2013; Perignon 2016 (C)), were at low risk of performance bias and five studies gave an account of blinding the outcome assessors which we assessed to be at low risk of detection bias (Angeles‐Agdeppa 2008; Moretti 2006b; Nogueira Arcanjo 2013; Radhika 2011; Thankachan 2012).
We assessed 13 studies at unclear risk of blinding. Two studies were at unclear risk of blinding the participants and personnel (Della Lucia 2016; Parker 2015 (C)), six studies for blinding of outcome assessment (Della Lucia 2016; Hardinsyah 2016; Hussain 2014; Perignon 2016 (C); Pinkaew 2013; Pinkaew 2014), and nine studies for contamination (Della Lucia 2016; Gershoff 1977; Hotz 2008; Moretti 2006b; Pinkaew 2013; Pinkaew 2014; Radhika 2011; Salcedo 1950; Thankachan 2012).
Ten studies were at high risk of blinding. Seven studies were at high risk of blinding of the participants (Ara 2019; Gershoff 1977; Hotz 2008; Hussain 2014; Pinkaew 2013; Pinkaew 2014; Salcedo 1950), six studies for blinding of outcome assessment (Ara 2019; Gershoff 1977; Hotz 2008; Losso 2017; Parker 2015 (C); Salcedo 1950), and one study was at high risk of contamination (Angeles‐Agdeppa 2008).
Incomplete outcome data
We assessed 11 studies to be at low risk of bias for completeness of outcome data (Angeles‐Agdeppa 2008; Hardinsyah 2016; Hussain 2014; Losso 2017; Moretti 2006b; Nogueira Arcanjo 2013; Perignon 2016 (C); Pinkaew 2013; Pinkaew 2014; Radhika 2011; Thankachan 2012), and they reported minimum loss to follow‐up rates among the study participants. Two studies were at high risk of bias (Hotz 2008; Salcedo 1950), because of high rates of dropout from the study, and we assessed four studies at unclear risk of bias due to inadequate description of attrition (Ara 2019; Della Lucia 2016; Gershoff 1977; Parker 2015 (C)).
Selective reporting
There was no indication of selective reporting by any of the studies from published records, however we did not have access to the study protocols. Ten studies reported all of their pre‐specified outcomes, including the insignificant ones, and we assessed them to be at low risk of bias (Angeles‐Agdeppa 2008; Ara 2019; Losso 2017; Moretti 2006b; Parker 2015 (C); Perignon 2016 (C); Pinkaew 2013; Pinkaew 2014; Radhika 2011; Thankachan 2012); one of these studies provided a study registration number for the protocol (Pinkaew 2014). We assessed one study at high risk of reporting bias because the study participants were given rewards for maintaining highest attendance in the schools in which the attendance rate was not steady (Hardinsyah 2016). We assessed six studies to be at unclear risk of bias (Della Lucia 2016; Gershoff 1977; Hotz 2008; Hussain 2014; Nogueira Arcanjo 2013; Salcedo 1950)
Other potential sources of bias
We could not identify other potential sources of bias in the included studies. For some studies, industry provided the fortificants or the rice fortification grains. We assessed three studies to be at low risk of bias (Angeles‐Agdeppa 2008; Parker 2015 (C); Perignon 2016 (C)), one study at high risk of bias (Hardinsyah 2016), and 13 studies at unclear risk of bias (Ara 2019; Della Lucia 2016; Gershoff 1977; Hotz 2008; Hussain 2014; Losso 2017; Moretti 2006b; Nogueira Arcanjo 2013; Pinkaew 2013; Pinkaew 2014; Radhika 2011; Salcedo 1950; Thankachan 2012).
We evaluated and determined additional criteria for risk of bias in cluster‐randomised studies (i.e. recruitment bias, baseline imbalance, loss of clusters, incorrect analysis, compatibility with individual RCTs) for two studies (Parker 2015 (C); Perignon 2016 (C)). Among these criteria, Perignon 2016 (C) was at unclear risk for baseline imbalance because they did not describe clusters and did not report any process of statistical adjustment for clustering. For all remaining criteria, we judged both the studies to be at low risk of bias.
Effects of interventions
See: Summary of findings for the main comparison Rice fortified with iron alone or in combination with other micronutrients compared to unfortified rice (no micronutrients added) for addressing micronutrient malnutrition among the included studies; Summary of findings 2 Rice fortified with vitamin A alone or in combination with other micronutrients compared to unfortified rice (no micronutrients added) for addressing micronutrient malnutrition
A summary of the effects of interventions is given in summary of findings Table for the main comparison and summary of findings Table 2.
We included 12 RCTs in the meta‐analysis. All 12 RCTs contained at least one arm with iron and compared with unfortified rice. No RCT had a 'no intervention' arm in their study. Of the 12 RCTs, six RCTs fortified with iron only, five RCTs fortified with iron and other micronutrients and one RCT had several fortified groups including iron only, vitamin A only and multiple micronutrients. Few of the pre‐specified outcome measures in this review were not reported by any of the included studies. We analysed the results using a random‐effects model, since all the included studies had significant heterogeneity. See Data and analyses for a detailed description of pre‐specified outcomes and their results.
We carried out sensitivity analyses for two cluster‐randomised trials (Parker 2015 (C); Perignon 2016 (C)), with different values of ICC and examined their effect on the effect estimates (RR) for two outcomes: anaemia and mean haemoglobin concentration. We observed that ICC did not change the direction of effects of interventions significantly for any outcome. We have presented the details of these sensitivity analyses in Table 6. We also carried out sensitivity analysis by excluding the single RCT (Parker 2015 (C)), with a high/unclear risk of bias in eight out of 15 domains (including the additional domains for cluster‐RCTs) for two outcomes, anaemia and mean haemoglobin.
| Outcome (all studies included in the analysis) | Study (ICC) | RR (95% CI) | Tau² | Chi² | P value | I² |
| Anaemia (Angeles‐Agdeppa 2008; Hardinsyah 2016; Hotz 2008; Parker 2015 (C); Perignon 2016 (C); Radhika 2011; Thankachan 2012) | Parker 2015 (C) (0) | 0.83 (0.64 to 1.08) | 0.06 | 16.06 | 0.01 | 63% |
| Parker 2015 (C) (0.001) | 0.83 (0.64 to 1.08) | 0.06 | 15.72 | 0.02 | 62% | |
| Parker 2015 (C) (0.002) | 0.83 (0.64 to 1.08) | 0.06 | 15.71 | 0.02 | 62% | |
| Parker 2015 (C) (0.005) | 0.83 (0.64 to 1.07) | 0.06 | 15.12 | 0.02 | 60% | |
| Parker 2015 (C) (0.01) | 0.83 (0.64 to 1.08) | 0.06 | 14.80 | 0.02 | 59% | |
| Parker 2015 (C) (0.02723) | 0.83 (0.64 to 1.07) | 0.05 | 13.08 | 0.04 | 54% | |
| Parker 2015 (C) (0.1) | 0.81 (0.64 to 1.03) | 0.04 | 10.03 | 0.12 | 40% | |
| 0.83 (0.67 to 1.03) | 0.04 | 13.17 | 0.04 | 54% | ||
| Perignon 2016 (C) (0.001) | 0.83 (0.67 to 1.04) | 0.04 | 13.15 | 0.04 | 54% | |
| Perignon 2016 (C) (0.002) | 0.83 (0.66 to 1.04) | 0.04 | 13.16 | 0.04 | 54% | |
| Perignon 2016 (C) (0.005) | 0.83 (0.66 to 1.05) | 0.04 | 13.12 | 0.04 | 54% | |
| Perignon 2016 (C) (0.01) | 0.83 (0.65 to 1.05) | 0.05 | 13.12 | 0.04 | 54% | |
| Perignon 2016 (C) (0.02723) | 0.83 (0.64 to 1.07) | 0.05 | 13.08 | 0.04 | 54% | |
| Perignon 2016 (C)( 0.1) | 0.83 (0.63 to 1.09) | 0.06 | 13.08 | 0.04 | 54% | |
| Outcome (all studies included in the analysis) | Study (ICC) | MD (95% CI) | Tau² | Chi² | P value | I² |
| Haemoglobin concentration (Angeles‐Agdeppa 2008; Hardinsyah 2016; Hotz 2008; Hussain 2014; Losso 2017; Moretti 2006b; Parker 2015 (C); Perignon 2016 (C); Pinkaew 2013; Radhika 2011; Thankachan 2012) | Parker 2015 (C) (0) | 1.69 (0.48 to 2.91) | 1.82 | 24.15 | 0.007 | 59% |
| Parker 2015 (C) (0.001) | 1.70 (0.48 to 2.92) | 1.81 | 23.90 | 0.008 | 58% | |
| Parker 2015 (C) (0.002) | 1.71 (0.49 to 2.93) | 1.81 | 23.69 | 0.008 | 58% | |
| Parker 2015 (C) (0.005) | 1.73 (0.51 to 2.96) | 1.80 | 23.18 | 0.01 | 57% | |
| Parker 2015 (C) (0.01) | 1.77 (0.54 to 3.00) | 1.79 | 22.62 | 0.01 | 56% | |
| Parker 2015 (C)) (0.02723) | 1.85 (0.61 to 3.10) | 1.77 | 21.73 | 0.02 | 54% | |
| Parker 2015 (C)) (0.1) | 1.98 (0.71 to 3.25) | 1.76 | 20.96 | 0.02 | 52% | |
| Perignon 2016 (C)) (0) | 1.85 (0.61 to 3.09) | 1.77 | 21.98 | 0.02 | 55% | |
| Perignon 2016 (C)) (0.001) | 1.85 (0.61 to 3.09) | 1.77 | 21.97 | 0.02 | 54% | |
| Perignon 2016 (C)) (0.002) | 1.85 (0.61 to 3.09) | 1.77 | 21.96 | 0.02 | 54% | |
| Perignon 2016 (C)) (0.005) | 1.85 (0.61 to 3.10) | 1.77 | 21.93 | 0.02 | 54% | |
| Perignon 2016 (C)) (0.01) | 1.85 (0.61 to 3.10) | 1.77 | 21.89 | 0.02 | 54% | |
| Perignon 2016 (C)) (0.02723) | 1.85 (0.61 to 3.10) | 1.77 | 21.73 | 0.02 | 54% | |
| Perignon 2016 (C)) (0.1) | 1.86 (0.61 to 3.11) | 1.78 | 21.15 | 0.02 | 53% | |
| C: cluster‐randomised trial; CI: confidence interval; ICC: intra‐cluster correlation coefficient; MD: mean difference; RR: risk ratio | ||||||
No studies looked at fortified rice versus no intervention, and we could not examine comparisons 2 and 4 to 8 because there were no studies looking at vitamin A, folic acid and zinc with other micronutrients that did not also include iron, and there were no studies with a 'no intervention' arm. However we undertook meta‐analysis for vitamin A versus unfortified rice since one study (Hussain 2014), reported an intervention arm with vitamin A only compared with unfortified rice. We included this in comparison 3.
Rice fortified with iron alone or in combination with other micronutrients versus unfortified rice
There were 12 studies (2201 participants) included in this comparison (Angeles‐Agdeppa 2008; Hardinsyah 2016; Hotz 2008; Hussain 2014; Losso 2017; Moretti 2006b; Parker 2015 (C); Perignon 2016 (C); Pinkaew 2013; Pinkaew 2014; Radhika 2011; Thankachan 2012). These studies comprise all the data included in the synthesis of this Review. We included five non‐randomised studies in this comparison (Ara 2019; Della Lucia 2016; Gershoff 1977; Nogueira Arcanjo 2013; Salcedo 1950) for qualitative assessment.
Primary outcomes
Anaemia (defined as haemoglobin (Hb) below the WHO cut‐off, adjusted for altitude as appropriate or as defined by the study authors)
We included seven studies in the analysis (Angeles‐Agdeppa 2008; Hardinsyah 2016; Hotz 2008; Parker 2015 (C); Perignon 2016 (C); Radhika 2011; Thankachan 2012). The studies had a duration of four months (Hardinsyah 2016), six months (Angeles‐Agdeppa 2008; Hotz 2008; Parker 2015 (C); Perignon 2016 (C); Thankachan 2012), and eight months (Radhika 2011). The detailed results are presented in Analysis 1.1. Overall, the children who consumed iron‐fortified rice had similar levels of anaemia to controls at the end of the follow‐up period (RR 0.72, 95% CI 0.54 to 0.97; 7 studies; 1634 participants; low‐certainty evidence). Heterogeneity was high (Tau² = 0.10; Chi² = 23.27, df = 6; P = 0.0007; I2 = 74%) and the results have to be interpreted with caution. One study (Angeles‐Agdeppa 2008), reported direction of benefit favouring fortification, whereas Hotz 2008; Parker 2015 (C); Perignon 2016 (C); Radhika 2011 and Thankachan 2012 showed ambiguous direction. Exclusion of two studies, which clearly favoured fortification (Angeles‐Agdeppa 2008; Hardinsyah 2016), changed the effect such that there was no effect on anaemia (RR 0.92, 95% CI 0.76 to 1.12; 1248 participants) and reduced heterogeneity among studies (Tau² = 0.01; Chi² = 5.08, df = 4; P = 0.28; I2 = 21%). Exclusion of Parker 2015 (C) revealed a slight reduction in anaemia with fortification of rice (RR 0.66, 95% CI 0.49 to 0.89; I2 = 61%; 1336 participants) and it reduced the heterogeneity slightly.
There was no clear evidence of differences between subgroups in terms of reduction of anaemia in any of the following subgroup analyses.
-
Micronutrient content: iron alone (RR 0.63 95% CI 0.36 to 1.09; I2 = 43%; 3 studies, 444 participants; Analysis 1.2); iron plus other nutrients (RR 0.95, 95% CI 0.82 to 1.11; I2 = 0%; 4 studies, 1190 participants; Analysis 1.2).
-
Rice fortification method: hot extrusion (RR 0.72, 95% CI 0.52 to 1.01; I2 = 80%; 5 studies, 1197 participants); cold extrusion (RR 0.75, 95% CI 0.41 to 1.38; I2 = 31%; 3 studies, 437 participants; Analysis 1.3).
-
By cooking method most commonly used in study setting (as reported): rinsing and boiling without excess water (RR 0.40, 95% CI 0.26 to 0.63; 1 study; 215 participants; Analysis 1.4); unknown/unreported (RR 0.81, 95% CI 0.63 to 1.05; I2 = 61%; 6 studies, 1419 participants; Analysis 1.4).
-
Public health significance of anaemia at baseline in the target group: mild and moderate, 5% to 39.9% (RR 0.69, 95% CI 0.44 to 1.06; I2 = 85%; 4 studies, 1129 participants; Analysis 1.5); severe, 40% and more (RR 0.87, 95% CI 0.67 to 1.12; I2 = 0%; 2 studies, 360 participants; Analysis 1.5); and mixed/unknown/unreported (RR 0.31, 95% CI 0.09 to 1.10; 1 study, 145 participants; Analysis 1.5).
-
Malaria endemicity at the time that the study was conducted: some malaria risk setting (RR 0.85, 95% CI 0.55 to 1.32; 1 study, 445 participants); malaria‐free area (RR 0.70, 95% CI 0.48 to 1.03; I2 = 71%; 2 studies, 403 participants; Analysis 1.6); and unknown/unreported malaria setting (RR 0.67, 95% CI 0.34 to 1.31; I2 = 84%; 4 studies, 786 participants; Analysis 1.6).
Iron deficiency
We included eight studies in the analysis (Angeles‐Agdeppa 2008; Hardinsyah 2016; Hotz 2008; Moretti 2006b; Perignon 2016 (C); Pinkaew 2013; Radhika 2011; Thankachan 2012). We did not include data from Hussain 2014 in the meta‐analysis because the subgroup details (for each arm) related to iron deficiency were not available, since the study authors reported data only for overall fortification versus unfortified rice. The intervention in the included studies lasted four months (Hardinsyah 2016), five months (Pinkaew 2013), six months (Angeles‐Agdeppa 2008; Hotz 2008; Perignon 2016 (C); Thankachan 2012), seven months (Moretti 2006b) and eight months (Radhika 2011). Details are presented in Analysis 1.7. Participants consuming rice fortified with iron or in combination with other micronutrients may have slightly lower levels of iron deficiency compared to those consuming unfortified rice (RR 0.66, 95% CI 0.51 to 0.84; 8 studies, 1733 participants; low‐certainty evidence). Heterogeneity was low (Tau² = 0.02; Chi² = 8.60, df = 7; P = 0.28; I2 = 19%). The pooled estimate favours fortification, in which direction of benefit was positive for fortification in Moretti 2006b and Radhika 2011. Also Hussain 2014 showed favourable effects towards fortification (48 out of 185 in the fortification arms together and 19 out of 37 in the control arm).
There were no significant differences in iron deficiency due to consumption of iron‐fortified rice across the subgroups.
-
Micronutrient content: fortification with a single micronutrient (iron) resulted in lower risk of iron deficiency (RR 0.56, 95% CI 0.40 to 0.80; I2 = 17%; 4 studies, 628 participants; Analysis 1.8), whereas fortification with multiple micronutrients showed no difference compared to the unfortified group (RR 0.78, 95% CI 0.57 to 1.06; I2 = 0%; 4 studies, 1105 participants; Analysis 1.8).
-
Rice fortification method: hot extrusion (RR 0.66, 95% CI 0.51 to 0.87; I2 = 4%; 6 studies, 1283 participants; Analysis 1.9), cold extrusion (RR 0.65, 95% CI 0.38 to 1.09; participants = 450; studies = 3; I2 = 40%; Analysis 1.9).
-
Cooking method most commonly used in study setting (as reported): rinsing and boiling without excess water (RR 0.79, 95% CI 0.51 to 1.21; 1 study, 215 participants; Analysis 1.10) and unknown/unreported (RR 0.63, 95% CI 0.46 to 0.84; I2 = 22%; 7 studies, 1518 participants; Analysis 1.10).
-
Public health significance of anaemia at baseline in the target group: mild and moderate, 5% to 39.9% (RR 0.77, 95% CI 0.55 to 1.07; I2 = 0%; 4 studies, 1046 participants; Analysis 1.11); severe, 40% and more (RR 0.57, 95% CI 0.26 to 1.27; I2 = 59%; 2 studies, 358 participants; Analysis 1.11) and mixed/unknown/unreported (RR 0.63, 95% CI 0.39 to 1.01; I2 = 47%; 2 studies, 329 participants; Analysis 1.11).
-
Malaria endemicity at the time that the study was conducted: some malaria risk setting (RR 0.86, 95% CI 0.48 to 1.53; 1 study, 485 participants; Analysis 1.12); malaria‐free area (RR 0.58, 95% CI 0.41 to 0.84; I2 = 0%; 3 studies, 585 participants; Analysis 1.12); and unknown/unreported malaria setting (RR 0.61, 95% CI 0.39 to 0.96; I2 = 46%; 4 studies, 663 participants; Analysis 1.12).
Haemoglobin concentration (g/L)
We included 11 studies in the analysis (Angeles‐Agdeppa 2008; Hardinsyah 2016; Hotz 2008; Hussain 2014; Losso 2017; Moretti 2006b; ; Parker 2015 (C); Perignon 2016 (C); Pinkaew 2013; Radhika 2011; Thankachan 2012). The duration of the intervention varied between two weeks (Losso 2017), and eight months (Radhika 2011). The other included studies provided the intervention for four months (Hardinsyah 2016), five months (Pinkaew 2013), six months (Angeles‐Agdeppa 2008; Hotz 2008; Hussain 2014; Perignon 2016 (C); Thankachan 2012) and seven months (Moretti 2006b; Parker 2015 (C)). Details are presented in Analysis 1.13. Consuming rice fortified with iron or in combination with other micronutrients may increase haemoglobin concentrations (g/L) in comparison to consuming unfortified rice (MD 1.83, 95% CI 0.66 to 3.00; 11 studies, 2163 participants; low‐certainty evidence). Heterogeneity was substantial (Tau² = 1.58; Chi² = 21.86, df = 10; P = 0.02; I² = 54%) and results should be interpreted with caution. The direction of benefit was towards fortification in three studies (Angeles‐Agdeppa 2008; Hardinsyah 2016; Perignon 2016 (C)). Exclusion of Parker 2015 (C) did not change the direction of the effect or the heterogeneity.
There were no clear differences between other subgroups, or any obvious asymmetry in the funnel plot (Figure 5).

Funnel plot of comparison 1. Rice fortified with iron alone or in combination with other micronutrients versus unfortified rice (no micronutrients added), outcome 1.13, haemoglobin concentration (g/L)
-
Micronutrient content: rice fortified with iron alone showed a significant increase in mean haemoglobin (MD 3.93, 95% CI 1.24 to 6.62; I2 = 57%; 6 studies, 698 participants; Analysis 1.14); whereas the studies giving iron in combination with other micronutrients did not increase mean haemoglobin (MD 1.06, 95% CI 0.15 to 1.98; I2 = 24%; 6 studies, 1465 participants; Analysis 1.14).
-
Rice fortification method: hot extrusion (MD 1.93, 95% CI 0.53 to 3.32; I2 = 68%; 7 studies, 1563 participants; Analysis 1.15); cold extrusion (MD 1.54, 95% CI 0.58 to 2.51; I2 = 11%; 3 studies, 437 participants; Analysis 1.15);coating (MD 8.20, 95% CI −12.14 to 28.54; 1 study, 15 participants; Analysis 1.15); and mixed/unknown/unreported (MD −4.00, 95% CI −11.72 to 3.72; 1 study, 148 participants; Analysis 1.15).
-
Cooking method most commonly used in study setting (as reported): rinsing and boiling without excess water (MD 3.80, 95% CI 0.86 to 6.74; 1 study, 215 participants; Analysis 1.16); and unknown/unreported (MD 1.62, 95% CI 0.43 to 2.81; I2 = 51%; 10 studies, 1948 participants; Analysis 1.16).
-
Public health significance of anaemia at baseline in the target group: mild and moderate, 5% to 39.9% (MD 1.67, 95% CI −0.10 to 3.44; I2 = 70%; 6 studies, 1459 participants; Analysis 1.17); severe, 40% and more (MD 1.07, 95% CI −0.84 to 2.98; I2 = 0%; 2 studies, 360 participant; Analysis 1.17); and mixed/unknown/unreported (MD 3.42, 95% CI 1.10 to 5.73; I2 = 0%; 3 studies, 344 participants; Analysis 1.17).
-
Malaria endemicity at the time that the study was conducted: some malaria risk setting (MD 0.90, 95% CI 0.65 to 1.15; 1 study, 445 participants; Analysis 1.18); malaria‐free area (MD 3.15, 95% CI 0.98 to 5.31; I2 = 53%; 3 studies, 587 participants; Analysis 1.18); and unknown/unreported malaria setting (MD 1.33, 95% CI −0.48 to 3.14; I2 = 34%; 7 studies, 1131 participants; Analysis 1.18).
Vitamin A deficiency (as defined by the study authors)
Four studies contributed data for vitamin A deficiency (Hardinsyah 2016; Perignon 2016 (C); Pinkaew 2014; Thankachan 2012). Details are provided in Analysis 1.19. Consumption of fortified rice may make little or no difference to vitamin A deficiency (RR 0.68, 95% CI 0.36 to 1.29; 927 participants; 4 studies, low‐certainty evidence). Heterogeneity was marginally high (Tau² = 0.16; Chi² = 4.77, df = 3; P = 0.19; I² = 37%) and results have to be interpreted with caution. We did not include data from Hussain 2014 in the meta‐analysis, since the study authors reported vitamin A deficiency for the fortified rice group overall versus unfortified rice (37 out of 185 in the fortified arm and 22 out of 37 in the control arm). However their overall estimates had significant decrease in vitamin A deficiency in the fortified arm compared to control arm at the end of the six‐month intervention period.
There are no significant differences in the risk ratio across the subgroups. The details of subgroup analyses are presented below.
-
Micronutrient content: all the studies contributing data to this analysis compared iron plus other micronutrients with unfortified rice (RR 0.68, 95% CI 0.36 to 1.29; I2 = 37%; 4 studies, 927 participants; Analysis 1.20).
-
Rice fortification method: hot extrusion (RR 0.70, 95% CI 0.35 to 1.39; I2 = 34%; 4 studies, 765 participants; Analysis 1.21); and cold extrusion (RR 0.61, 95% CI 0.24 to 1.54; 1 study, 162 participants; Analysis 1.21).
-
Cooking method most commonly used in study setting (as reported): rinsing and boiling without excess water (RR 1.10, 95% CI 0.47 to 2.60; 1 study, 215 participants; Analysis 1.22); and unknown/unreported (RR 0.55, 95% CI 0.25 to 1.22; I2 = 34%; 3 studies, 712 participants; Analysis 1.22).
-
Public health significance of anaemia at baseline in the target group: mild and moderate, 5% to 39.9% (RR 0.60, 95% CI 0.29 to 1.24; I2 = 47%; 3 studies, 695 participants; Analysis 1.23) and severe, 40% and more (RR 1.46, 95% CI 0.30 to 7.07; 1 study, 232 participants; Analysis 1.23).
-
Malaria endemicity at the time that the study was conducted: some malaria risk setting (RR 0.57, 95% CI 0.30 to 1.08; 1 study, 442 participants; Analysis 1.24); malaria‐free area (RR 1.46, 95% CI 0.30 to 7.07; 1 study, 232 participants; Analysis 1.24); and unknown/unreported malaria setting (RR 0.55, 95% CI 0.12 to 2.59; I2 = 72%; 2 studies, 253 participants; Analysis 1.24).
Serum or plasma folate (nmol/L)
One study reported the level or comparison of serum folate (Hardinsyah 2016). The direction of benefit in this study was slightly towards fortified rice (MD 4.30, 95% CI 2.00 to 6.60; 1 study, 215 participants; low‐certainty evidence). The details are given in Analysis 1.25.
Any adverse effects (hookworm infection risk)
One study (Perignon 2016 (C)), reported that children given fortified rice were more likely to have hookworm infection compared to those given unfortified rice (RR 1.78, 95% CI 1.18 to 2.70, 1 study, 785 participants; low‐certainty evidence; Analysis 1.26).
Any adverse effects (abdominal pain more than three days)
One study (Thankachan 2012), reported that children given fortified rice were just as likely to have abdominal pain compared to those given unfortified rice (average RR 0.77, 95% CI 0.42 to 1.42; Analysis 1.26).
Diarrhoea (as defined by study authors; for studies among children aged 2 to 11.9 years of age)
One study reported the comparison of diarrhoeal episodes across the fortified and unfortified groups (Thankachan 2012). There was no difference in the risk of diarrhoea (average RR 3.52, 95% CI 0.18 to 67.39; 1 study, 258 participants, very low‐certainty evidence; Analysis 1.27).
Respiratory infections (for studies among children aged 2 to 11.9 years of age)
The included studies mentioned the episodes of respiratory infections in intervention and control groups during the study period, however, none reported the differences across the groups following rice fortification.
All‐cause death (for studies among children aged 2 to 11.9 years of age)
None of the included studies reported deaths.
Congenital anomalies (for studies among pregnant women with folic acid‐fortified rice as intervention)
No studies involved pregnant women.
Miscarriage (for studies among pregnant women)
No studies involved pregnant women.
Secondary outcomes
Serum or plasma retinol (µmol/L)
Five studies reported the outcome of serum retinol (µmol/L) across the iron‐fortified and unfortified groups (Angeles‐Agdeppa 2008; Hardinsyah 2016; Hussain 2014; Pinkaew 2014; Thankachan 2012). Details are presented in Analysis 1.28. Participants consuming rice fortified with iron alone or other micronutrients had a marginally higher plasma retinol compared to those consuming unfortified rice (MD 0.04, 95% CI −0.13 to 0.21; 5 studies; 727 participants). Heterogeneity was high (Tau² = 0.03; Chi² = 60.39, df = 4 P < 0.00001; I2 = 93%). Two studies favoured fortification (Angeles‐Agdeppa 2008; Hussain 2014), and three had ambiguous results (Hardinsyah 2016; Pinkaew 2014; Thankachan 2012). Heterogeneity was explained by one study (Hardinsyah 2016), and its removal showed a higher mean difference favouring fortification (MD 0.20, 9% CI 0.18 to 0.22). This study had seven micronutrients.
Serum or plasma zinc (µmol/L)
Three studies reported the effectiveness of multiple micronutrient‐fortified rice on the level of serum or plasma zinc among children (Hardinsyah 2016; Pinkaew 2014; Thankachan 2012). See Analysis 1.29 for details (MD 0.38, 95% CI −0.08 to 0.83; I2 = 28%; 3 studies, 618 participants).
Anthropometric measures
One study (Moretti 2006b), contributed data to the outcome height‐for‐age Z‐score and weight‐for‐height Z‐score. The mean difference for height‐for‐age Z‐score was 0.02 (95% CI −0.32 to 0.36; 1 study, 184 participants; Analysis 1.30) and for weight‐for‐height Z‐score mean difference was 0.13 (95% CI −0.19 to 0.45; 1 study, 184 participants; Analysis 1.31). For both these outcomes, fortification may or may not make a difference.
Risk of iron overload (defined by serum ferritin higher than 150 µg/L in women and higher than 200 µg/L in men)
No studies reported the aspects of iron overload.
Clinical and severe malaria
None of the included studies had details on malaria across any of the study groups. Few studies had declared they were conducted in malaria non‐endemic areas.
Night blindness (defined as the inability to see after dusk by people who typically report having normal vision during the day; only for vitamin A‐fortified rice as an intervention)
No studies with vitamin A reported night blindness.
Rice fortified with iron alone or in combination with other micronutrients versus no intervention
No studies contributed data for this outcome.
Rice fortified with vitamin A alone or in combination with other micronutrients versus unfortified rice
We included one study in this comparison (Hussain 2014).
Primary outcomes
Anaemia (defined as haemoglobin (Hb) below the WHO cut‐off, adjusted for altitude as appropriate)
No studies contributed data for this outcome.
Iron deficiency
No studies contributed data for this outcome.
Haemoglobin concentration (g/L)
One study contributed data for this analysis (Hussain 2014). The study had five intervention arms; we included the retinyl palmitate arm with the fortification arm and the arm without fortification as the control arm for this comparison. The study authors reported a significant increase in the haemoglobin concentration in the vitamin A‐fortified arm compared to the unfortified control arm (MD 10.00, 95% CI 8.79 to 11.21; 1 study, 74 participants; low‐certainty evidence; Analysis 2.1).
Vitamin A deficiency (as defined by study authors, by using a biomarker)
We did not include any studies in this meta‐analysis. One study (Hussain 2014), reported vitamin A deficiency; however there were no data on vitamin A deficiency status in the arm fortified with vitamin A only. Their estimates are reported for the fortification arms in total. Details of their findings are in comparison 1.
Diarrhoea (as defined by study authors; for studies among children aged 2 to 11.9 years of age)
No studies contributed data for this outcome.
Respiratory infections (for studies among children aged 2 to 11.9 years of age)
No studies contributed data for this outcome.
All‐cause death (for studies among children aged 2 to 11.9 years of age)
No studies contributed data for this outcome.
Serum or plasma retinol (µmol/L)
One study contributed data to this analysis (Hussain 2014). Fortification of rice with vitamin A probably increases the serum retinol concentration compared to unfortified rice (MD 0.17, 95% CI 0.13 to 0.21; 1 study, 74 participants; low‐certainty evidence; Analysis 2.2).
Any adverse effects (hookworm infection risk)
No studies contributed data for this outcome.
Any adverse effects (abdominal pain more than 3 days)
No studies contributed data for this outcome.
Rice fortified with vitamin A alone or in combination with other micronutrients versus no intervention
No studies contributed data to this comparison.
Rice fortified with zinc alone or in combination with other micronutrients versus unfortified rice (no micronutrients added)
No studies contributed data to this comparison.
Rice fortified with zinc alone or in combination with other micronutrients versus no intervention
No studies contributed data to this comparison.
Rice fortified with folic acid alone or in combination with other micronutrients versus unfortified rice (no micronutrients added)
No studies contributed data to this comparison.
Rice fortified with folic acid alone or in combination with other micronutrients versus no intervention
No studies contributed data to this comparison.
Summary of non‐randomised studies
The value of the controlled before‐and‐after studies was mixed. Salcedo 1950 documented a reduction in clinical beriberi. Gershoff 1977 reported on the changes in amino acid intake and weight and length but did not make any formal estimates of change. One of the more recent studies, Nogueira Arcanjo 2013, comparing iron‐fortified rice versus unfortified rice showed no change in mean haemoglobin but with an increase in anaemia in the unfortified group. The study comparing multiple micronutrient‐fortified rice with unfortified rice compared outcomes relative to baseline values within the fortified group and the unfortified group (Della Lucia 2016). In the fortified group, there was an improvement in folic acid, thiamine and serum zinc, but not for haemoglobin or ferritin. In the unfortified group, there was an improvement in thiamine and ferritin concentrations. The groups were unbalanced with respect to ferritin levels, being significantly higher in the fortified group at baseline.
In Nogueira Arcanjo 2013, the groups were different in the prevalence of anaemia at baseline: 8.9% (11/120 were anaemic) in the group receiving iron‐fortified rice, and 20.8% (30/144 were anaemic) in the group receiving unfortified rice (P = 0.009). At the end of the study, the groups remained different, 10.5% (13/120) among the participants receiving iron‐fortified rice, and 37.5% (54/144) among those receiving unfortified rice (P < 0.001). There was a statistically significant increase in anaemia prevalence in the control group receiving standard unfortified rice; however, the iron‐fortified rice group did not present a statistically significant change in the number of anaemic children after the intervention. Also, the groups were similar for haemoglobin concentration: 120.6 ± 10.1 g/L in the fortified rice group versus 124.0 ± 41.4 g/L in the unfortified rice group, P = 0.38; but after intervention, there was no significant difference between the groups, P = 0.56. The after intervention period haemoglobin concentrations were 121.4 ± 10.6 g/L in the fortified rice group and 122.9 ± 24.8 g/L. Among only anaemic participants, in the group receiving iron‐fortified rice before intervention, mean haemoglobin value was 101.2 ± 8.5 g/L (n = 11) and 115.6 ± 8.6 after intervention, P = 0.0003; in the control group receiving unfortified rice (n = 30), mean haemoglobin concentrations changed from 108.3 ± 11.1 g/L at baseline to 109.4 ± 11.8 g/L after intervention, P = 0.18. For the standard rice school: baseline mean haemoglobin was 124.0 ± 41.4 g/L, and after intervention 122.9 ± 24.8, P = 0.78. Considering only anaemic participants, there was a significant increase in haemoglobin means before and after intervention, P = 0.003 in the fortified rice school.
In the other controlled before‐and‐after study (Gershoff 1977), the average haemoglobin concentration among those children consuming less than 10% or no fortified rice for all ages (5 to 9 years of age) was 114.6 g/L ± 6.6 (n = 135) in 1971 and changed to 119.8 g/L ± 12.6 (n = 135) in 1975. On the other hand, the average haemoglobin concentration among those children consuming more than 66% of fortified rice for all ages (5 to 9 years) was 117.7 g/L ± 8.8 (n = 61) in 1971 and 122.5 g/L ± 11.8 (n = 61) in 1975. These changes were not significant.
Discusión
Resumen de los resultados principales
Se resumieron los hallazgos aquí y en la Tabla 1 de Resumen de los hallazgos y en la Tabla 2 de Resumen de los hallazgos. Se incluyeron 17 estudios en esta revisión, 12 de los cuales eran ECA. Dos de los ECA eran ensayos aleatorizados grupales. Cinco estudios tenían un diseño de estudio de antes y después que comparaba el arroz enriquecido con micronutrientes con arroz no enriquecido. Todos los estudios incluidos proporcionaron arroz no enriquecido en el brazo de control. No hubo estudios que compararan el arroz enriquecido con un brazo de ninguna intervención.
Se consideraron 12 ECA para el metanálisis. Se realizaron diez ECA en niños y dos en mujeres no embarazadas y que no amamantaban. Todos los estudios incluidos en esta revisión proporcionaron arroz no enriquecido como control. Todos los estudios incluyeron hierro en sus brazos de intervención (un estudio de Hussain 2014 con brazos múltiples tuvo un grupo de enriquecimiento con vitamina A solamente). Cinco estudios incluyeron arroz enriquecido con hierro solo y un estudio tuvo un brazo con hierro solo como intervención. Siete estudios utilizaron micronutrientes múltiples (seis en niños y uno en mujeres). La vitamina A, el zinc, el folato y la vitamina B fueron los micronutrientes adicionales. Cuatro estudios utilizaron el enriquecimiento con vitamina A, cinco estudios el enriquecimiento con zinc y tres estudios el enriquecimiento con ácido fólico. El perfil de enriquecimiento de los estudios incluidos se muestra en la Tabla 4.
Los participantes que consumieron arroz enriquecido con hierro solo o en combinación con otros micronutrientes tuvieron la misma probabilidad de presentar anemia que los que recibieron arroz no enriquecido (7 ECA, evidencia de certeza baja); sin embargo, el enriquecimiento del arroz puede reducir el riesgo de deficiencia de hierro (8 ECA, evidencia de certeza baja). Si se tiene en cuenta el nivel bajo de certeza, el enriquecimiento del arroz puede mejorar los niveles medios de hemoglobina (g/l; 11 ECA). El consumo de arroz enriquecido puede lograr poca o ninguna diferencia en la deficiencia de vitamina A (4 ECA, evidencia de certeza baja) y puede mejorar el folato en suero o plasma (1 ECA). Dos estudios informaron de tres efectos adversos de diarrea, riesgo de infección por anquilostomas y dolor abdominal de más de tres días de duración. No se conoce con certeza el riesgo de diarrea (1 ECA, evidencia de certeza muy baja). Los niños a los que se les administró arroz enriquecido pueden tener un mayor riesgo de infección por anquilostomas en comparación con los que recibieron arroz no enriquecido (1 ECA, evidencia de certeza baja) y es posible que no haya ninguna diferencia en cuanto al dolor abdominal de más de tres días.
Se observó una leve mejoría en la concentración de retinol en suero o plasma (µmol/L) entre los participantes que consumieron arroz enriquecido (5 ECA). No hay diferencias en la concentración de zinc en suero (µmol/L; 3 ECA), la puntuación Z de la altura para la edad (1 ECA) y la puntuación Z del peso para la altura (1 ECA) con el enriquecimiento.
Se incluyó un ECA en la comparación de vitamina A sola o en combinación con otros micronutrientes frente al arroz no enriquecido, debido a que todos los otros ECA que incluyeron vitamina A en su brazo de enriquecimiento también incluían hierro. Por lo tanto, solo se incluyeron en la primera comparación, para evitar la duplicación.
Los participantes que consumen arroz enriquecido con vitamina A sola tienden a presentar niveles medios más altos de hemoglobina (1 ECA) y de retinol en suero (1 ECA).
Los estudios controlados del tipo antes y después fueron significativos al mostrar la primera evidencia de un resultado clínico atribuible más probablemente al enriquecimiento del arroz (Salcedo 1950), y el grado en que se mejora el contenido dietético (Gershoff 1977). Las limitaciones de los grupos desequilibrados, muy probablemente debido a la ausencia de asignación al azar a los grupos de tratamiento, limita la interpretación de los dos estudios en Brasil (Della Lucia 2016; Nogueira Arcanjo 2013), sin embargo, ambos proporcionan una base para la planificación de estudios sobre el zinc y el folato, sobre los cuales se realizaron muy pocos estudios.
Compleción y aplicabilidad general de las pruebas
La revisión incluye estudios en niños en edad preescolar y escolar, y mujeres no embarazadas y que no amamantan. No se encontraron estudios solo para adolescentes (excepto un estudio que incluyó a niñas adolescentes), mujeres embarazadas o que amamantan u hombres adultos. Todos excepto un estudio procedían de países de ingresos bajos y medios, donde la prevalencia de la anemia entre los niños de 6 a 59 meses de edad oscilaba entre el 26% y el 59% (OMS 2015a). Los estudios con retinol sérico como resultado se realizaron en países donde la prevalencia de la deficiencia de vitamina A entre los niños en edad preescolar oscilaba entre el 16% y el 62% (OMS 2009a).
Casi todos los ensayos clínicos aleatorizados utilizaron pirofosfato férrico micronizado y el método de extrusión en caliente, y tres estudios incluyeron un brazo de extrusión en frío o en caliente. De las cuatro vitaminas y minerales identificados para la revisión, se encontró que los estudios investigaron cuatro (hierro, vitamina A, folato y zinc). Todos los estudios excepto uno tuvieron datos de la hemoglobina, aunque no todos los estudios informaron las tasas medias de hemoglobina o anemia. Aunque tres estudios incluyeron el ácido fólico como uno de los fortificantes, solo se informó el estado del folato en uno de ellos. Además, la mayoría de los ECA incluidos se realizaron en contextos escolares. La certeza de la evidencia en cuanto a la anemia y la deficiencia de hierro fue baja. Para la concentración de hemoglobina, la evidencia fue de certeza muy baja. Debido a que se trata de una estructura cerrada y controlada, la generalización de los resultados de dichos estudios se convierte en un reto para la presente revisión sistemática. También podría haber una interacción de las co‐intervenciones como otros micronutrientes añadidos al mismo arroz enriquecido, la dosis y absorción de hierro y el consumo de otros elementos nutritivos, lo cual alteraría la estimación general del efecto.
Otro aspecto potencial del enriquecimiento del arroz y su efecto sobre la malnutrición es la duración de la intervención. Los estudios incluidos tuvieron una duración del seguimiento de dos semanas a cuatro años. Sin embargo, en los ECA incluidos, un estudio tuvo un seguimiento de dos semanas y otros estudios variaron de cuatro a ocho meses. Por lo tanto, la duración de la intervención y el seguimiento podrían desempeñar un papel importante.
Calidad de la evidencia
Entre los ECA que contribuyeron al metanálisis, se evaluaron dos estudios como en riesgo general bajo de sesgo y un estudio como en riesgo de sesgo alto o incierto en la mayoría de los dominios. La exclusión de este estudio favoreció el enriquecimiento y alteró la conclusión para la anemia (de ningún efecto a una reducción de la anemia) y la conclusión para el subgrupo de micronutrientes múltiples en la comparación 1 para el nivel medio de hemoglobina (de ningún efecto a una diferencia de medias mayor). La mayoría de estos estudios describieron la generación de la secuencia de aleatorización de manera inadecuada. Cerca de la mitad presentó una descripción poco clara de la ocultación de la asignación y el cegamiento de los resultados. La mayoría de los estudios tuvieron una tasa baja de deserción.
La evaluación GRADE de la certeza de la evidencia fue baja para la anemia (ningún efecto), la deficiencia de hierro (a favor del enriquecimiento), la deficiencia de vitamina A (ningún efecto), el folato en suero o plasma (un estudio incluido a favor del enriquecimiento) y los eventos adversos (un estudio informó un riesgo mayor de infección por anquilostomas con el enriquecimiento) en la comparación del hierro solo o en combinación con otros micronutrientes frente a ningún enriquecimiento. La certeza de la evidencia también fue baja para el nivel medio de hemoglobina (puede estar a favor). El resultado de la diarrea (ningún efecto) se calificó como evidencia de certeza muy baja. La calidad de los estudios se disminuyó principalmente debido a la inconsistencia y la imprecisión de las estimaciones. En la comparación de la vitamina A sola frente a ningún enriquecimiento, un ECA aportó datos y la certeza de la evidencia se calificó como baja para la concentración de hemoglobina y la concentración de retinol en suero.
Es muy probable que los estudios de investigación adicionales tengan una repercusión importante sobre la confianza en la estimación del efecto y puede que cambien los resultados.
Sesgos potenciales en el proceso de revisión
Dos autores de la revisión realizaron de forma independiente el proceso de revisión, con el mismo formulario de extracción de datos y las mismas herramientas para evaluar el riesgo de sesgo en los estudios incluidos. Muchos estudios tenían información mínima con respecto al procedimiento de aleatorización, la ocultación de la asignación y el cegamiento. En ausencia de detalles precisos, se consideró la discusión mutua entre los autores de la revisión como definitiva en esta revisión, debido a que los mismos incluyeron componentes subjetivos. También se realizaron búsquedas extensivas en la literatura gris y en los registros de ensayos, y se estableció contacto con organismos que participaron en la realización de los ECA y con los expertos en el tema; de este modo, se redujo al mínimo el sesgo de publicación en esta revisión. Tampoco hubo un límite de idioma establecido en esta revisión sistemática para las búsquedas ni para la obtención de resúmenes/artículos de texto completo. Se buscó la ayuda de traductores para convertir al inglés los artículos escritos en idiomas diferentes. Este procedimiento minimizaría el sesgo de idioma en esta revisión.
Acuerdos y desacuerdos con otros estudios o revisiones
Esta revisión es la primera revisión sistemática y metanálisis específicos del arroz como vehículo para el enriquecimiento como una intervención de salud pública. Existen revisiones sistemáticas y metanálisis del enriquecimiento con micronutrientes de los alimentos básicos, los condimentos y los alimentos procesados, que incluyen a todos los grupos etarios, aunque los mismos no incluyen un análisis de subgrupos específico para el arroz (Das 2013; Gera 2012). Solo dos de los 12 estudios incluidos en la revisión se incluyeron en Das 2013 y esta revisión no incluyó a lactantes y niños pequeños menores de dos años de edad. En Das 2013 se descubrió que los alimentos básicos enriquecidos con hierro mejoran las concentraciones medias de hemoglobina y ferritina en suero, y reducen el riesgo de anemia. Los alimentos básicos enriquecidos con vitamina A mejoraron las concentraciones medias de hemoglobina y retinol en suero. Los cereales enriquecidos con zinc mejoraron los niveles séricos de zinc. Los alimentos básicos enriquecidos con hierro no tuvieron ningún impacto en los indicadores del nivel de hierro entre las mujeres. Las dos autores de la revisión acordaron que el enriquecimiento con hierro mejoró las concentraciones medias de hemoglobina. La revisión mostró una reducción de la deficiencia de hierro, mientras que Das 2013 mostró una mejoría en las concentraciones séricas de ferritina. No hubo acuerdo entre Das 2013 y esta revisión sobre la repercusión en la anemia, las concentraciones de vitamina A y zinc o su deficiencia. La revisión sistemática de Gera 2012 incluyó solo a individuos aparentemente sanos y examinó el efecto de los alimentos enriquecidos sobre los resultados hematológicos. Establecieron la conclusión de que los alimentos enriquecidos con hierro dieron lugar a una mejoría en la hemoglobina, la ferritina sérica y el estado de hierro, y que de ese modo se redujo el riesgo de anemia.
Otra revisión sistemática y metanálisis evaluaron el efecto del enriquecimiento de los alimentos básicos con zinc sobre los niveles séricos de zinc y la deficiencia de zinc (Shah 2016). Los alimentos básicos fortificados con zinc se compararon con alimentos sin zinc. Ninguno de los estudios incluidos en esta revisión se incluyeron en Shah 2016. Shah 2016 mostró que el enriquecimiento de los alimentos con zinc solo, pero no en combinación con otros micronutrientes, mejoró los niveles séricos de zinc. La revisión no tuvo una comparación de arroz enriquecido con zinc solo con arroz no enriquecido, aunque el arroz enriquecido con zinc y otros micronutrientes no mejoró los niveles de zinc. En ambas revisiones, la certeza de la evidencia fue baja para el zinc.
Una revisión sistemática del enriquecimiento del arroz incluyó siete estudios en niños de 6 a 59 meses de edad (Hijar 2015). No realizaron un metanálisis y la estrategia de búsqueda fue más limitada que la utilizada en esta revisión. La población también incluyó a niños menores de dos años de edad, que fueron excluidos de esta revisión. Ninguno de los estudios de esta revisión se incluyó en la revisión de Hijar 2015. Informaron de que el enriquecimiento del arroz fue efectivo para corregir la deficiencia de hierro entre los niños menores de cinco años de edad. La mejoría no fue significativa para el arroz enriquecido con vitamina A.
Otra revisión sistemática del enriquecimiento del arroz sin restricciones de edad incluyó 12 estudios del enriquecimiento del arroz con hierro, cuatro estudios del enriquecimiento con vitamina A y dos que incluyeron otros micronutrientes (De Pee 2017). Proporcionaron una descripción de la dirección de los efectos, pero no realizaron un metanálisis. La revisión realizada por De Pee 2017 estableció la conclusión de que, con la evidencia disponible en cuanto a la eficacia, la estabilidad y las necesidades, el arroz debería ser enriquecido con múltiples micronutrientes, incluidos el hierro, el zinc y las vitaminas A, B1 (tiamina), B3 (niacina) B6 (piridoxina), B9 (ácido fólico) y B12 (cobalamina). El metanálisis de esta revisión muestra evidencia de un efecto del hierro sobre el nivel medio de hemoglobina y la deficiencia de hierro; del enriquecimiento con vitamina A sobre la deficiencia de vitamina A; y del enriquecimiento con folato sobre la deficiencia de folato. Otra revisión sobre cuestiones relacionadas con el enriquecimiento del arroz para corregir la deficiencia de micronutrientes recopiló la evidencia de los estudios primarios disponibles y concluyó que el enriquecimiento del arroz es una estrategia efectiva (Piccoli 2012).

WHO/CDC logic model for micronutrients interventions in public health (with permission from WHO)

PRISMA study flow diagram

'Risk of bias' summary: review authors' judgements about each 'Risk of bias' item for each included study
Four studies were controlled before‐and‐after studies (Ara 2019; Della Lucia 2016; Gershoff 1977; Nogueira Arcanjo 2013), and one was a controlled cross‐sectional study (Salcedo 1950)

'Risk of bias' graph: review authors' judgements about each 'Risk of bias' item presented as percentages across all included studies

Funnel plot of comparison 1. Rice fortified with iron alone or in combination with other micronutrients versus unfortified rice (no micronutrients added), outcome 1.13, haemoglobin concentration (g/L)

Comparison 1 Rice fortified with iron alone or in combination with other micronutrients versus unfortified rice (no micronutrients added)., Outcome 1 Anaemia (defined as haemoglobin (Hb) below the WHO cut‐off, adjusted for altitude as appropriate).

Comparison 1 Rice fortified with iron alone or in combination with other micronutrients versus unfortified rice (no micronutrients added)., Outcome 2 Anaemia (subgroup: by micronutrient content).
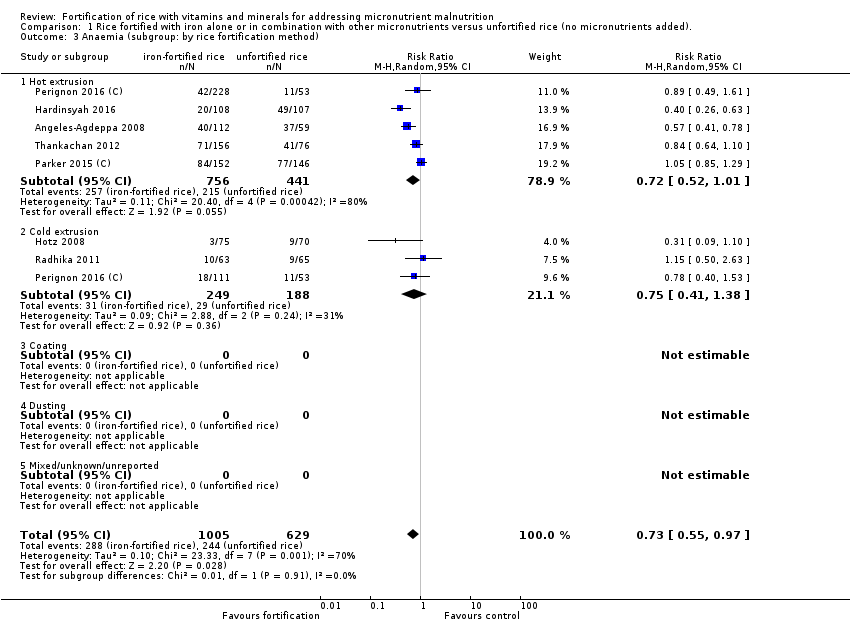
Comparison 1 Rice fortified with iron alone or in combination with other micronutrients versus unfortified rice (no micronutrients added)., Outcome 3 Anaemia (subgroup: by rice fortification method).

Comparison 1 Rice fortified with iron alone or in combination with other micronutrients versus unfortified rice (no micronutrients added)., Outcome 4 Anaemia (subgroup: by cooking method most commonly used in trial setting).

Comparison 1 Rice fortified with iron alone or in combination with other micronutrients versus unfortified rice (no micronutrients added)., Outcome 5 Anaemia (subgroup: by public health significance of anaemia at baseline ).

Comparison 1 Rice fortified with iron alone or in combination with other micronutrients versus unfortified rice (no micronutrients added)., Outcome 6 Anaemia (subgroup: by malaria endemicity).

Comparison 1 Rice fortified with iron alone or in combination with other micronutrients versus unfortified rice (no micronutrients added)., Outcome 7 Iron deficiency (as defined by study authors, based on a biomarker of iron status).

Comparison 1 Rice fortified with iron alone or in combination with other micronutrients versus unfortified rice (no micronutrients added)., Outcome 8 Iron deficiency (subgroup: by micronutrient content).

Comparison 1 Rice fortified with iron alone or in combination with other micronutrients versus unfortified rice (no micronutrients added)., Outcome 9 Iron deficiency (subgroup: by rice fortification method).

Comparison 1 Rice fortified with iron alone or in combination with other micronutrients versus unfortified rice (no micronutrients added)., Outcome 10 Iron deficiency (subgroup: by cooking method most commonly used in trial setting).

Comparison 1 Rice fortified with iron alone or in combination with other micronutrients versus unfortified rice (no micronutrients added)., Outcome 11 Iron deficiency (subgroup: by public health significance of anaemia at baseline ).

Comparison 1 Rice fortified with iron alone or in combination with other micronutrients versus unfortified rice (no micronutrients added)., Outcome 12 Iron deficiency (subgroup: by malaria endemicity).

Comparison 1 Rice fortified with iron alone or in combination with other micronutrients versus unfortified rice (no micronutrients added)., Outcome 13 Haemoglobin concentration (g/L).

Comparison 1 Rice fortified with iron alone or in combination with other micronutrients versus unfortified rice (no micronutrients added)., Outcome 14 Haemoglobin concentration (subgroup: by micronutrient content).

Comparison 1 Rice fortified with iron alone or in combination with other micronutrients versus unfortified rice (no micronutrients added)., Outcome 15 Haemoglobin concentration (subgroup: by rice fortification method).

Comparison 1 Rice fortified with iron alone or in combination with other micronutrients versus unfortified rice (no micronutrients added)., Outcome 16 Haemoglobin concentration (subgroup: by cooking method most commonly used in trial setting).

Comparison 1 Rice fortified with iron alone or in combination with other micronutrients versus unfortified rice (no micronutrients added)., Outcome 17 Haemoglobin concentration (subgroup: by public health significance of anaemia at baseline).

Comparison 1 Rice fortified with iron alone or in combination with other micronutrients versus unfortified rice (no micronutrients added)., Outcome 18 Haemoglobin concentration (subgroup: by malaria endemicity).

Comparison 1 Rice fortified with iron alone or in combination with other micronutrients versus unfortified rice (no micronutrients added)., Outcome 19 Vitamin A deficiency (as defined by study authors, by using a biomarker of vitamin A).

Comparison 1 Rice fortified with iron alone or in combination with other micronutrients versus unfortified rice (no micronutrients added)., Outcome 20 Vitamin A deficiency (subgroup: by micronutrient content).

Comparison 1 Rice fortified with iron alone or in combination with other micronutrients versus unfortified rice (no micronutrients added)., Outcome 21 Vitamin A deficiency (subgroup: by rice fortification method).

Comparison 1 Rice fortified with iron alone or in combination with other micronutrients versus unfortified rice (no micronutrients added)., Outcome 22 Vitamin A deficiency (subgroup: by cooking method most commonly used in trial setting).

Comparison 1 Rice fortified with iron alone or in combination with other micronutrients versus unfortified rice (no micronutrients added)., Outcome 23 Vitamin A deficiency (subgroup: by public health significance of anaemia at baseline ).

Comparison 1 Rice fortified with iron alone or in combination with other micronutrients versus unfortified rice (no micronutrients added)., Outcome 24 Vitamin A deficiency (subgroup: by malaria endemicity).
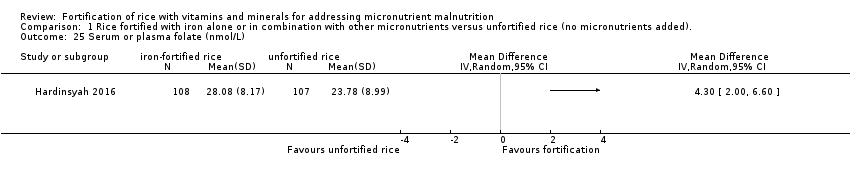
Comparison 1 Rice fortified with iron alone or in combination with other micronutrients versus unfortified rice (no micronutrients added)., Outcome 25 Serum or plasma folate (nmol/L).

Comparison 1 Rice fortified with iron alone or in combination with other micronutrients versus unfortified rice (no micronutrients added)., Outcome 26 Any adverse effects.

Comparison 1 Rice fortified with iron alone or in combination with other micronutrients versus unfortified rice (no micronutrients added)., Outcome 27 Diarrhoea (as defined by study authors).
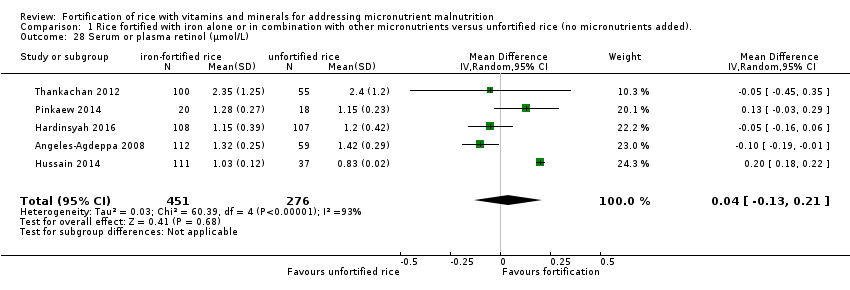
Comparison 1 Rice fortified with iron alone or in combination with other micronutrients versus unfortified rice (no micronutrients added)., Outcome 28 Serum or plasma retinol (µmol/L).

Comparison 1 Rice fortified with iron alone or in combination with other micronutrients versus unfortified rice (no micronutrients added)., Outcome 29 Serum or plasma zinc (µmol/L).

Comparison 1 Rice fortified with iron alone or in combination with other micronutrients versus unfortified rice (no micronutrients added)., Outcome 30 Height‐for‐age Z‐score.

Comparison 1 Rice fortified with iron alone or in combination with other micronutrients versus unfortified rice (no micronutrients added)., Outcome 31 Weight‐for‐height Z‐score.

Comparison 2 Rice fortified with vitamin A alone or in combination with other micronutrients versus unfortified rice (no micronutrients added), Outcome 1 Haemoglobin concentration (g/L).
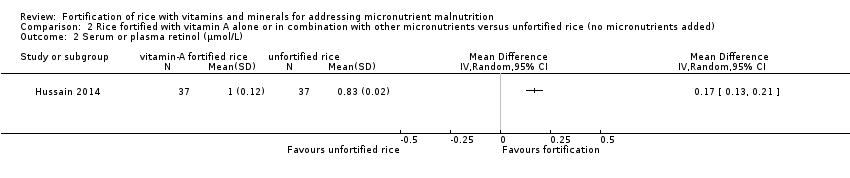
Comparison 2 Rice fortified with vitamin A alone or in combination with other micronutrients versus unfortified rice (no micronutrients added), Outcome 2 Serum or plasma retinol (µmol/L).
| Rice fortified with iron alone or in combination with other micronutrients compared to unfortified rice (no micronutrients added) for addressing micronutrient malnutrition | ||||||
| Patient or population: general population older than 2 years of age (including pregnant women) from any country | ||||||
| Outcomes | Anticipated absolute effects* (95% CI) | Relative effect | № of participants | Certainty of the evidence | Comments | |
| Risk with unfortified rice (no micronutrients added) | Risk with rice fortified with iron alone or in combination with other micronutrients | |||||
| Anaemia (defined as haemoglobin below the WHO cut‐off, adjusted for altitude as appropriate) | Study population | RR 0.72 (0.54 to 0.97) | 1634 (7 RCTs) | ⊕⊕⊝⊝ Low1 | Included studies: Angeles‐Agdeppa 2008; Hardinsyah 2016; Hotz 2008; Parker 2015 (C); Perignon 2016 (C); Radhika 2011; Thankachan 2012 | |
| 388 per 1000 | 279 per 1000 | |||||
| Iron deficiency (as defined by study authors, based on a biomarker of iron status) | Study population | RR 0.66 (0.51 to 0.84) | 1733 | ⊕⊕⊝⊝ | Included studies: Angeles‐Agdeppa 2008; Hardinsyah 2016; Hotz 2008; Moretti 2006b; Perignon 2016 (C); Pinkaew 2013; Radhika 2011; Thankachan 2012 | |
| 228 per 1000 | 150 per 1000 | |||||
| Haemoglobin concentration (in g/L) | The mean haemoglobin concentration (g/L) in the intervention groups was 1.83 higher (0.66 to 3.00 higher) | ‐ | 2163 | ⊕⊕⊝⊝ | Included studies: Angeles‐Agdeppa 2008; Hardinsyah 2016; Hotz 2008; Hussain 2014; Losso 2017; Moretti 2006b; Parker 2015 (C); Perignon 2016 (C); Pinkaew 2013; Radhika 2011; Thankachan 2012 | |
| Vitamin A deficiency (as defined by the study authors) | Study population | RR 0.68 (0.36 to 1.29) | 927 (4 RCTs) | ⊕⊕⊝⊝ | Included studies: Hardinsyah 2016; Perignon 2016 (C); Pinkaew 2014; Thankachan 2012 | |
| 105 per 1000 | 71 per 1000 (38 to 135) | |||||
| Serum or plasma folate (nmol/L) | The mean serum or plasma folate (nmol/L) in the intervention group was 4.30 higher (2.00 to 6.60 higher) | ‐ | 215 (1 RCT) | ⊕⊕⊝⊝ | Included study: Hardinsyah 2016 | |
| Any adverse effects (hookworm infection risk) | Study population | RR 1.78 | 785 | ⊕⊕⊝⊝ | Included study: Perignon 2016 (C) | |
| 119 per 1000 | 211 per 1000 | |||||
| Diarrhoea (as defined by study authors) | Study population | RR 3.52 | 258 | ⊕⊝⊝⊝ | Included study: Thankachan 2012 | |
| 0 per 1000 | 0 per 1000 | |||||
| *The risk in the intervention group (and its 95% confidence interval) is based on the assumed risk in the comparison group and the relative effect of the intervention (and its 95% CI). | ||||||
| GRADE Working Group grades of evidence | ||||||
| 1Downgraded 2 levels: one for serious limitations in study design or execution (risk of bias) and one for indirectness. The baseline characteristics were not similar in all groups and the method of randomisation was unclear in half of the studies. Also studies used different cut‐off levels of haemoglobin to define anaemia. Hardinsyah 2016; Parker 2015 (C); Perignon 2016 (C); Radhika 2011 used WHO cut‐off levels, Hotz 2008 used CDC criteria and Angeles‐Agdeppa 2008 and Thankachan 2012 did not name the criteria they used. | ||||||
| Rice fortified with vitamin A alone or in combination with other micronutrients compared to unfortified rice (no micronutrients added) for addressing micronutrient malnutrition | |||||
| Patient or population: general population older than 2 years of age (including pregnant women) from any country | |||||
| Outcomes | Anticipated absolute effects* (95% CI) | Relative effect | № of participants | Certainty of the evidence | Comments |
| Risk with rice fortified with vitamin A alone or in combination with other micronutrients | |||||
| Haemoglobin concentration (g/L) | MD 10 higher | ‐ | 74 | ⊕⊕⊕⊝ | Included study: Hussain 2014 |
| Serum or plasma retinol (µmol/L) | MD 0.17 higher | ‐ | 74 | ⊕⊕⊕⊝ | Included study: Hussain 2014 |
| *The risk in the intervention group (and its 95% confidence interval) is based on the assumed risk in the comparison group and the relative effect of the intervention (and its 95% CI). | |||||
| GRADE Working Group grades of evidence | |||||
| 1Downgraded by 2 levels: one level for risk of bias and one level for indirectness. The only study was carried out in India with a small sample size (250 children aged 5‐8 years) attending a school with a subsidised lunch feeding programme (Hussain 2014). | |||||
| Forms of rice | Description of rice |
| Rough rice (paddy rice) | Rice kernels still enclosed in an inedible, protective hull |
| Brown rice | Rice with only the hull removed. Bran layers and rice germ remain, giving the rice a brown colour |
| Parboiled rice | Rice pressurised to gelatinise the starch within the rice kernel, resulting in a firmer, more separate grain that is more stable and less susceptible to overcooking than regular‐milled white rice |
| Regular‐milled white rice (milled rice) | Polished whole rice, or polished rice. Hull, bran layer and germ have all been removed |
| Precooked rice | Regular milled white rice, parboiled milled white rice, and brown rice can be precooked and dehydrated before packaging. Examples of precooked rice are quick‐cooking rice, instant rice, and boil‐in‐the‐bag rice |
| Individually quick frozen (IQF) rice | Cooked grains are individually frozen before packaging |
| Crisped/puffed/expanded rice | Kernels can be processed in a number of different ways and shapes to meet particular manufacturing need |
| Adapted from Dexter 1998. | |
| Study and year (Country) | Participants | Type of rice fortification and dosage | Duration of intervention | Overall risk of bias |
| RCTs (individual randomisation) | ||||
| (Philippines) | 180 anaemic children aged 6‐9 years excluding severe anaemia (Hb < 70 g/L), history of blood disorders and other haemoglobinopathies |
| 6 months | High |
| (Indonesia) | 200 post‐menarchal adolescent girls 14‐18 years of age attending boarding school |
| 4 months | High |
| (Mexico) | 180 non‐pregnant, non‐lactating women 18‐49 years of age with moderate to low Hb concentrations from 6 factories |
| 6 months | High |
| (India) | 222 iron‐ and vitamin A‐depleted children 5‐8 years of age attending a subsidised lunch feeding programme |
| 6 months | High |
| (USA) | 17 menstruating women with iron‐deficiency anaemia |
| 2 weeks | High |
| (India) | 184 iron‐depleted children aged 6‐13 years from a primary school serving the Rock‐Colony neighbourhood |
| 7 months | Low |
| (Thailand) | The study was conducted in 8 primary schools with children aged 4‐12 years and they were mainly from low‐income families. |
| 5 months | High |
| (Thailand) | One primary school in the Muang district, of Thailand with children aged 8‐12 years, were the study participants |
| 2 months | High |
| (India) | 140 children aged between 5 and 11 years (with haemoglobin > 70 g/L) |
| 8 months | Low |
| (India) | Total of 258 anaemic (Hb concentrations 115 g/L for 6–11 years and 120 g/L for 12 years) children attending 4 primary schools aged 6‐12 years |
| 6 months | High |
| RCTs (cluster randomisation) | ||||
| (Burundi) | The study included 1071 children from 12 schools in Burundi aged between 7 and 11 years |
| 7 months | High |
| (Cambodia) | The study was a double‐blind cluster‐randomised, placebo‐controlled trial conducted among a total of 2440 school‐going children aged 6‐16 years. |
| 6 months | High |
| Non‐randomised studies (controlled before‐and‐after studies) | ||||
| (Bangladesh) | 870 women aged 15‐49 years excluding severe anaemia (435/group) at baseline and 800 (400/group) at end line |
| 12 months | High |
| (Brazil) | 131 non‐anaemic children between 2 and 6 years old, of both genders, participated in the study. |
| 4 months | High |
| (Thailand) | 2250 children aged 1.5‐9 years from 29 villages |
| 4 years | High |
| (Brazil) | 303 children 2‐5 years of age attending 2 public schools in City of Sobral‐Ceará, in the northeast of Brazil, between August and December 2010 |
| 18 weeks | High |
| Non‐randomised studies (controlled cross‐sectional study) | ||||
| (Philippines) | 574 children aged between 3 and 18 years 2188 Government employees with their families 1416 military personnel (clinical assessment limited to 350 in the experimental group and 116 in the control group) |
| 8 months | High |
| CBA: controlled before‐and‐after study; Hb: haemoglobin; RCT: randomised controlled trial | ||||
| Study | Place | Race/ethnicity | Occupation | Gender | Religion/ culture/education | Socio‐economic status | Social status | Others/ disability/ age/ sexual orientation | Overall PROGRESS‐Plus |
| Metro Manila, Division Pasig; Philippines | No specific mention, apart from the locality of the school in the capital city | School children | Male 99 + female 81 | No religion mentioned; children going to San Joaquin Elementary School (public) | Not mentioned | Not mentioned | Anaemic children; sexual orientation not mentioned | This study was carried out among 180 anaemic children going to a government elementary school. | |
| Vulnerable Group | Not mentioned specifically, however, they were the local resident women. | It included professional workers, | Non‐pregnant women aged 15‐49 years | No religion mentioned; nearly 25% without any education | No direct estimate provided; however, most of the study participants were from lower socioeconomic strata | Not mentioned | Women with severe anaemia were excluded. Sexual orientation is not mentioned | The study was carried out among 870 women of reproductive age and local residents of Bangladesh | |
| Brazil | Not specified | School‐going children | No religion mentioned, attending philanthropic schools | Not mentioned | Not mentioned | Children, 2‐6 years old | This study was carried out in 2 public schools among non‐anaemic children 2‐6 years of age during 4 consecutive months. | ||
| Chiang Mai villages in tile valley of the Ping River, Thailand | Thai children | Children in the community | Male 1121 + female 1109 | No religion mentioned. Children in the study villages | Not mentioned | Low/middle | Normal children; sexual orientation not mentioned | The study included 2230 children attending pre‐school and school from the low/middle social background | |
| Medan of North Sumatra Province, Indonesia | The majority of participants' ethnicity was Javanese and Bataknese | Teenage girls attending boarding school | Female | There is mention of the Ramadan fasting month during the second week of June | The family income ranges from 4.9 million to 5.5 million Rupiahs (Approximately 340 to 390 US Dollars) | Not mentioned | Age 14‐18 years of age | This study was carried out among post‐menarchal adolescent girls attending boarding school in Indonesia. The study lasted 4 months. | |
| Morelos State, Mexico | Mexican women | Factory workers | Women only | No religion mentioned; 18‐49 years | Low/middle school | Low/middle | Anaemic women; sexual orientation not mentioned | This study included women with altitude‐adjusted Hb concentrations between 105 | |
| India | Iron and vitamin A‐depleted 5‐8‐year‐old children attending a subsidised lunch feeding programme | Children attending a school‐based feeding programme | Not specified | Not reported | Not reported | Not mentioned, although programme is subsidised | 5‐8 years of age | This study included 222 children aged 5‐8 years attending a school where there was a subsidised lunch feeding programme in India receiving a 200‐250 g meal of cooked rice daily. | |
| Baton Rouge, USA | In the iron‐fortified group: 4 white, 3 black or African‐American, 1 Asian, 1 other; in the unfortified rice group: 3 white, 2 black or African American, 1 Asian | Women only | Not reported | Not mentioned | Not mentioned | 18‐50 years of age | This study included women with iron‐deficiency anaemia recruited through web and phone interviews and then in a clinic. | ||
| Franciscan primary school serving the | Indian | School‐going children | Not mentioned | 6‐13 years | Low | Low | Children with iron deficiency; sexual orientation not mentioned | Study included children having iron deficiency from an urban slum neighbourhood in India, belonging to low socioeconomic status and low social class | |
| Public schools in City of Sobral‐Ceará, in the northeast of Brazil | Not reported | School‐going children | Fortified rice group: 65 male: 73 female; unfortified rice group: 79 male: 86 female | 2‐5 years of age | Not reported. Family income 300 USD or less (it is unclear if this is weekly or monthly income ‐ not reported). 126/138 participants from iron‐fortified group versus 154/165 participants from unfortified group. | Not mentioned | Children 2‐5 years of age. Other information not reported | This before‐and‐after study included children 2‐5 years of age from 2 public schools in northeast Brazil receiving the school lunch programme and the fortified/unfortified intervention once a week. | |
| The study was carried out in Muyinga Province in Burundi catering to mainly agrarian population | Burundians | School‐going children | Female: 51.1% in intervention arm, 55.3% in control arm | Religion was not mentioned. 7‐11 years | Mean socioeconomic status score quintile = 3.03 (1.45) for intervention arm and 2.97 (1.37) for control arm | Not mentioned | Children with Hb level 70‐110 g/L and those who had not taken any nutritional supplements during the past 1 month since commencement of the study were included. Sexual orientation is not mentioned. | This cluster‐RCT included 904 children who were mild to moderately anaemic from the selected schools of Burundi and mainly with an agricultural background. | |
| The study was carried out in Kampung Speu Province of Cambodia | Cambodians | School‐going children | Male and female participants had equal representation (50% each) | 6‐16 years | Not mentioned | Not mentioned | Excluding severely anaemic children. All in the eligible age group were included in the study. Sexual orientation not mentioned | The cluster‐RCT included children from selected schools of Cambodia in KamPong Speu province with rice farming as a predominant occupation and income source. | |
| Satun province, west coast of southern Thailand | Thai Muslims | School children | Male, 98 + female 105 | Majority Muslim, age group of 7‐12 years | Low | Low/middle | Children with zinc deficiency; sexual orientation not mentioned | This study included school‐going children from low socioeconomic status and having zinc deficiency in Thailand. | |
| Muang District, Satun Province of southern Thailand | Thai Muslims | School Children | Males, 24 and females, 26 | Majority Muslims in the age group 8‐12 years | Low | Low/middle | Children who had consumed the triple‐fortified rice before or showed clinical symptoms of VAD (Bitots spot or ocular signs of xerophthalmia) or serum retinol values of < 0.7m mol/L were | This study included school‐going children from low socioeconomic status and having zinc deficiency in Thailand. | |
| Village of Keesara; Andhra Pradesh State in India | Indian | School children | Male 56 + female 90 | No mention of religion; age group of 5‐11 years | Low/middle | Low/middle | Anaemic children; sexual orientation not mentioned | The study included anaemic children from low‐middle socioeconomic background belonging to a rural area in India. | |
| Bataan, Philippines | Filipinos | Children and military personnel | Male and female, but proportions not reported | No mention of religion or education | Children lived in a welfare institution; military personnel were fully employed | Not mentioned | No exclusions were reported; sexual orientation was not mentioned | The study was conducted among children living in a welfare institution and among military personnel in the Philippines. | |
| Primary schools in | Indians | School children | Male 47%, female 53% | Hindu > Christians > Muslim; 6‐12 years | Low/middle school | Low | Anaemic children; sexual orientation not mentioned | This study included anaemic school going children from low socioeconomic background from an urban area India. | |
| Hb: haemoglobin; RCT: randomised controlled trial | |||||||||
| Study | Elemental iron (mg) | Vitamin Aa (mg) | Zinc (mg) | Folic acid (µg) | Vitamin B1 (thiamin) (mg) | Vitamin B2 (riboflavin) (mg) | Vitamin B3 (niacin) (mg) | Vitamin B6 (pyridoxine) (mg) | Vitamin B12 (cobalamin) (µg) |
| 6.25 | ‐ | ‐ | ‐ | ‐ | ‐ | ‐ | ‐ | ‐ | |
| Ara 2019 (CBA) | 6 | 0.15 | 4.00 | 130 | 0.40 | 1.0 | |||
| Della Lucia 2016 (CBA) | 8.4 | ‐ | 4.20 | 144 | 0.72 | ‐ | ‐ | ‐ | ‐ |
| Gershoff 1977 (CBA) | 0.2 | 0.81 | 0.087 | 0.04 | |||||
| 0.2 | 0.81 | 0.087 | 0.04 | ||||||
| 0.2 | 0.81 | 0.087 | 0.04 | ||||||
| 10.8 | 0.28 | 5.20 | 145 | ‐ | 3.2 | ||||
| 26.6 | ‐ | ‐ | ‐ | ‐ | ‐ | ‐ | ‐ | ‐ | |
| 4 | ‐ | ‐ | ‐ | ‐ | ‐ | ‐ | ‐ | ||
| ‐ | 1.20 (as beta‐carotene) | ‐ | ‐ | ‐ | ‐ | ‐ | ‐ | ‐ | |
| ‐ | 0.18 | ‐ | ‐ | ‐ | ‐ | ‐ | ‐ | ‐ | |
| 4 | 0.18 | ‐ | ‐ | ‐ | ‐ | ‐ | ‐ | ‐ | |
| 4 | 1.20 (as beta‐carotene) | ‐ | ‐ | ‐ | ‐ | ‐ | ‐ | ‐ | |
| 18 | ‐ | ‐ | ‐ | ‐ | ‐ | ‐ | ‐ | ‐ | |
| 20 | ‐ | ‐ | ‐ | ‐ | ‐ | ‐ | ‐ | ‐ | |
| Nogueira Arcanjo 2013 (CBA) | 112.8 | ‐ | ‐ | ‐ | ‐ | ‐ | ‐ | ‐ | ‐ |
| 11.9 | ‐ | 5.70 | 400 | 1.80 | ‐ | ‐ | ‐ | ‐ | |
| 10.67 | ‐ | 3.04 | 170 | 1.06 | ‐ | ‐ | ‐ | ‐ | |
| 7.55 | 0.64 | 2.02 | 280 | 1.43 | ‐ | 12.57 | ‐ | 3.8 | |
| 7.46 | 0.29 | 3.68 | 140 | 0.69 | ‐ | 7.98 | 0.92 | 1.26 | |
| 20 | 2.10 | 18 | ‐ | ‐ | ‐ | ‐ | ‐ | ‐ | |
| 20 | 2.10 | 18 | ‐ | ‐ | ‐ | ‐ | ‐ | ‐ | |
| 15 | ‐ | ‐ | ‐ | ‐ | ‐ | ‐ | ‐ | ‐ | |
| Salcedo 1950 (CBA) | 2.86 | ‐ | ‐ | ‐ | 0.44 | ‐ | 0.33 | ‐ | ‐ |
| 12.5 | 0.50 | 3 | 75 | 0.38 | ‐ | 5 | 0.38 | 0.75 | |
| 6.25 | 0.50 | 3 | 75 | 0.38 | ‐ | 5 | 0.38 | 0.75 | |
| C: cluster randomised; CBA: controlled before‐and‐after study | |||||||||
| aOne international unit (IU) vitamin A is equivalent to 0.0003 mg of retinol, 0.0006 mg of beta‐carotene and 0.0012 mg of other pro‐vitamin A carotenoids. | |||||||||
| Study | Haemoglobin threshold (g/L) | Criteria |
| Anaemia was defined as haemoglobin concentration in blood < 120 g/L | Not mentioned | |
| < 120 g/L in non‐pregnant and non‐lactating women | Not mentioned | |
| ≥ 110 g/L was used as a cut off for including children in the study. Anaemia was not defined | Not reported | |
| Haemoglobin levels were categorised as deficient < 100, low 100‐90 (g/L) | Not mentioned | |
| Severe anaemia: < 80 g/L; moderate anaemia: 80‐109 g/L; mild anaemia: 110‐119 g/L; non anaemia: ≥ 120 g/L | WHO (WHO 2011a) | |
| < 122 g/L, adjusted for average altitude of the study sites (1100 m) with the use of an equation | CDC (CDC 1989) | |
| < 110 g/L and severely anaemic (Hb < 75 g/L) were excluded | Not mentioned | |
| Not reported (iron‐deficiency anaemia was defined based on iron and ferritin levels in serum) | Not reported | |
| < 115 g/L in children aged 5–11 years | WHO (WHO 2001) | |
| < 110 g/L in children < 5 years of age | WHO (WHO 2001) | |
| For school‐aged children at 1500 m above sea level, mild anaemia was defined as Hb 115‐119 g/L, moderate anaemia Hb 85‐114 g/L, and severe anaemia Hb < 85 g/L | WHO (WHO 2011f) | |
| < 115 g/L for children aged 6‐11 years, < 120 g/L for children aged 12‐14 years and girls aged ≥ 15 years and < 130 g/L for boys aged ≥ 15 years | WHO (WHO 2001) | |
| < 120 g/L | Not mentioned | |
| Not reported | Not reported | |
| In children aged 5–11 years, anaemia (mild to moderate) was defined as Hb 70‐115 g/L. | WHO (WHO 2001) | |
| Not reported | Not reported | |
| < 115 g/L in children aged 6–11 years and < 120 g/L in participants aged ≥ 12 years | Not mentioned | |
| CDC: Centers for Disease Control and Prevention; Hb: haemoglobin; WHO: World Health Organization | ||
| Outcome (all studies included in the analysis) | Study (ICC) | RR (95% CI) | Tau² | Chi² | P value | I² |
| Anaemia (Angeles‐Agdeppa 2008; Hardinsyah 2016; Hotz 2008; Parker 2015 (C); Perignon 2016 (C); Radhika 2011; Thankachan 2012) | Parker 2015 (C) (0) | 0.83 (0.64 to 1.08) | 0.06 | 16.06 | 0.01 | 63% |
| Parker 2015 (C) (0.001) | 0.83 (0.64 to 1.08) | 0.06 | 15.72 | 0.02 | 62% | |
| Parker 2015 (C) (0.002) | 0.83 (0.64 to 1.08) | 0.06 | 15.71 | 0.02 | 62% | |
| Parker 2015 (C) (0.005) | 0.83 (0.64 to 1.07) | 0.06 | 15.12 | 0.02 | 60% | |
| Parker 2015 (C) (0.01) | 0.83 (0.64 to 1.08) | 0.06 | 14.80 | 0.02 | 59% | |
| Parker 2015 (C) (0.02723) | 0.83 (0.64 to 1.07) | 0.05 | 13.08 | 0.04 | 54% | |
| Parker 2015 (C) (0.1) | 0.81 (0.64 to 1.03) | 0.04 | 10.03 | 0.12 | 40% | |
| 0.83 (0.67 to 1.03) | 0.04 | 13.17 | 0.04 | 54% | ||
| Perignon 2016 (C) (0.001) | 0.83 (0.67 to 1.04) | 0.04 | 13.15 | 0.04 | 54% | |
| Perignon 2016 (C) (0.002) | 0.83 (0.66 to 1.04) | 0.04 | 13.16 | 0.04 | 54% | |
| Perignon 2016 (C) (0.005) | 0.83 (0.66 to 1.05) | 0.04 | 13.12 | 0.04 | 54% | |
| Perignon 2016 (C) (0.01) | 0.83 (0.65 to 1.05) | 0.05 | 13.12 | 0.04 | 54% | |
| Perignon 2016 (C) (0.02723) | 0.83 (0.64 to 1.07) | 0.05 | 13.08 | 0.04 | 54% | |
| Perignon 2016 (C)( 0.1) | 0.83 (0.63 to 1.09) | 0.06 | 13.08 | 0.04 | 54% | |
| Outcome (all studies included in the analysis) | Study (ICC) | MD (95% CI) | Tau² | Chi² | P value | I² |
| Haemoglobin concentration (Angeles‐Agdeppa 2008; Hardinsyah 2016; Hotz 2008; Hussain 2014; Losso 2017; Moretti 2006b; Parker 2015 (C); Perignon 2016 (C); Pinkaew 2013; Radhika 2011; Thankachan 2012) | Parker 2015 (C) (0) | 1.69 (0.48 to 2.91) | 1.82 | 24.15 | 0.007 | 59% |
| Parker 2015 (C) (0.001) | 1.70 (0.48 to 2.92) | 1.81 | 23.90 | 0.008 | 58% | |
| Parker 2015 (C) (0.002) | 1.71 (0.49 to 2.93) | 1.81 | 23.69 | 0.008 | 58% | |
| Parker 2015 (C) (0.005) | 1.73 (0.51 to 2.96) | 1.80 | 23.18 | 0.01 | 57% | |
| Parker 2015 (C) (0.01) | 1.77 (0.54 to 3.00) | 1.79 | 22.62 | 0.01 | 56% | |
| Parker 2015 (C)) (0.02723) | 1.85 (0.61 to 3.10) | 1.77 | 21.73 | 0.02 | 54% | |
| Parker 2015 (C)) (0.1) | 1.98 (0.71 to 3.25) | 1.76 | 20.96 | 0.02 | 52% | |
| Perignon 2016 (C)) (0) | 1.85 (0.61 to 3.09) | 1.77 | 21.98 | 0.02 | 55% | |
| Perignon 2016 (C)) (0.001) | 1.85 (0.61 to 3.09) | 1.77 | 21.97 | 0.02 | 54% | |
| Perignon 2016 (C)) (0.002) | 1.85 (0.61 to 3.09) | 1.77 | 21.96 | 0.02 | 54% | |
| Perignon 2016 (C)) (0.005) | 1.85 (0.61 to 3.10) | 1.77 | 21.93 | 0.02 | 54% | |
| Perignon 2016 (C)) (0.01) | 1.85 (0.61 to 3.10) | 1.77 | 21.89 | 0.02 | 54% | |
| Perignon 2016 (C)) (0.02723) | 1.85 (0.61 to 3.10) | 1.77 | 21.73 | 0.02 | 54% | |
| Perignon 2016 (C)) (0.1) | 1.86 (0.61 to 3.11) | 1.78 | 21.15 | 0.02 | 53% | |
| C: cluster‐randomised trial; CI: confidence interval; ICC: intra‐cluster correlation coefficient; MD: mean difference; RR: risk ratio | ||||||
| Outcome or subgroup title | No. of studies | No. of participants | Statistical method | Effect size |
| 1 Anaemia (defined as haemoglobin (Hb) below the WHO cut‐off, adjusted for altitude as appropriate) Show forest plot | 7 | 1634 | Risk Ratio (M‐H, Random, 95% CI) | 0.72 [0.54, 0.97] |
| 2 Anaemia (subgroup: by micronutrient content) Show forest plot | 7 | 1634 | Risk Ratio (M‐H, Random, 95% CI) | 0.83 [0.66, 1.04] |
| 2.1 Iron alone | 3 | 444 | Risk Ratio (M‐H, Random, 95% CI) | 0.63 [0.36, 1.09] |
| 2.2 Iron + other micronutrients | 4 | 1190 | Risk Ratio (M‐H, Random, 95% CI) | 0.95 [0.82, 1.11] |
| 3 Anaemia (subgroup: by rice fortification method) Show forest plot | 7 | 1634 | Risk Ratio (M‐H, Random, 95% CI) | 0.73 [0.55, 0.97] |
| 3.1 Hot extrusion | 5 | 1197 | Risk Ratio (M‐H, Random, 95% CI) | 0.72 [0.52, 1.01] |
| 3.2 Cold extrusion | 3 | 437 | Risk Ratio (M‐H, Random, 95% CI) | 0.75 [0.41, 1.38] |
| 3.3 Coating | 0 | 0 | Risk Ratio (M‐H, Random, 95% CI) | 0.0 [0.0, 0.0] |
| 3.4 Dusting | 0 | 0 | Risk Ratio (M‐H, Random, 95% CI) | 0.0 [0.0, 0.0] |
| 3.5 Mixed/unknown/unreported | 0 | 0 | Risk Ratio (M‐H, Random, 95% CI) | 0.0 [0.0, 0.0] |
| 4 Anaemia (subgroup: by cooking method most commonly used in trial setting) Show forest plot | 7 | 1634 | Risk Ratio (M‐H, Random, 95% CI) | 0.72 [0.54, 0.97] |
| 4.1 Soaking, and boiling with excess water | 0 | 0 | Risk Ratio (M‐H, Random, 95% CI) | 0.0 [0.0, 0.0] |
| 4.2 Boiling without excess water | 0 | 0 | Risk Ratio (M‐H, Random, 95% CI) | 0.0 [0.0, 0.0] |
| 4.3 Rinsing and boiling without excess water | 1 | 215 | Risk Ratio (M‐H, Random, 95% CI) | 0.40 [0.26, 0.63] |
| 4.4 Frying and boiling without excess water | 0 | 0 | Risk Ratio (M‐H, Random, 95% CI) | 0.0 [0.0, 0.0] |
| 4.5 Unknown/unreported | 6 | 1419 | Risk Ratio (M‐H, Random, 95% CI) | 0.81 [0.63, 1.05] |
| 5 Anaemia (subgroup: by public health significance of anaemia at baseline ) Show forest plot | 7 | 1634 | Risk Ratio (M‐H, Random, 95% CI) | 0.72 [0.54, 0.97] |
| 5.1 Not a problem (lower than 5%) | 0 | 0 | Risk Ratio (M‐H, Random, 95% CI) | 0.0 [0.0, 0.0] |
| 5.2 Mild and moderate (5% to 39.9%) | 4 | 1129 | Risk Ratio (M‐H, Random, 95% CI) | 0.69 [0.44, 1.06] |
| 5.3 Severe (40% and more) | 2 | 360 | Risk Ratio (M‐H, Random, 95% CI) | 0.87 [0.67, 1.12] |
| 5.4 Mixed/unknown/unreported | 1 | 145 | Risk Ratio (M‐H, Random, 95% CI) | 0.31 [0.09, 1.10] |
| 6 Anaemia (subgroup: by malaria endemicity) Show forest plot | 7 | 1634 | Risk Ratio (M‐H, Random, 95% CI) | 0.72 [0.54, 0.97] |
| 6.1 Some malaria risk setting | 1 | 445 | Risk Ratio (M‐H, Random, 95% CI) | 0.85 [0.55, 1.32] |
| 6.2 Malaria‐free area | 2 | 403 | Risk Ratio (M‐H, Random, 95% CI) | 0.70 [0.48, 1.03] |
| 6.3 Unknown/unreported | 4 | 786 | Risk Ratio (M‐H, Random, 95% CI) | 0.67 [0.34, 1.31] |
| 7 Iron deficiency (as defined by study authors, based on a biomarker of iron status) Show forest plot | 8 | 1733 | Risk Ratio (M‐H, Random, 95% CI) | 0.66 [0.51, 0.84] |
| 8 Iron deficiency (subgroup: by micronutrient content) Show forest plot | 8 | 1733 | Risk Ratio (M‐H, Random, 95% CI) | 0.66 [0.51, 0.84] |
| 8.1 Iron alone | 4 | 628 | Risk Ratio (M‐H, Random, 95% CI) | 0.56 [0.40, 0.80] |
| 8.2 Iron + other micronutrients | 4 | 1105 | Risk Ratio (M‐H, Random, 95% CI) | 0.78 [0.57, 1.06] |
| 9 Iron deficiency (subgroup: by rice fortification method) Show forest plot | 8 | 1733 | Risk Ratio (M‐H, Random, 95% CI) | 0.66 [0.52, 0.83] |
| 9.1 Hot extrusion | 6 | 1283 | Risk Ratio (M‐H, Random, 95% CI) | 0.66 [0.51, 0.87] |
| 9.2 Cold extrusion | 3 | 450 | Risk Ratio (M‐H, Random, 95% CI) | 0.65 [0.38, 1.09] |
| 9.3 Coating | 0 | 0 | Risk Ratio (M‐H, Random, 95% CI) | 0.0 [0.0, 0.0] |
| 9.4 Dusting | 0 | 0 | Risk Ratio (M‐H, Random, 95% CI) | 0.0 [0.0, 0.0] |
| 9.5 Mixed/unknown/unreported | 0 | 0 | Risk Ratio (M‐H, Random, 95% CI) | 0.0 [0.0, 0.0] |
| 10 Iron deficiency (subgroup: by cooking method most commonly used in trial setting) Show forest plot | 8 | 1733 | Risk Ratio (M‐H, Random, 95% CI) | 0.66 [0.51, 0.84] |
| 10.1 Soaking, and boiling with excess water | 0 | 0 | Risk Ratio (M‐H, Random, 95% CI) | 0.0 [0.0, 0.0] |
| 10.2 Boiling without excess water | 0 | 0 | Risk Ratio (M‐H, Random, 95% CI) | 0.0 [0.0, 0.0] |
| 10.3 Rinsing and boiling without excess water | 1 | 215 | Risk Ratio (M‐H, Random, 95% CI) | 0.79 [0.51, 1.21] |
| 10.4 Frying and boiling without excess water | 0 | 0 | Risk Ratio (M‐H, Random, 95% CI) | 0.0 [0.0, 0.0] |
| 10.5 Unknown/unreported | 7 | 1518 | Risk Ratio (M‐H, Random, 95% CI) | 0.63 [0.46, 0.84] |
| 11 Iron deficiency (subgroup: by public health significance of anaemia at baseline ) Show forest plot | 8 | 1733 | Risk Ratio (M‐H, Random, 95% CI) | 0.66 [0.51, 0.84] |
| 11.1 Not a problem (lower than 5%) | 0 | 0 | Risk Ratio (M‐H, Random, 95% CI) | 0.0 [0.0, 0.0] |
| 11.2 Mild and moderate (5% to 39.9%) | 4 | 1046 | Risk Ratio (M‐H, Random, 95% CI) | 0.77 [0.55, 1.07] |
| 11.3 Severe (40% and more) | 2 | 358 | Risk Ratio (M‐H, Random, 95% CI) | 0.57 [0.26, 1.27] |
| 11.4 Mixed/unknown/unreported | 2 | 329 | Risk Ratio (M‐H, Random, 95% CI) | 0.63 [0.39, 1.01] |
| 12 Iron deficiency (subgroup: by malaria endemicity) Show forest plot | 8 | 1733 | Risk Ratio (M‐H, Random, 95% CI) | 0.66 [0.51, 0.84] |
| 12.1 Some malaria risk setting | 1 | 485 | Risk Ratio (M‐H, Random, 95% CI) | 0.86 [0.48, 1.53] |
| 12.2 Malaria‐free area | 3 | 585 | Risk Ratio (M‐H, Random, 95% CI) | 0.58 [0.41, 0.84] |
| 12.3 Mixed/unknown/unreported | 4 | 663 | Risk Ratio (M‐H, Random, 95% CI) | 0.61 [0.39, 0.96] |
| 13 Haemoglobin concentration (g/L) Show forest plot | 11 | 2163 | Mean Difference (IV, Random, 95% CI) | 1.83 [0.66, 3.00] |
| 14 Haemoglobin concentration (subgroup: by micronutrient content) Show forest plot | 11 | 2163 | Mean Difference (IV, Random, 95% CI) | 2.09 [0.75, 3.44] |
| 14.1 Iron alone | 6 | 698 | Mean Difference (IV, Random, 95% CI) | 3.93 [1.24, 6.62] |
| 14.2 Iron + other micronutrients | 6 | 1465 | Mean Difference (IV, Random, 95% CI) | 1.06 [0.15, 1.98] |
| 15 Haemoglobin concentration (subgroup: by rice fortification method) Show forest plot | 11 | 2163 | Mean Difference (IV, Random, 95% CI) | 1.60 [0.81, 2.38] |
| 15.1 Hot extrusion | 7 | 1563 | Mean Difference (IV, Random, 95% CI) | 1.93 [0.53, 3.32] |
| 15.2 Cold extrusion | 3 | 437 | Mean Difference (IV, Random, 95% CI) | 1.54 [0.58, 2.51] |
| 15.3 Coating | 1 | 15 | Mean Difference (IV, Random, 95% CI) | 8.20 [‐12.14, 28.54] |
| 15.4 Dusting | 0 | 0 | Mean Difference (IV, Random, 95% CI) | 0.0 [0.0, 0.0] |
| 15.5 Mixed/unknown/unreported | 1 | 148 | Mean Difference (IV, Random, 95% CI) | ‐4.0 [‐11.72, 3.72] |
| 16 Haemoglobin concentration (subgroup: by cooking method most commonly used in trial setting) Show forest plot | 11 | 2163 | Mean Difference (IV, Random, 95% CI) | 1.83 [0.66, 3.00] |
| 16.1 Soaking, and boiling with excess water | 0 | 0 | Mean Difference (IV, Random, 95% CI) | 0.0 [0.0, 0.0] |
| 16.2 Boiling without excess water | 0 | 0 | Mean Difference (IV, Random, 95% CI) | 0.0 [0.0, 0.0] |
| 16.3 Rinsing and boiling without excess water | 1 | 215 | Mean Difference (IV, Random, 95% CI) | 3.80 [0.86, 6.74] |
| 16.4 Unknown/unreported | 10 | 1948 | Mean Difference (IV, Random, 95% CI) | 1.62 [0.43, 2.81] |
| 17 Haemoglobin concentration (subgroup: by public health significance of anaemia at baseline) Show forest plot | 11 | 2163 | Mean Difference (IV, Random, 95% CI) | 1.83 [0.66, 3.00] |
| 17.1 Not a problem (lower than 5%) | 0 | 0 | Mean Difference (IV, Random, 95% CI) | 0.0 [0.0, 0.0] |
| 17.2 Mild and moderate (5% to 39.9%) | 6 | 1459 | Mean Difference (IV, Random, 95% CI) | 1.67 [‐0.10, 3.44] |
| 17.3 Severe (40% and more) | 2 | 360 | Mean Difference (IV, Random, 95% CI) | 1.07 [‐0.84, 2.98] |
| 17.4 Mixed/unknown/unreported | 3 | 344 | Mean Difference (IV, Random, 95% CI) | 3.42 [1.10, 5.73] |
| 18 Haemoglobin concentration (subgroup: by malaria endemicity) Show forest plot | 11 | 2163 | Mean Difference (IV, Random, 95% CI) | 1.83 [0.66, 3.00] |
| 18.1 Some malaria risk setting | 1 | 445 | Mean Difference (IV, Random, 95% CI) | 0.90 [0.65, 1.15] |
| 18.2 Malaria‐free area | 3 | 587 | Mean Difference (IV, Random, 95% CI) | 3.15 [0.98, 5.31] |
| 18.3 Mixed/unknown/unreported | 7 | 1131 | Mean Difference (IV, Random, 95% CI) | 1.33 [‐0.48, 3.14] |
| 19 Vitamin A deficiency (as defined by study authors, by using a biomarker of vitamin A) Show forest plot | 4 | 927 | Risk Ratio (M‐H, Random, 95% CI) | 0.68 [0.36, 1.29] |
| 20 Vitamin A deficiency (subgroup: by micronutrient content) Show forest plot | 4 | 927 | Risk Ratio (M‐H, Random, 95% CI) | 0.68 [0.36, 1.29] |
| 20.1 Iron alone | 0 | 0 | Risk Ratio (M‐H, Random, 95% CI) | 0.0 [0.0, 0.0] |
| 20.2 Iron + other micronutrients | 4 | 927 | Risk Ratio (M‐H, Random, 95% CI) | 0.68 [0.36, 1.29] |
| 21 Vitamin A deficiency (subgroup: by rice fortification method) Show forest plot | 4 | 927 | Risk Ratio (M‐H, Random, 95% CI) | 0.68 [0.41, 1.14] |
| 21.1 Hot extrusion | 4 | 765 | Risk Ratio (M‐H, Random, 95% CI) | 0.70 [0.35, 1.39] |
| 21.2 Cold extrusion | 1 | 162 | Risk Ratio (M‐H, Random, 95% CI) | 0.61 [0.24, 1.54] |
| 21.3 Coating | 0 | 0 | Risk Ratio (M‐H, Random, 95% CI) | 0.0 [0.0, 0.0] |
| 21.4 Dusting | 0 | 0 | Risk Ratio (M‐H, Random, 95% CI) | 0.0 [0.0, 0.0] |
| 21.5 Mixed/unknown/unreported | 0 | 0 | Risk Ratio (M‐H, Random, 95% CI) | 0.0 [0.0, 0.0] |
| 22 Vitamin A deficiency (subgroup: by cooking method most commonly used in trial setting) Show forest plot | 4 | 927 | Risk Ratio (M‐H, Random, 95% CI) | 0.68 [0.36, 1.29] |
| 22.1 Soaking, and boiling with excess water | 0 | 0 | Risk Ratio (M‐H, Random, 95% CI) | 0.0 [0.0, 0.0] |
| 22.2 Boiling without excess water | 0 | 0 | Risk Ratio (M‐H, Random, 95% CI) | 0.0 [0.0, 0.0] |
| 22.3 Rinsing and boiling without excess water | 1 | 215 | Risk Ratio (M‐H, Random, 95% CI) | 1.10 [0.47, 2.60] |
| 22.4 Frying and boiling without excess water | 0 | 0 | Risk Ratio (M‐H, Random, 95% CI) | 0.0 [0.0, 0.0] |
| 22.5 Unknown/unreported | 3 | 712 | Risk Ratio (M‐H, Random, 95% CI) | 0.55 [0.25, 1.22] |
| 23 Vitamin A deficiency (subgroup: by public health significance of anaemia at baseline ) Show forest plot | 4 | 927 | Risk Ratio (M‐H, Random, 95% CI) | 0.68 [0.36, 1.29] |
| 23.1 Not a problem (lower than 5%) | 0 | 0 | Risk Ratio (M‐H, Random, 95% CI) | 0.0 [0.0, 0.0] |
| 23.2 Mild and moderate (5% to 39.9%) | 3 | 695 | Risk Ratio (M‐H, Random, 95% CI) | 0.60 [0.29, 1.24] |
| 23.3 Severe (40% and more) | 1 | 232 | Risk Ratio (M‐H, Random, 95% CI) | 1.46 [0.30, 7.07] |
| 23.4 Mixed/unknown/unreported | 0 | 0 | Risk Ratio (M‐H, Random, 95% CI) | 0.0 [0.0, 0.0] |
| 24 Vitamin A deficiency (subgroup: by malaria endemicity) Show forest plot | 4 | 927 | Risk Ratio (M‐H, Random, 95% CI) | 0.68 [0.36, 1.29] |
| 24.1 Some malaria risk setting | 1 | 442 | Risk Ratio (M‐H, Random, 95% CI) | 0.57 [0.30, 1.08] |
| 24.2 Malaria‐free area | 1 | 232 | Risk Ratio (M‐H, Random, 95% CI) | 1.46 [0.30, 7.07] |
| 24.3 Unknown/unreported | 2 | 253 | Risk Ratio (M‐H, Random, 95% CI) | 0.55 [0.12, 2.59] |
| 25 Serum or plasma folate (nmol/L) Show forest plot | 1 | Mean Difference (IV, Random, 95% CI) | Totals not selected | |
| 26 Any adverse effects Show forest plot | 2 | 1019 | Risk Ratio (M‐H, Random, 95% CI) | 1.21 [0.53, 2.76] |
| 26.1 Hookworm infection risk | 1 | 785 | Risk Ratio (M‐H, Random, 95% CI) | 1.78 [1.18, 2.70] |
| 26.2 Abdominal pain more than 3 days | 1 | 234 | Risk Ratio (M‐H, Random, 95% CI) | 0.77 [0.42, 1.42] |
| 27 Diarrhoea (as defined by study authors) Show forest plot | 1 | Risk Ratio (M‐H, Random, 95% CI) | Totals not selected | |
| 28 Serum or plasma retinol (µmol/L) Show forest plot | 5 | 727 | Mean Difference (IV, Random, 95% CI) | 0.04 [‐0.13, 0.21] |
| 29 Serum or plasma zinc (µmol/L) Show forest plot | 3 | 618 | Mean Difference (IV, Random, 95% CI) | 0.38 [‐0.08, 0.83] |
| 30 Height‐for‐age Z‐score Show forest plot | 1 | Mean Difference (IV, Random, 95% CI) | Totals not selected | |
| 31 Weight‐for‐height Z‐score Show forest plot | 1 | Mean Difference (IV, Random, 95% CI) | Totals not selected | |
| Outcome or subgroup title | No. of studies | No. of participants | Statistical method | Effect size |
| 1 Haemoglobin concentration (g/L) Show forest plot | 1 | Mean Difference (IV, Random, 95% CI) | Totals not selected | |
| 2 Serum or plasma retinol (µmol/L) Show forest plot | 1 | Mean Difference (IV, Random, 95% CI) | Totals not selected | |